Published: August 19th, 2021
Apple is a revolutionary company that changed the personal computer era from the 1970s with Apple II. However, the biggest success came with the modern iPhone that created a loyal base of customers since 2007. The hardware and software integration of the modern iPhone is unique and effective that made the Apple product an industry standard. Apple always surprises people with innovations that can change the world. The recent talk about the collaboration with car makers made investors focus on the company closely.
Apple released its second-quarter earnings report with mixed sentiment. Although the earnings were higher in iPhone, iPad, and Mac sales, it failed to catch investors’ attention. After releasing the report, Apple stock shot higher above the 150.00 level and made an all-time high but could not hold the momentum. Considering the multiple failures to break above the 150.00 barriers with the upcoming release of the iPhone 13, there is a possibility of a deep correction in the Apple stock.
Let’s see the upcoming price direction from the Apple Stock [AAPL] technical analysis:
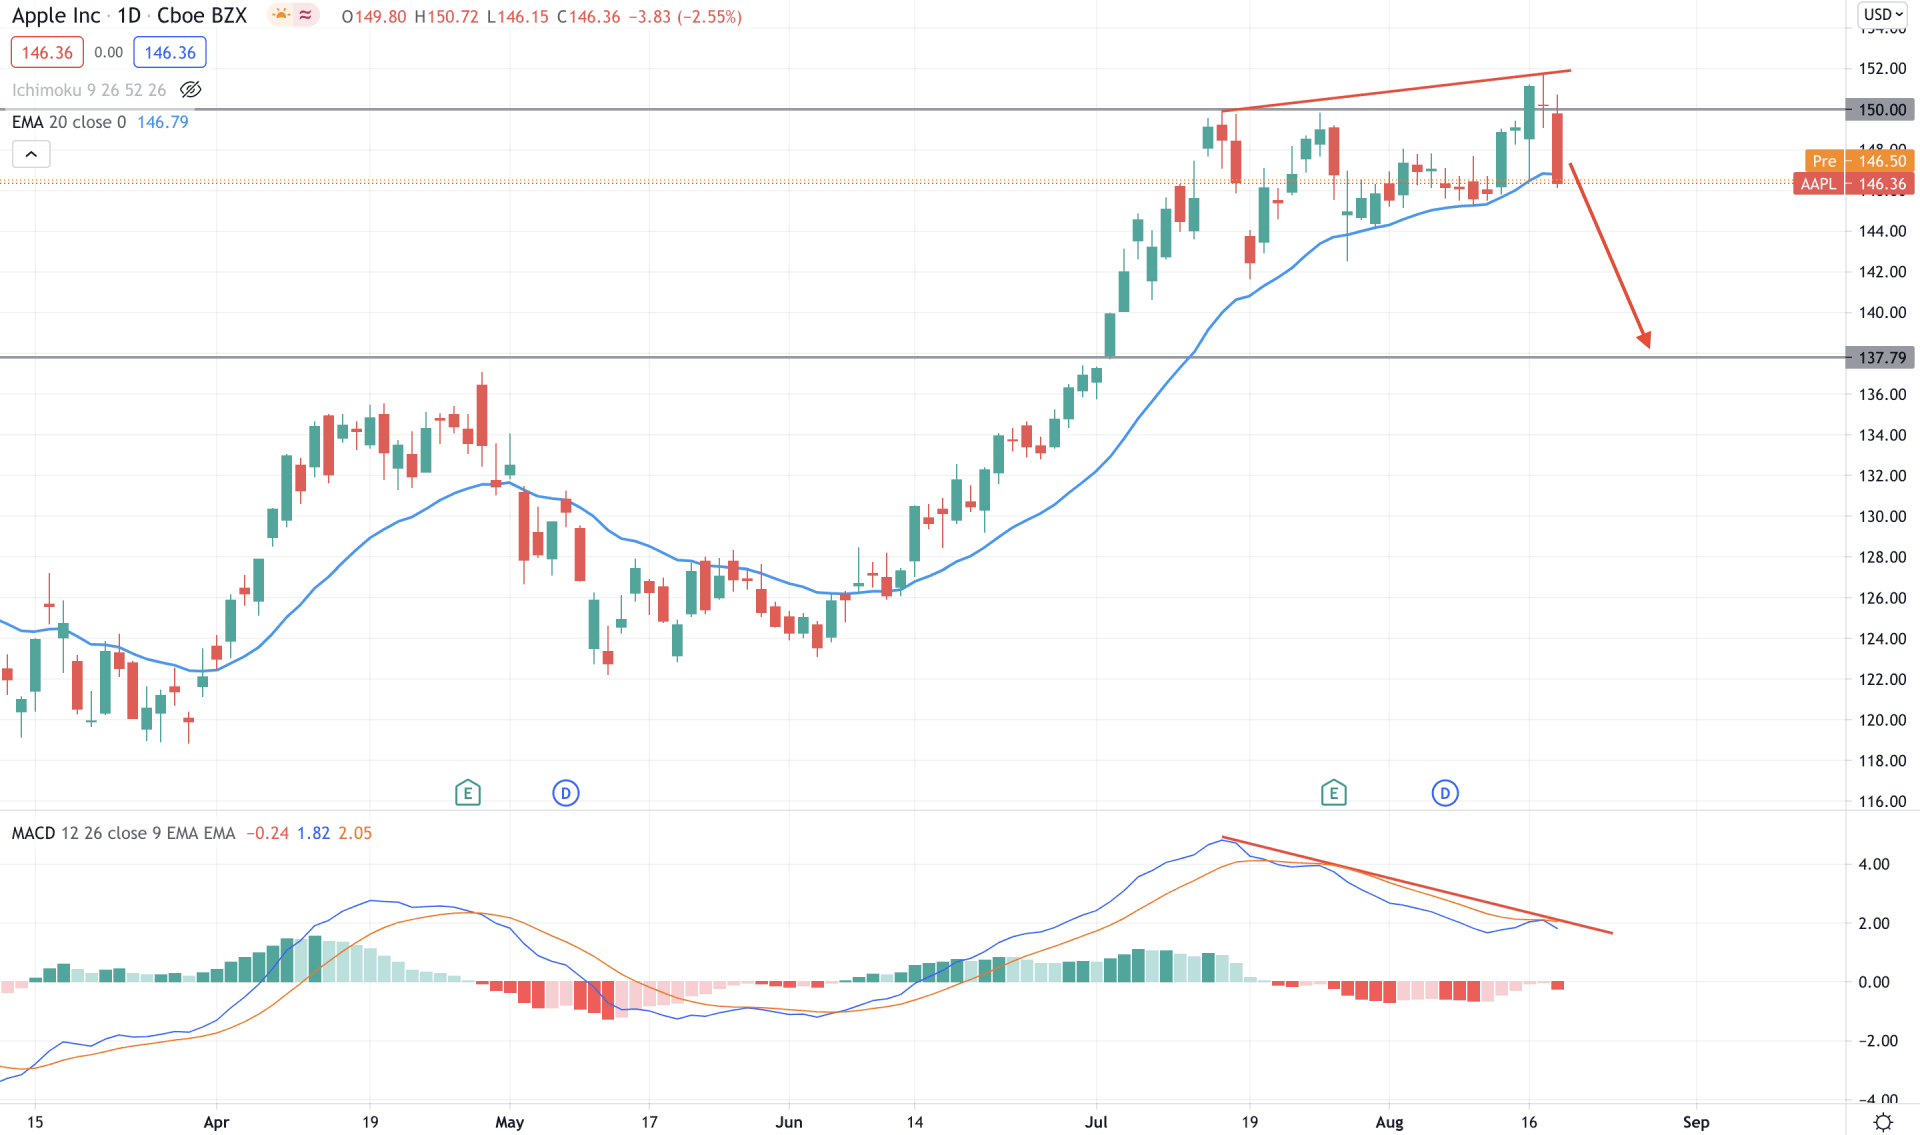
Apple stock initiated a strong bullish pressure since the beginning of 2nd half of 2021. The price failed to move below the 124.00 support level and moved to the 150.00 key resistance level with an impulsive bullish pressure. However, the price tried to move above the 150.00 level multiple time but failed. Therefore, the most recent rejection with a bearish daily close below the dynamic 20 EMA increased the bearish possibility for the coming days.
In the indicator window, we can see that the price formed a regular divergence with MACD. The false break above the 150.00 level and the regular divergence are major signs of buyers’ failure at this level.
Moreover, investors are hoping to see the new iPhone 13 release in September, and until then, a corrective momentum is expected. In this condition, the bearish possibility is valid as long as the price is trading below the 150.00 key resistance level.
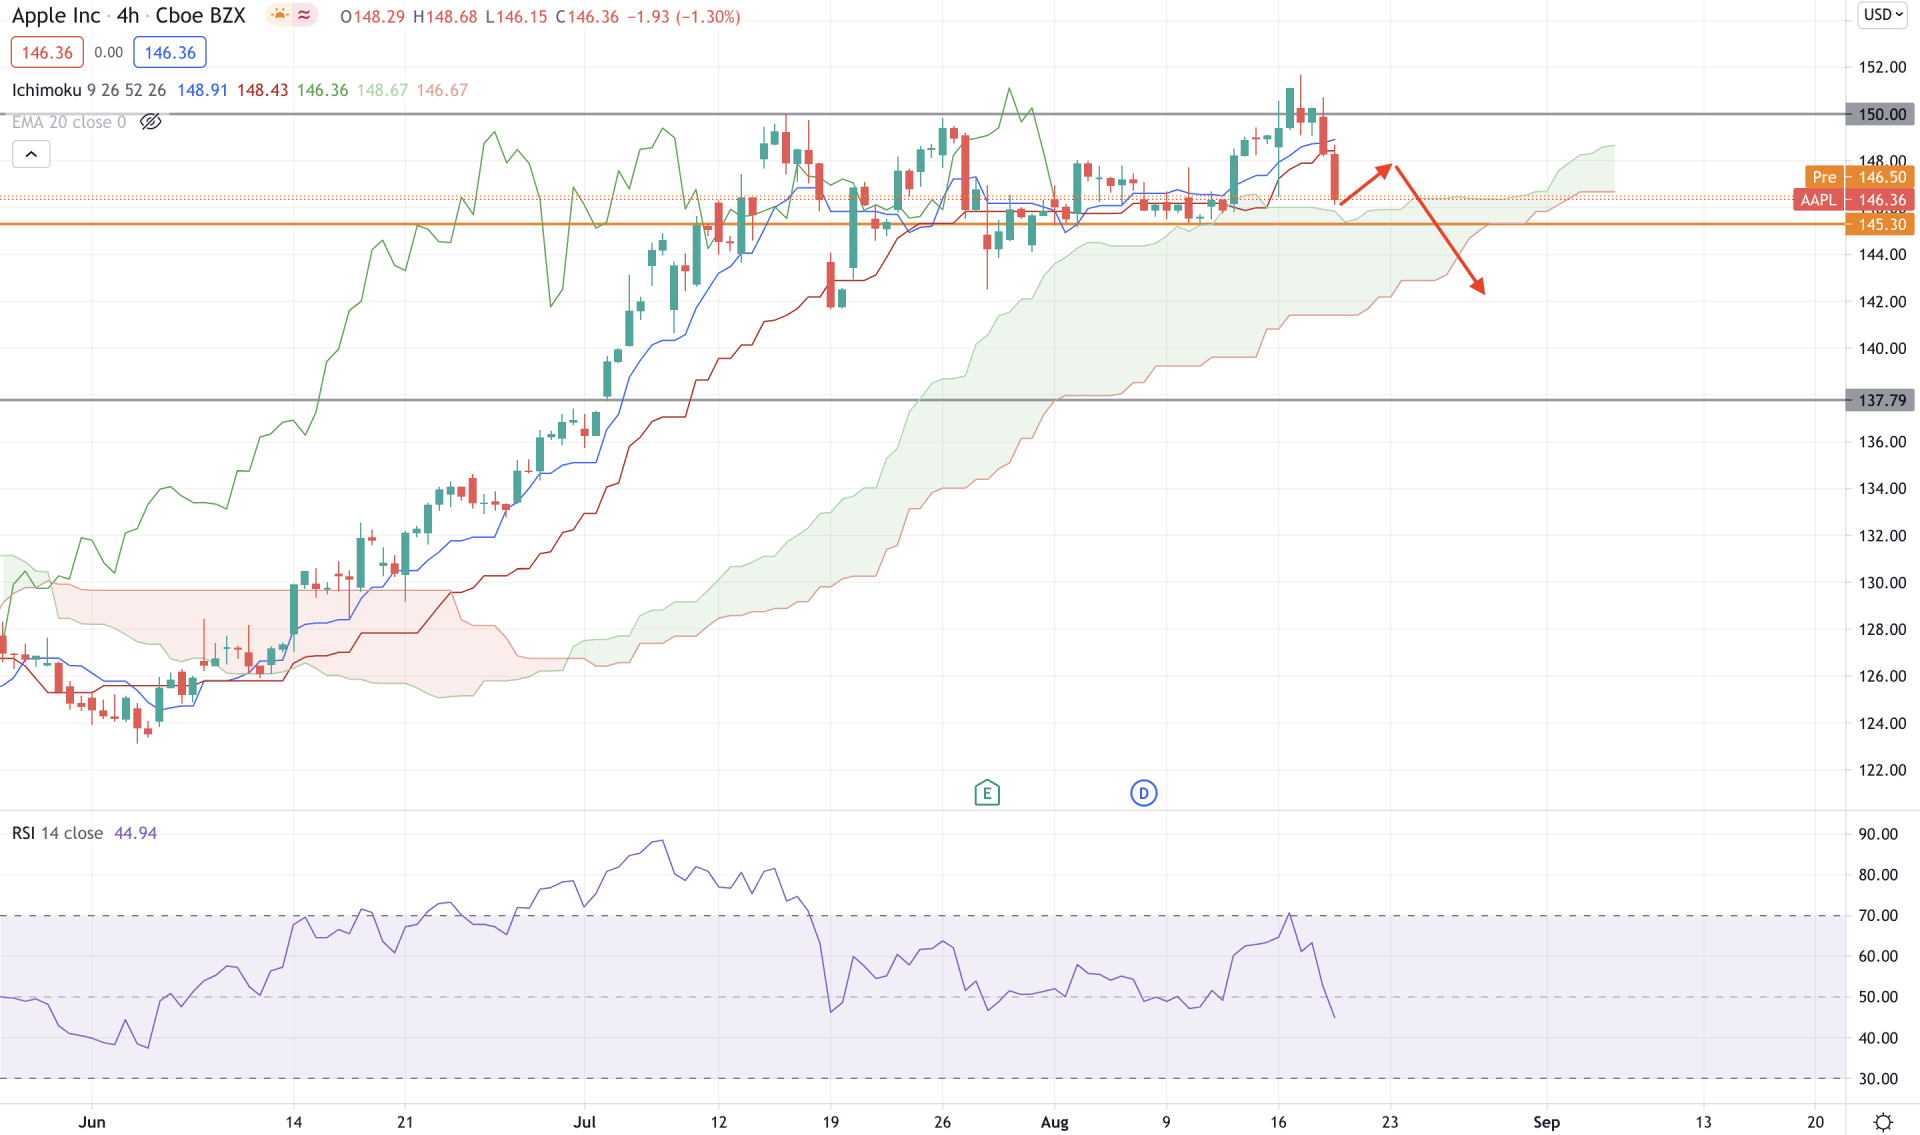
If we plot the Ichimoku Kinko Hyo on the H4 chart, we would see that the price had a strong position above the cloud resistance for a considerable time. However, the recent failure to break above the 150.00 level increases the possibility of invalidating the current bullish continuation pattern. On the other hand, the price is currently facing support from the Ichimoku Cloud and 145.50 static level, where any bullish break above the Kijun Sen may resume the current bullish pressure.
In the above image, we can see that the price became volatile after reaching the 150.00 key resistance level where the RSI failed to stay above the overbought 70 levels. Therefore, the selling pressure from RSI and bearish H4 close below the Kijun Sen may increase the bearish correction in the coming session.
Based on the H4 context, a break below the 145.50 static support with a bearish H4 close may increase the selling possibility towards the 137.79 level. On the other hand, a break above the 150.00 key level with a bullish H4 close may resume the current bullish trend.
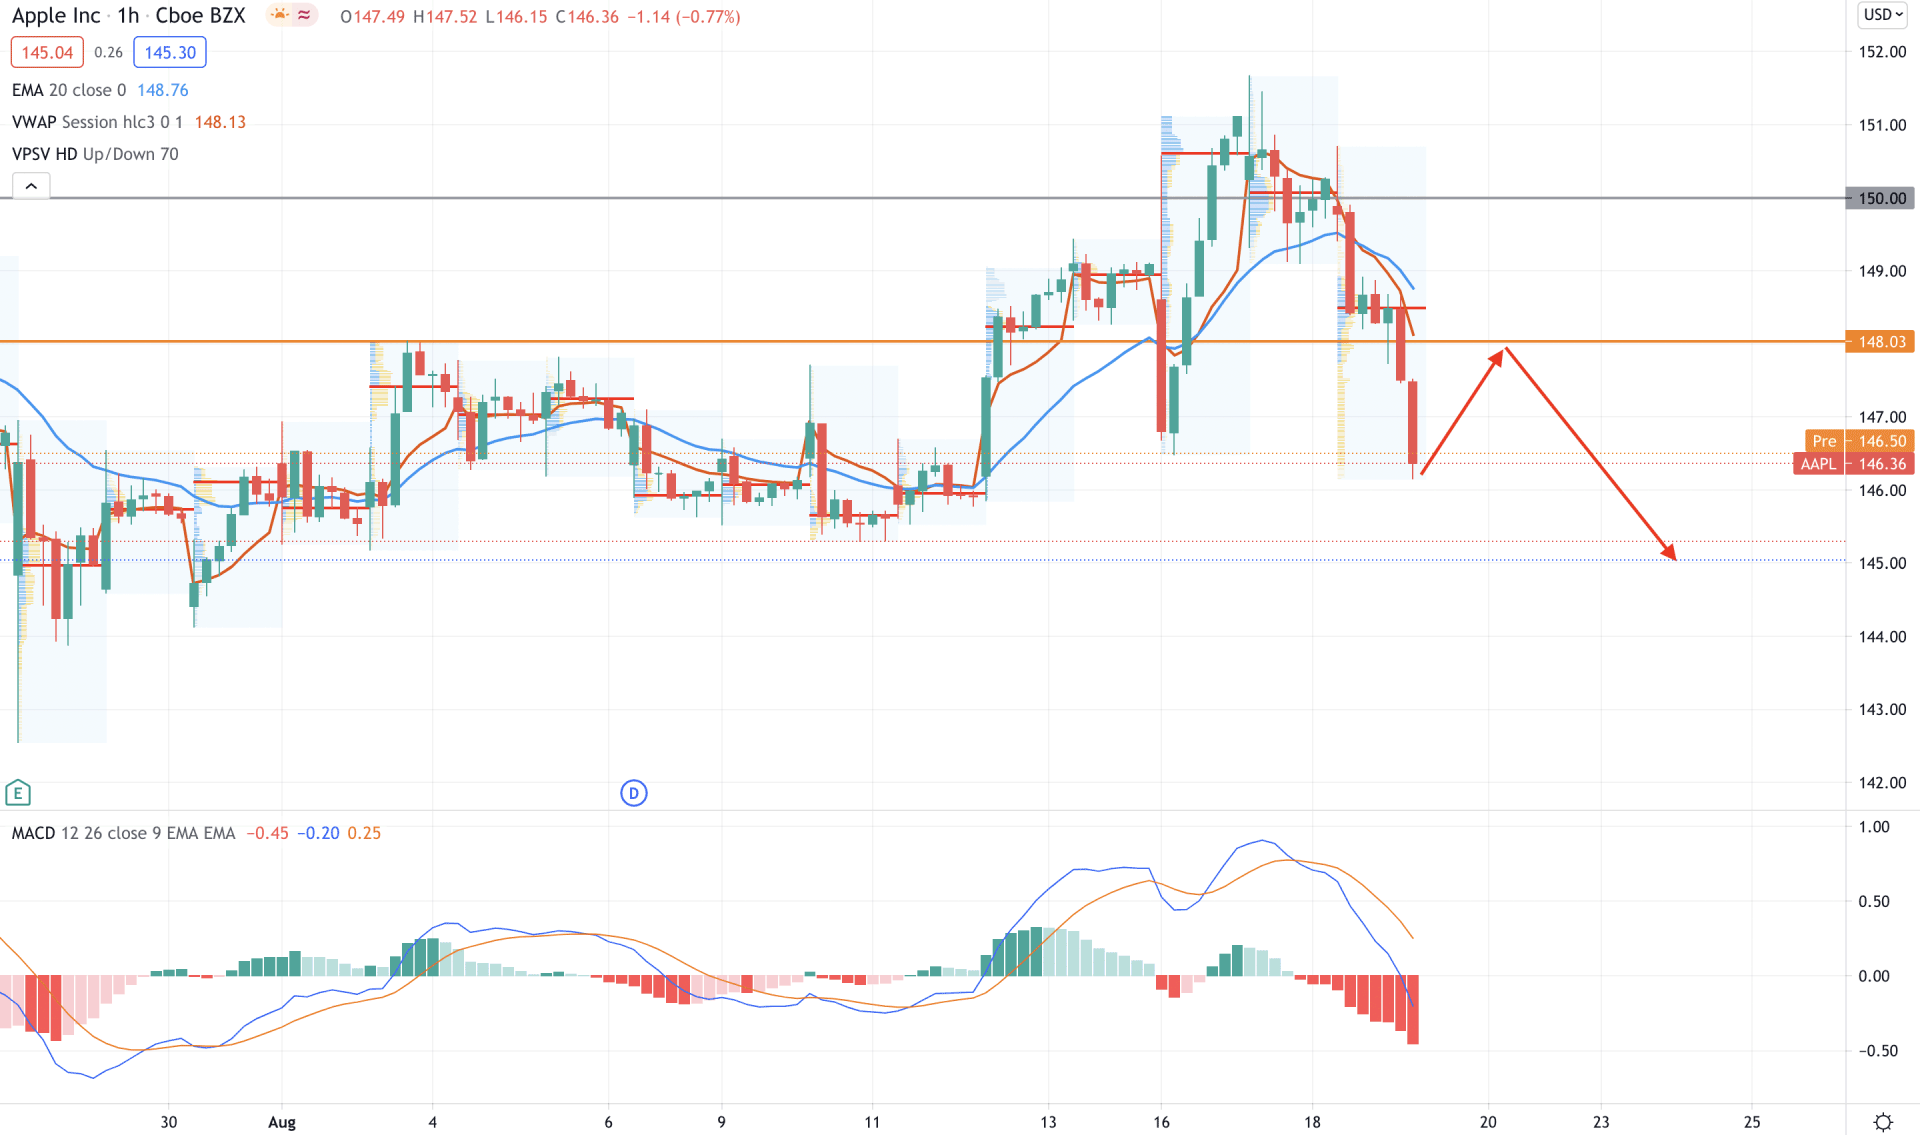
In the intraday chart, Apple stock is moving within volatility where the recent false break above the 150.00 level and the bearish pressure below the 148.48 high volume level increased the bearish possibility. Moreover, the price moved below the dynamic 20 EMA and vwap with a selling pressure may make a new low in the coming sessions.
As per the above image, we can see that the price is trading below the intraday high volume level of 148.48 and static resistance of 148.03. Moreover, the break below these levels has created a gap between the price and dynamic vwap. Therefore, any bounce back from the intraday 148.03 level with a bearish H1 close may make a new swing low below the 145.00 level.
On the other hand, the major trend is still bullish, and investors should closely monitor how the price reacts on the 148.03 level. Any bullish H1 close above the dynamic vwap may increase the possibility of breaking the 150.00 resistance level.
As of the above observation, Apple stock is in a critical zone between 148.00 level to 150.00 level. Considering the most recent bearish daily close, the price is more likely to move down towards the 137.00 level.
On the other hand, the broader trend is still bullish, and any successful attempt to break above the 150.00 key resistance level may take the price higher toward the 160.00 psychological level.


