Published: February 28th, 2023
As per analysts expectation, Apple Inc stock (AAPL) is expected to have an exciting year in 2023, despite potential economic challenges.
Morgan Stanley has identified four potential company catalysts that can work as a strong buying factor. A rebound in services, strong demand for the next iPhone, the launch of a mixed-reality headset, and a Hardware-as-a-Service model are key areas to look at for investors.
One key demand driver for this instrument could be pent-up demand for the next iPhone. Although supply chain issues have impacted Apple in recent quarters, these could ultimately drive increased demand as consumers seek to upgrade their devices.
Another potential growth area for Apple is a hardware subscription service. This offering could help smooth out iPhone sales over time, making it easier for consumers to justify purchasing higher-tier devices with monthly payments.
Finally, Apple's much-anticipated mixed-reality headset could be unveiled at its next WWDC meeting in the summer, which can work as a strong bullish factor for this instrument.
Should you buy Apple stock now? Let’s see the upcoming price projection from the Apple Stock (AAPL) technical analysis:
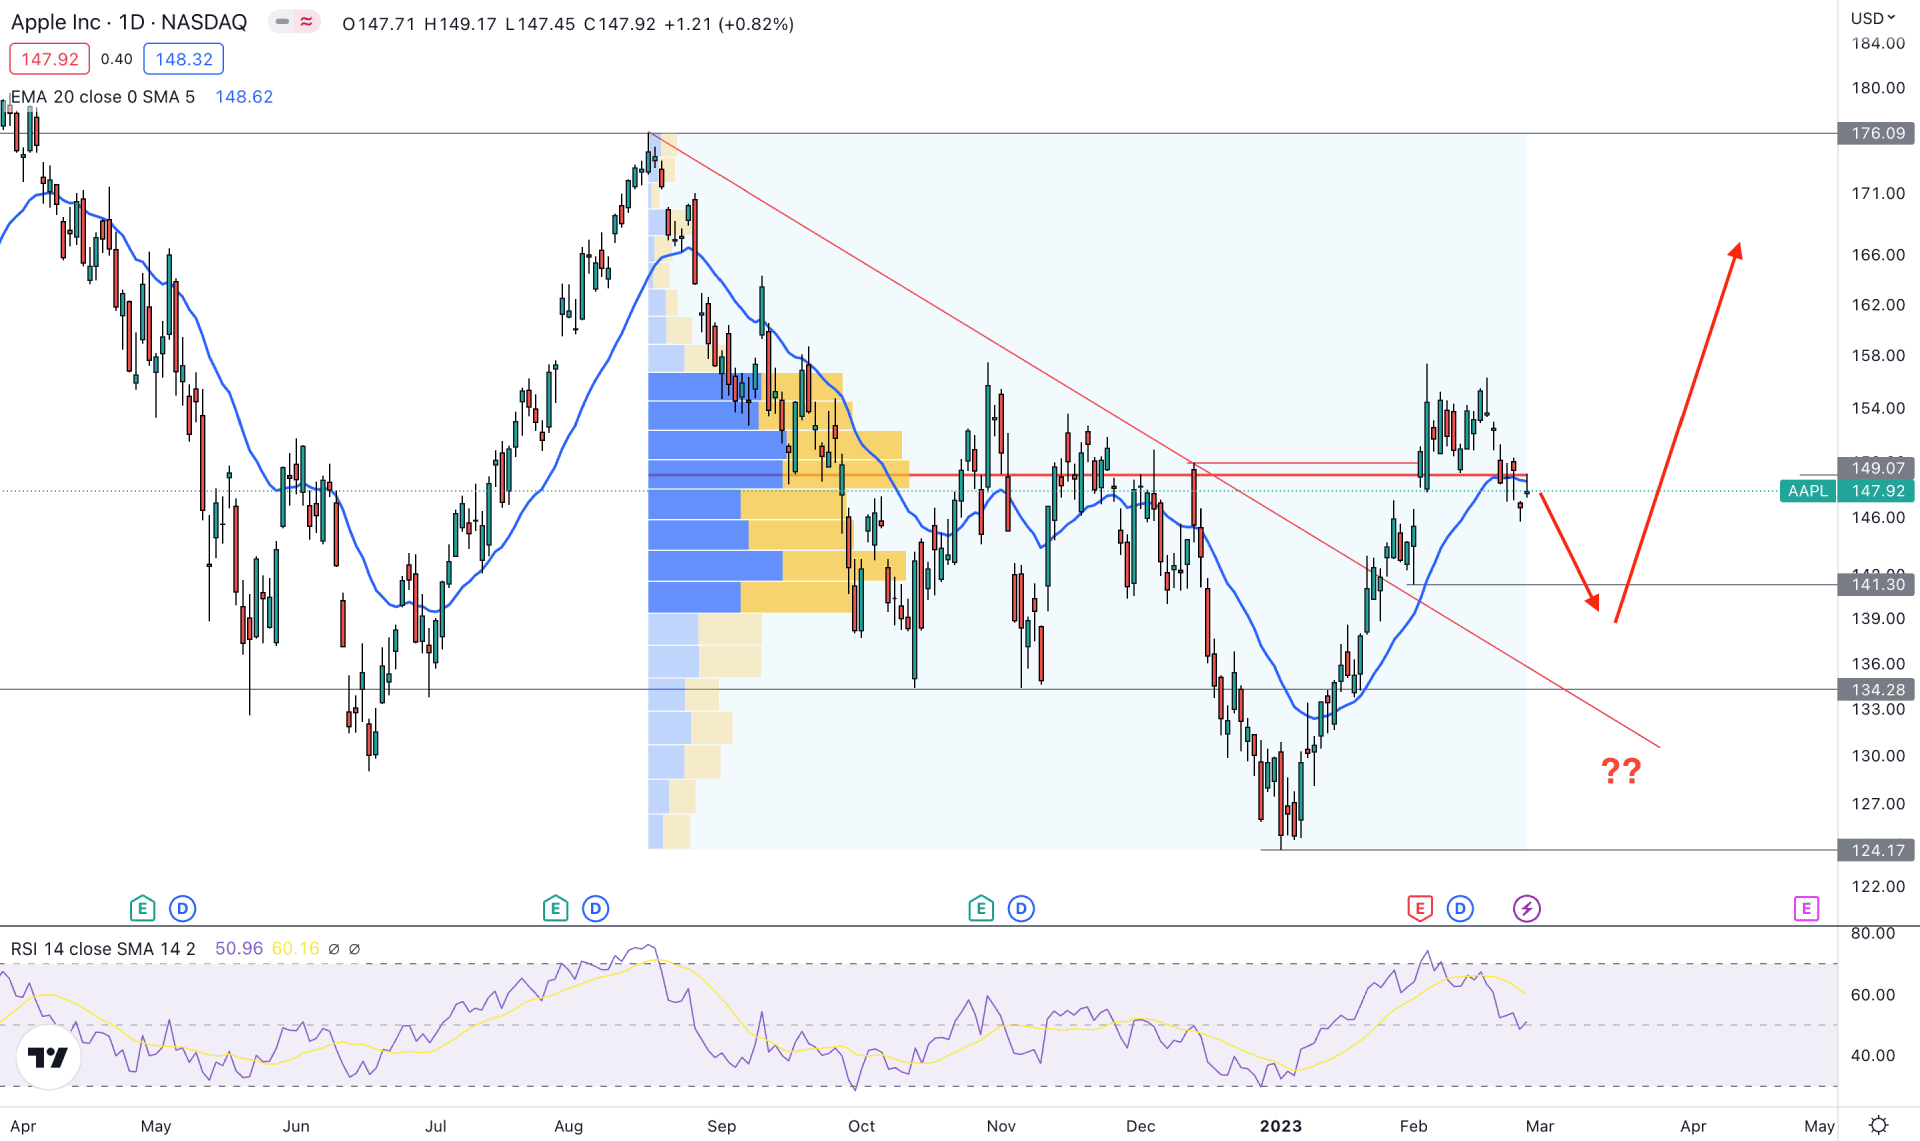
Apple Stock (AAPL) sees a 19% gain from the current price due to strong buying pressure and trendline breakout.
However, it is not the right time to open a long position in this instrument, as no sufficient correction has been seen after the recent breakout. The price is still above the 50% Fibonacci Retracement level from the 2023 swing, which is a sign of a premium price. Based on this, investors should closely monitor the current price area to find the best place to buy.
The highest trading volume level from August 2022 to February 2023 is just above the price, which indicates indecisive momentum. It indicates that more data is needed to confirm institutional traders’ interest in this stock.
Apart from the trendline breakout, the buying pressure from the 124.17 level made a bullish break of structure after moving beyond the 150.02 level. As a result the 124.17 level is set as a valid bottom, while the top is still intact at 176.09 level. The price is still at the discounted zone of this zone, and any downside corrective pressure would increase the buying possibility.
In the primary chart, the price came below the dynamic 20 day EMA, while the Relative Strength Index (RSI) went to the neutral 50.00 level.
Based on the daily price outlook, more downside correction is pending in this instrument. Primarily, any buying pressure from the 141.30 to 134.28 area would be a buying zone. But breaking below the 131.00 level with a bearish daily candle could lower the price towards the 120.00 area.
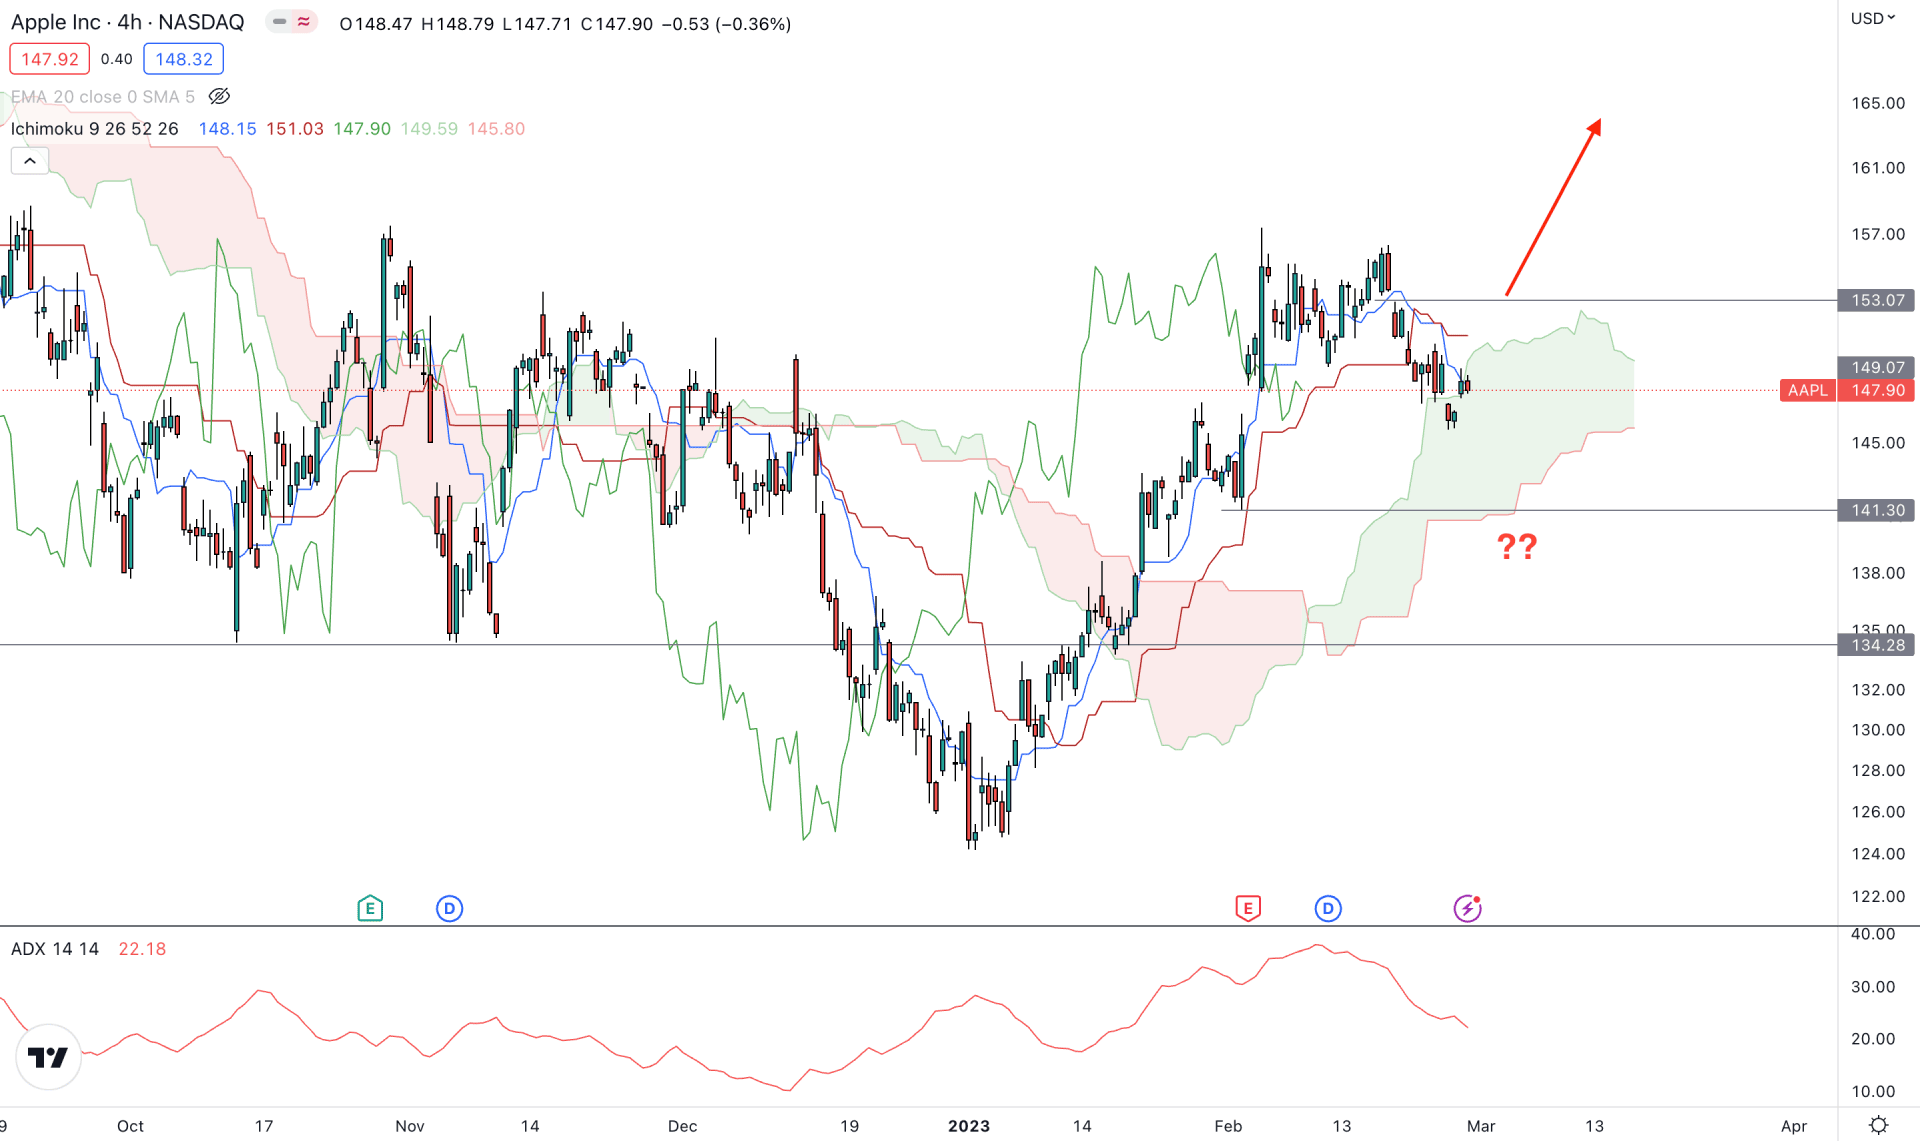
In the HH4 timeframe, the current price outlook is strongly bullish as the current price is above the Ichimoku Kumo Cloud. However, a downside correction is seen after making a top at 157.33 level as the price moved below the dynamic Kijun Sen. A bearish crossover is seen between the Tenkan Sen and Kijun Sen, while the current price is trading within the cloud area.
In the future cloud the structure is bullish as the Senkou Span A is above B, while the strength of the trend is stable. The Indicator window shows the ADX level above the 20.00 area, which is signaling a stable trend.
Based on the H4 outlook, an immediate rebound with a H4 candle close above the 153.07 level would validate the buying possibility towards the target of 165.00 level.
On the other hand, breaking below the 141.30 level would lower the price towards the 130.00 area before forming another buying signal.
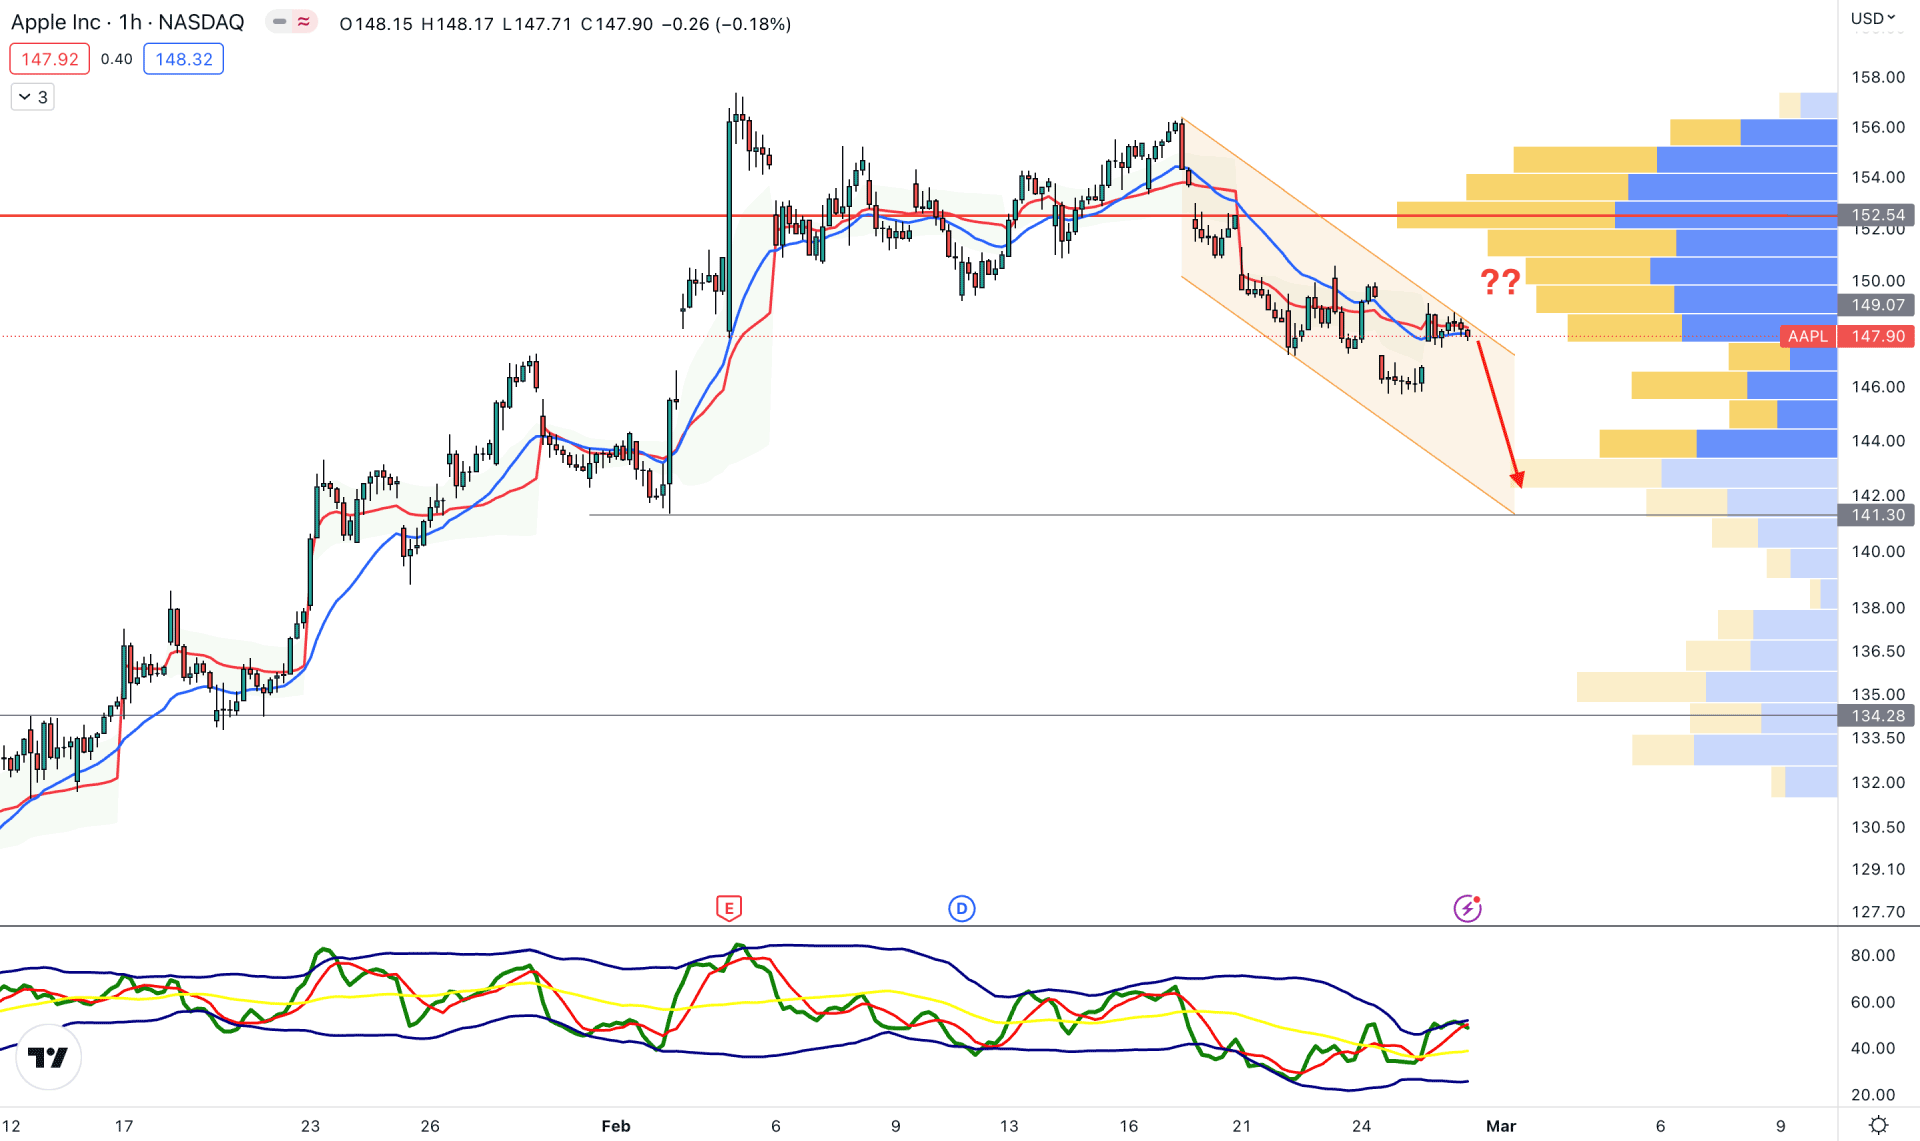
In the hourly chart, the current outlook is bearish as the new visible range high volume level formed above the current price at the 152.54 level.
A stable price is below the dynamic 20 EMA and weekly VWAP, while the current price squeezes at the 20 EMA area.
The indicator window also shows a sell signal as the current TDI is at the upper bands are from where a downside pressure may come.
Based on this outlook, a range extension could lower the price towards the 141.30 level in the coming hours. However, the broader outlook is still bullish, and an immediate H1 candle above the 152.54 level could resume the trend towards the target of 165.00 level.
Based on the current price outlook, the current outlook of the Apple stock is bullish but a trend trading opportunity needs some patience. A solid downside correction and buying pressure from the intraday support levels could provide a decent buying opportunity.


