
Published: April 30th, 2025
Apple has been able to obtain exemptions from the United States government for some of its items, such as iPhones, which are currently subject to a 20% tariff rather than a significantly greater rate on other goods, even though a large portion of its production comes from China.
Nevertheless, Apple is in a difficult position because the tech behemoth depends largely on foreign manufacturing and has moved some of its manufacturing to India to circumvent increased tariffs in China. Apple is expected to release fiscal second-quarter revenue of $93.56 billion, up 3% from $90.75 billion in the comparable quarter.
Apple's Q2 EPS is anticipated to increase by 4% to $1.60 per share from $1.53 in the previous quarter. Apple has exceeded earnings estimates for eight straight quarters, with a typical EPS increase of 4.39% over the prior four quarters.
Some digital products, such as laptops and smartphones, have temporarily been excluded from tariffs under the Trump administration. Still, consumers have hurried to buy equipment before any possible taxes on the industry are imposed. Intel management stated last week that they thought the company's first-quarter revenue was boosted by customers' purchases made in advance of possible tariffs.
Woodring is one of several analysts who predict that Apple's second-quarter financials would surpass estimates as consumers attempt to beat tariff price increases. As a result, Wall Street is more interested in the company's outlook for the upcoming months than its past.
Let's see the complete outlook of this stock from the AAPL price analysis:
On AAPL's daily chart, the recent trade war has triggered selling pressure from the all-time high. However, the company's strong market dominance and large market capitalization could spark a rebound at any time.
On the higher timeframes, the selling pressure appears to be exhausting, as the current monthly candle has rebounded after testing the 10-month low. Although the monthly opening price remains intact, a rebound above the 221.83 flip zone could shift market momentum to the upside.
On the other hand, many orders are clustered above the near-term resistance level, which could act as a barrier for buyers. According to the high-volume indicator, the most active level since May 2024 is at 226.42, above the current price. Another key level from December 26, 2024, is at 235.72, which also lies above the current price.
As long as these high-volume levels remain above the current market price, investors may require additional confirmation before initiating long positions.
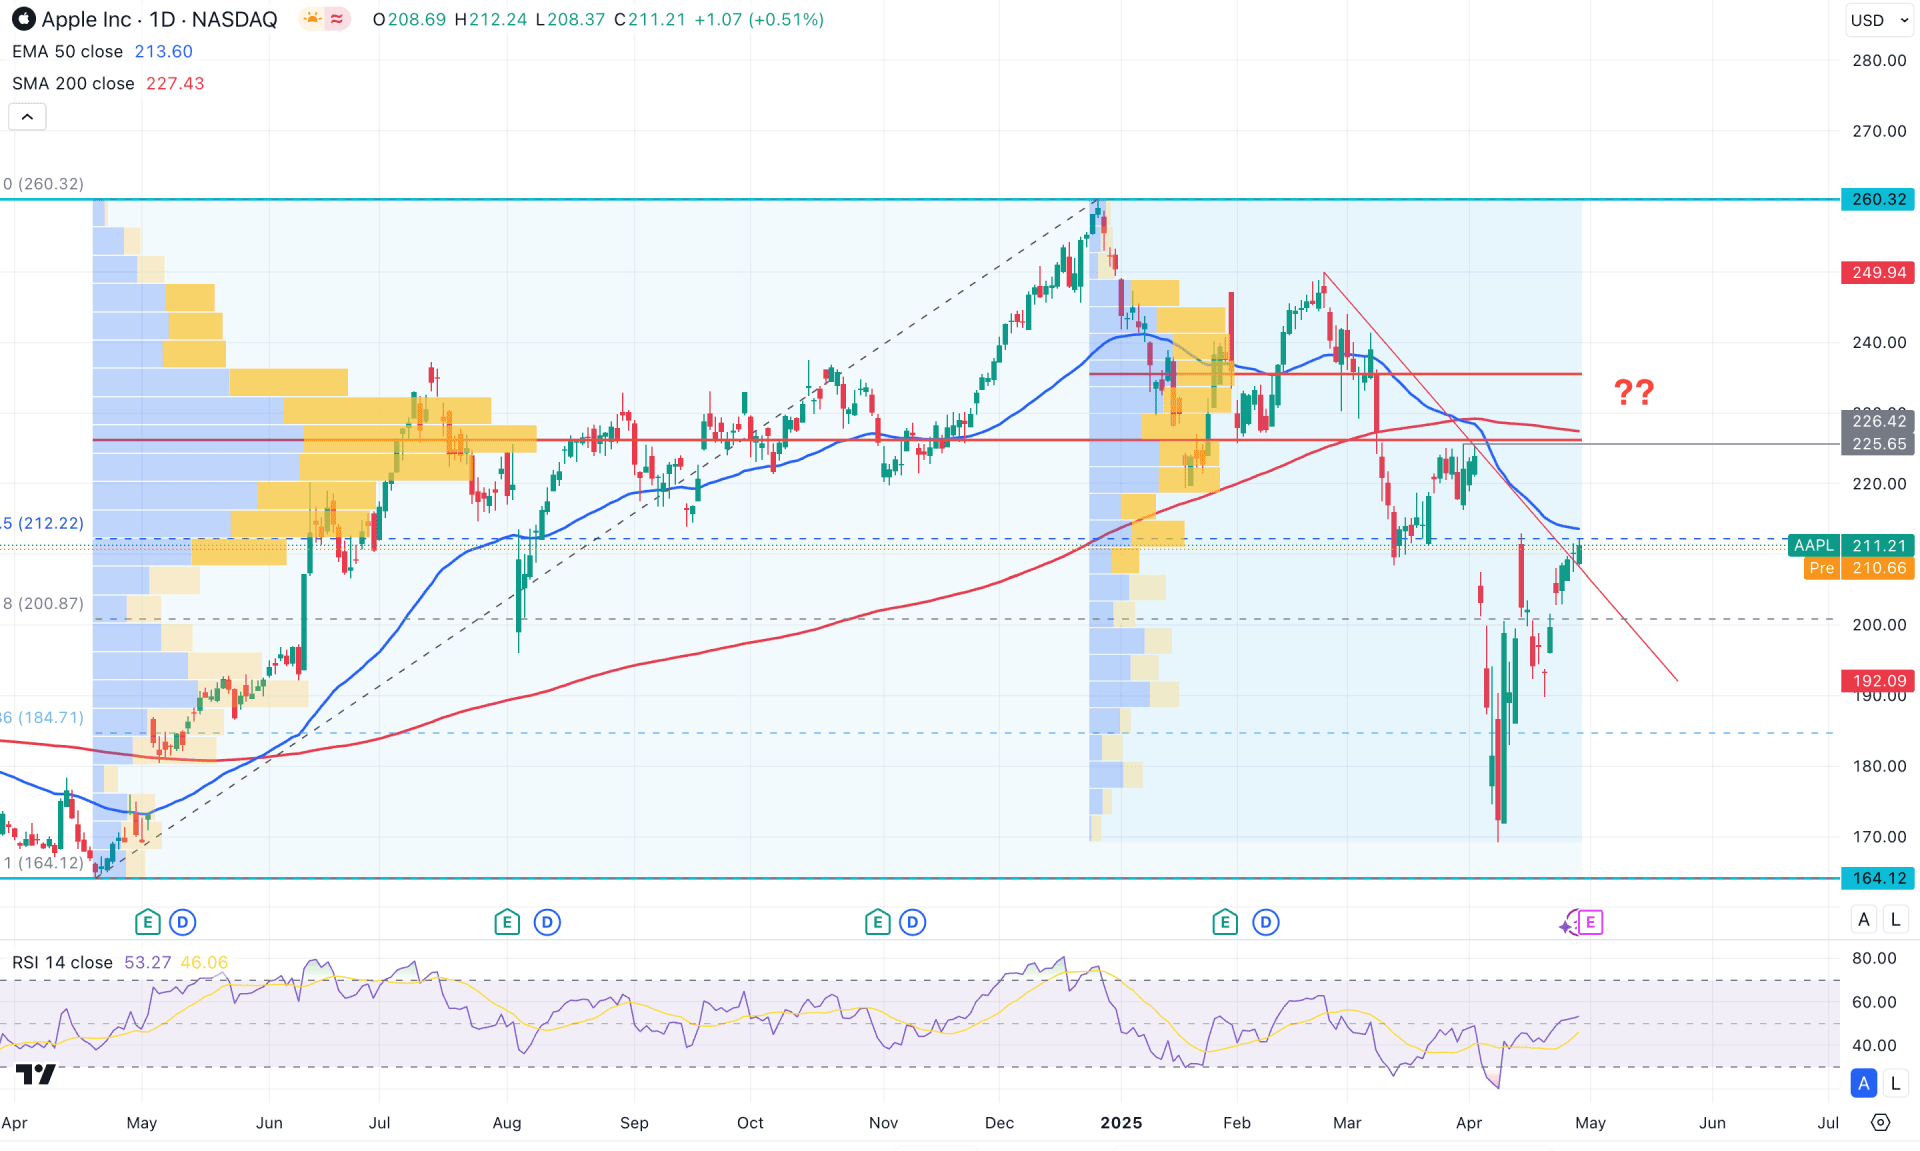
On the main chart, the price is currently testing the falling trendline resistance and trading below the dynamic 50-day EMA. Additionally, a bearish crossover is visible between the 200-day SMA and the 50-day EMA, where both are positioned above the current price.
Meanwhile, the secondary indicator window shows a valid bottom formation, as the Relative Strength Index (RSI) has bounced after hitting the oversold 30.00 level.
From a daily market outlook perspective, Apple stock needs a strong upward push to validate a long opportunity, especially since multiple resistance levels lie above the current price.
Recently, the price has rebounded from the optimum trading zone, marked by the 76.8% Fibonacci retracement level drawn from the April 2024 low to the December 2024 high. In this case, a rebound with a daily candle closing above the 200-day SMA would increase the likelihood of further upside, targeting the 260.32 resistance level.
However, failure to overcome the high-volume level along with a bearish rebound below the 50-day EMA could resume the prevailing selling pressure and lead the price toward the 164.12 support area in the coming days.
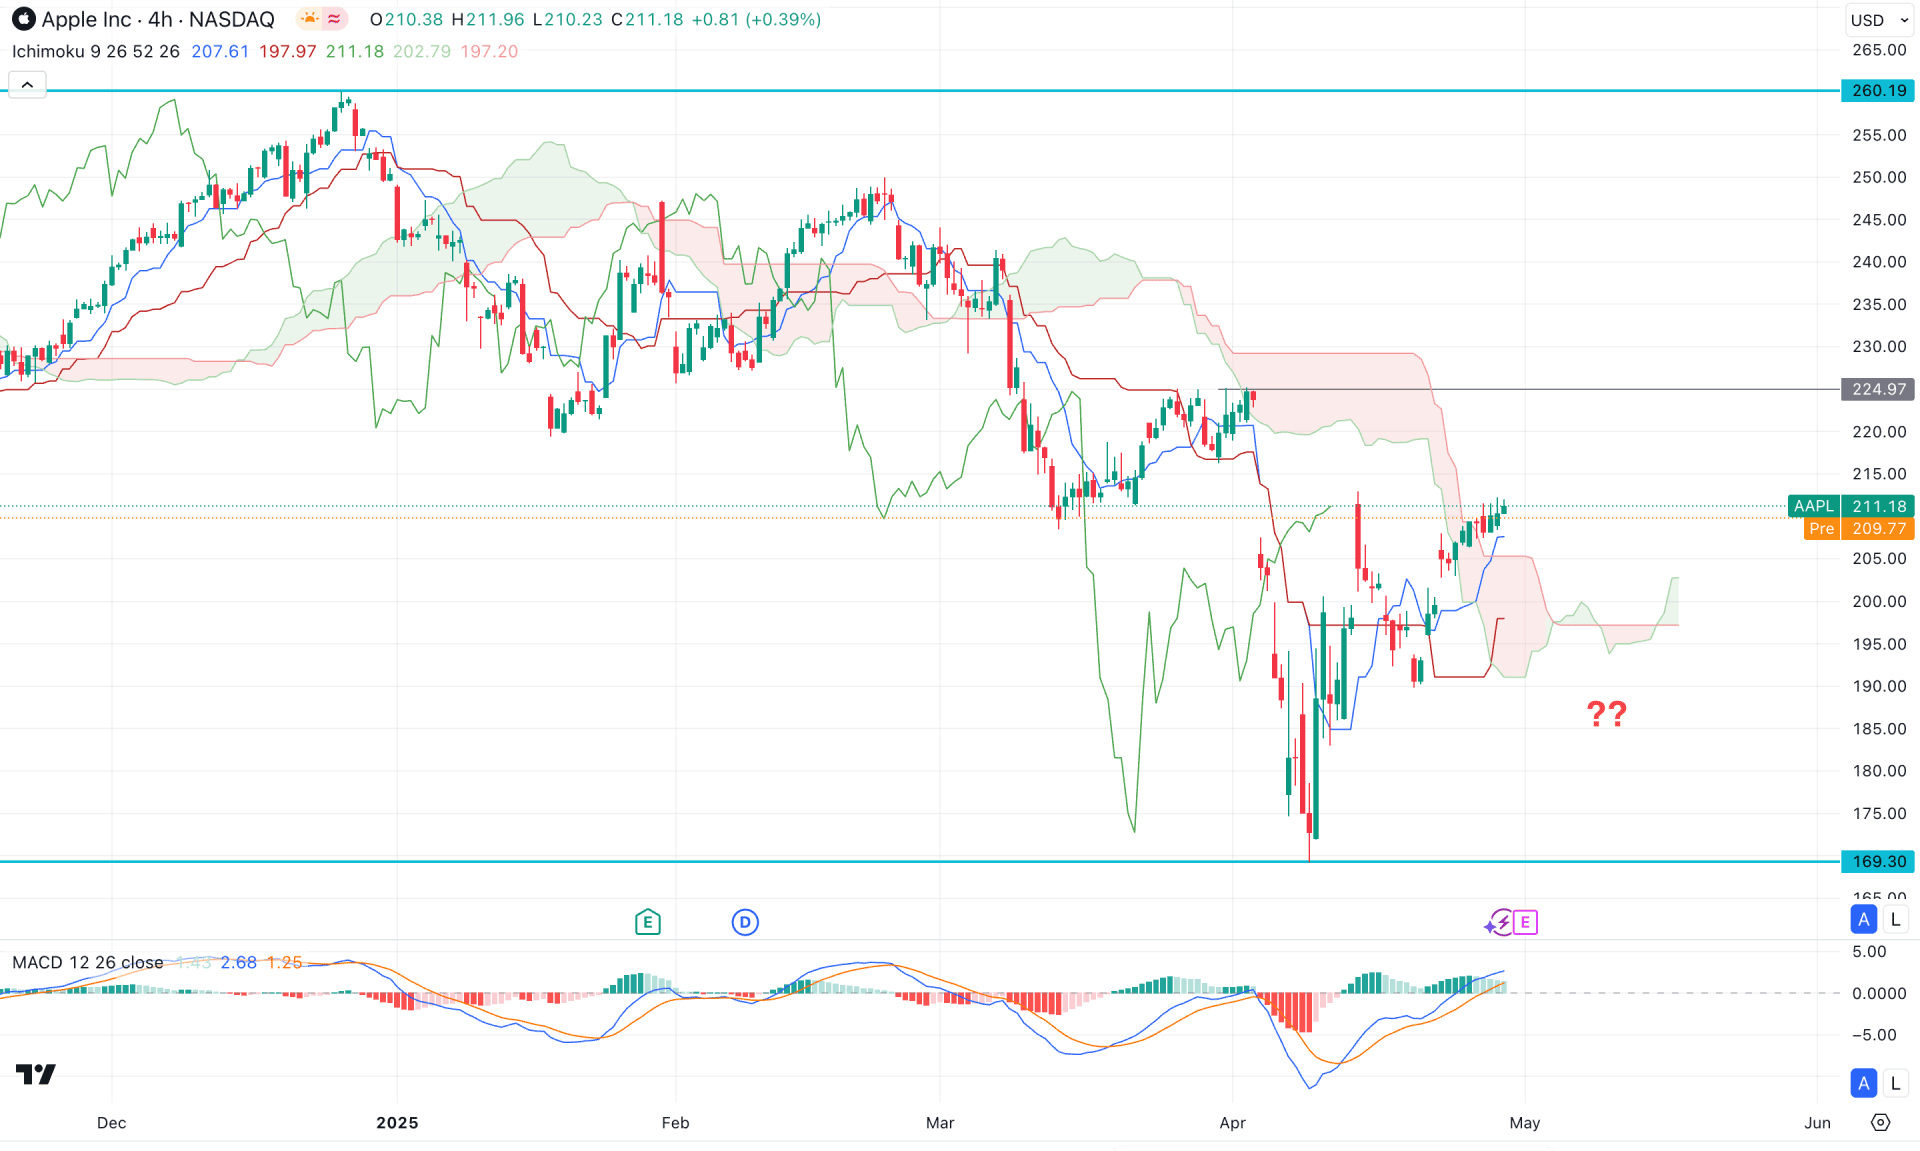
On the four-hour timeframe, ongoing bearish pressure is present; however, a solid bottom has formed at the 169.30 level. In this case, investors should monitor how the price reacts at the resistance level before anticipating future movement.
Based on the cloud structure, a minor bullish breakout is visible, with both dynamic lines currently below the price. Primarily, further upward movement could occur as long as these dynamic lines remain below the current price. Additionally, most of the future cloud has shifted higher as the Senkou Span A is above the Senkou Span B.
In the secondary indicator window, the MACD histogram has maintained buying pressure by staying positive for over two weeks.
Based on this outlook, the recent bullish pressure above the cloud support is insufficient to confirm a trend reversal. Investors might find a better opportunity after a rebound from below the dynamic support. A bearish candle below the 195.00 level could open the door for a retest of the 169.30 support level.
On the other hand, an extended recovery with a four-hour candle above the 204.97 level could be the first sign of a bullish reversal. In that case, more buying pressure might follow after a sufficient recovery.
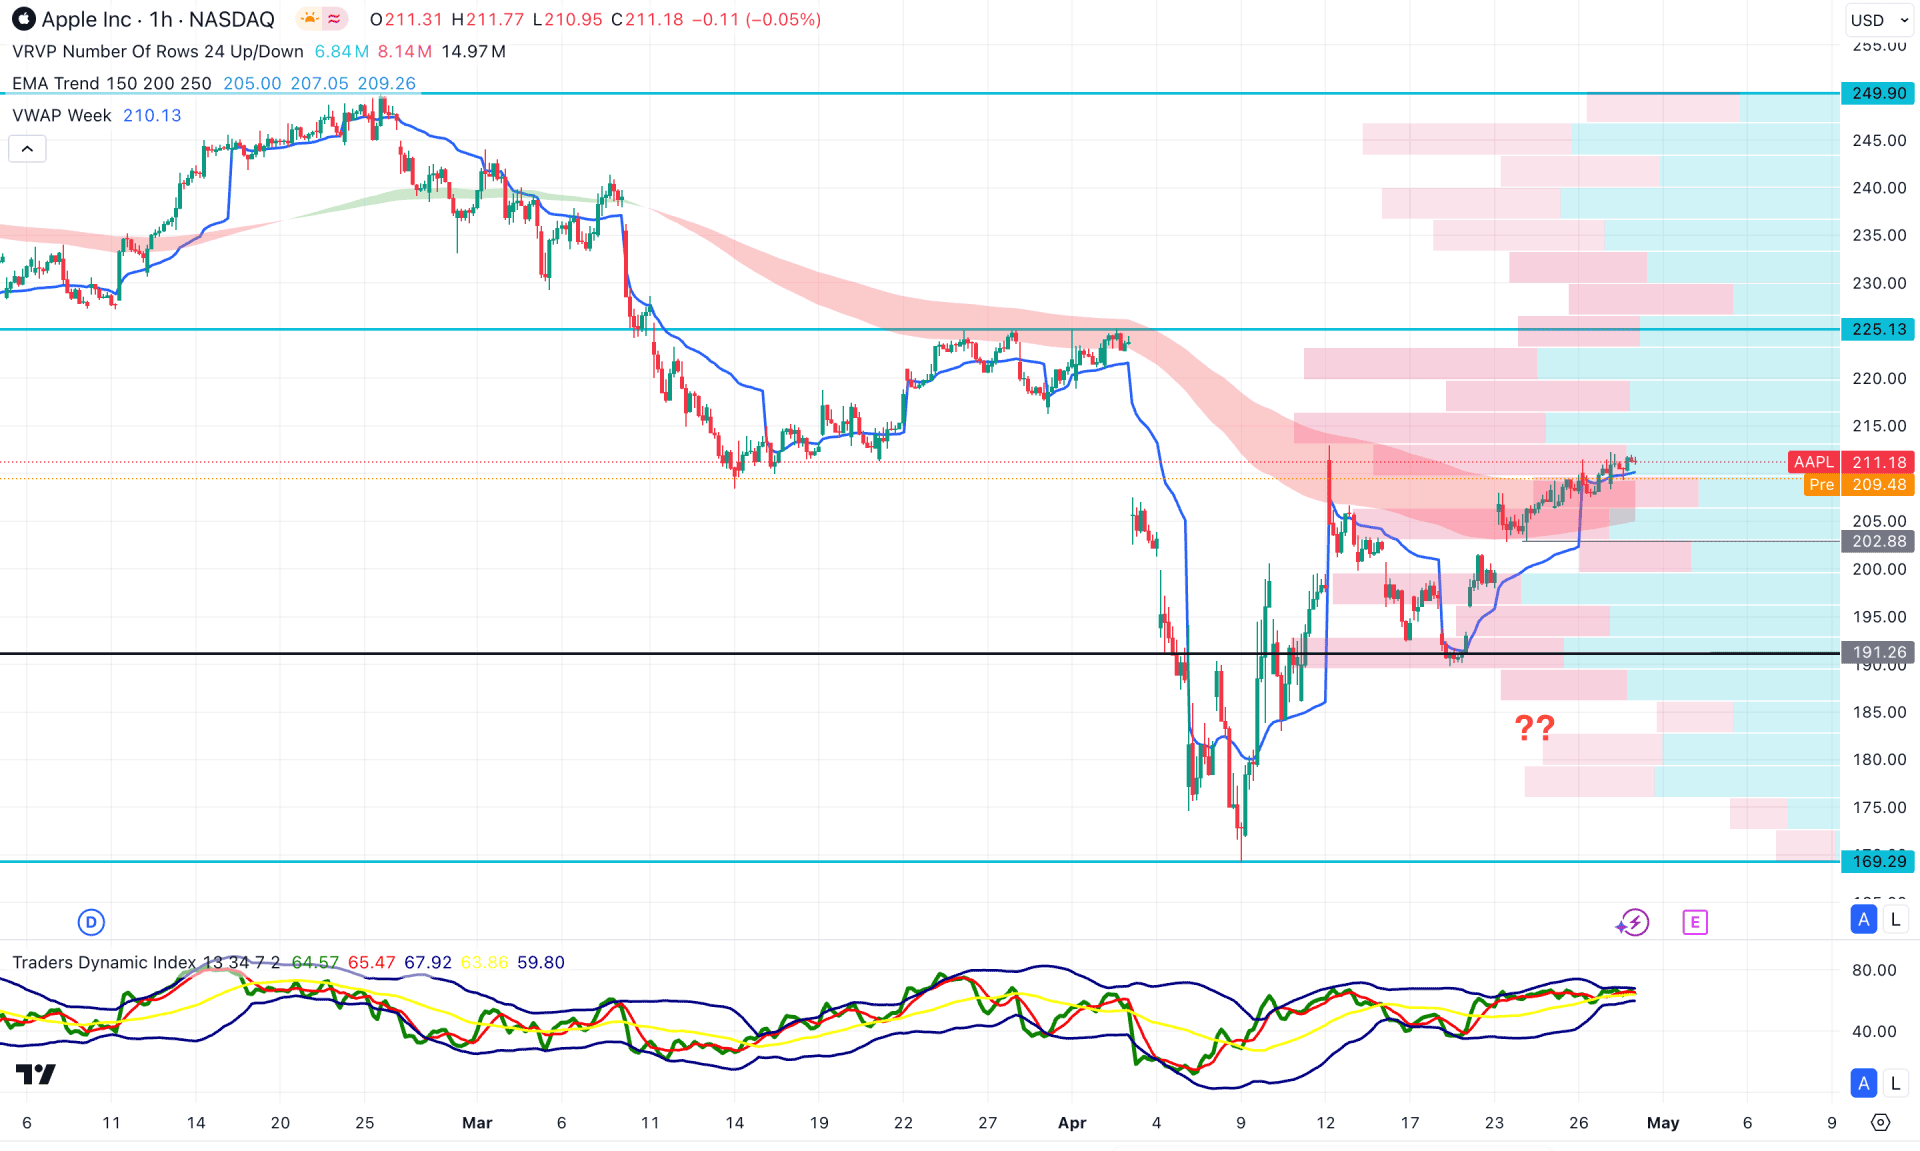
The recent price action shows a decent bullish recovery on the hourly timeframe. The intraday high-volume level is currently below the price. After the breakout, the price pulled back and tested the high-volume line before forming a new swing high. As a result, the weekly VWAP has shifted its position and is now acting as immediate support.
On the other hand, the long-term moving average wave aligns with the current price, indicating a minor bullish breakout. The Traders Dynamic Index is squeezing in the indicator window, which signals lower trading activity.
Based on this outlook, as long as the breakout above the cloud area lacks strength, we may expect a short-term pullback before a bullish reversal forms. However, a strong bullish move with an hourly candle above the 225.13 resistance level could offer an immediate long opportunity. Alternatively, downside pressure with a recovery from the 200.00 to 190.00 area is possible. An extended bearish pressure below the 185.00 level would invalidate the bullish outlook.
Based on the current market outlook, Apple stock is experiencing decent selling pressure, and more confirmation is needed before anticipating a bullish trend reversal. Since the price is still near the resistance area, some minor downside correction is likely.
However, the upcoming earnings report could act as a bullish catalyst, potentially supporting a daily trend continuation after a trendline breakout.


