Published: January 11th, 2023
On January 4, Timex released 500 watches with non-fungible tokens (NFTs) from the Bored Ape Yacht Club and Mutant Ape Yacht Club.
So, along with the real watch, a digital copy in the form of an NFT will include the user's virtual avatar. It is important to note that the community was unhappy with the mint price of 1.5 Ethereum (ETH).
ApeCoin (APE) is the currency used in the world of the Bored Ape Yacht Club. BayC is a collection of 10,000 pieces of digital art put together by NFT. It goes head-to-head with blue-chip collectibles in the ecosystem.
Based on the data provided by NFTGo, CryptoPunks, a collection of 10,000-pixel NFTs made by an algorithm, was the most valuable at the start of 2022. At that time, pixelated collectibles comprised 10% of all NFTs' market capitalization. This changed when Bored Ape Yacht Club took the lead in the year's second half.
At the end of 2022, BAYC's market cap was $830 million. The 10,000 Apes collection now holds the most money in the ecosystem. Even though its value kept decreasing in 2022, BAYC became the most popular NFT, passing CryptoPunks. BayC had 8.12% of the NFT ecosystem, while CryptoPunks had 8.08%.
ApeCoin token (APE) is already trading 17% higher from the last 24 hours and it has the potential to show further upside pressure in the coming days.
Let’s see the future price directions from APE/USDT technical analysis.
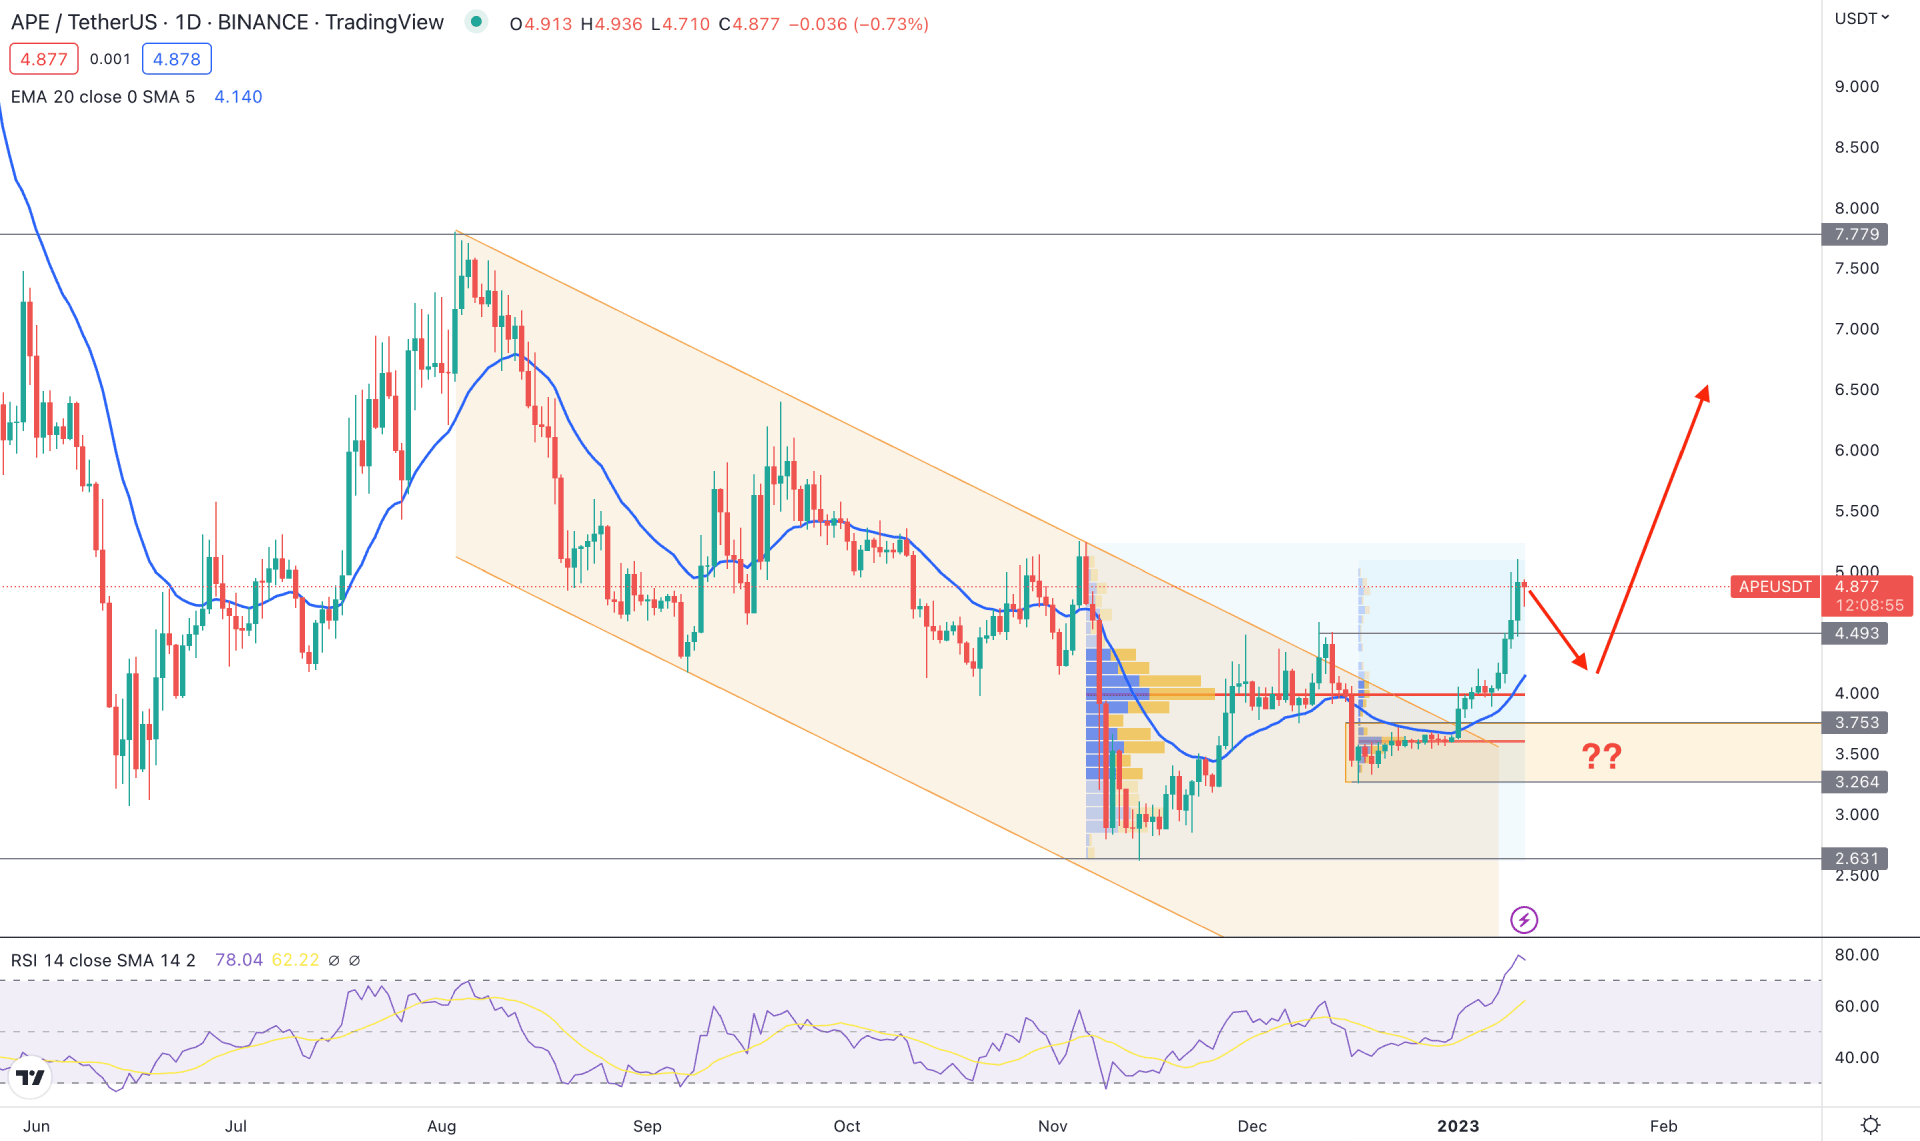
The buying possibility in the APE/USDT daily price is potent from the first look but investors should be aware of the range.
First, we need to identify the tradable area by looking at the near-term significant swing level. At the top, a strong downside pressure came from the 7.77 swing high, which is the ultimate target of any bullish opportunity. Similarly, a massive bullish recovery is visible from the 3.26 low, which is the ultimate target for any sell setup. As the current price is trading below the 50% level of this zone, any buying possibility could offer a higher return than the risk taken.
After finding the range, we need to validate the buying possibility by looking at institutional traders' interest in this market. Based on the high volume indicator, the highest activity level from August 2022 to January 2022 is at 3.979, which is below the current price. Moreover, another high volume level from the December low to the January high is spotted at the 3.608 level. As the current price is trading above these high volume levels, we can say institutional investors have already joined the market with a larger volume.
In the near-term levels, the dynamic 20 EMA is below the price with a gap, while the RSI is overbought above the 70% level. Therefore, even if the current buying pressure is strong, a minor bearish correction is pending.
Based on the current daily outlook, it is better to look for bullish opportunities once the bearish correction is over. In that case, any long opportunity from the 4.00 to 3.20 area could provide a decent long opportunity, targeting the 7.779 resistance level.
On the other hand, any bearish break below the 3.20 with a strong daily candle could eliminate the current bullish possibility and drag the price down towards the 2.631 support level.
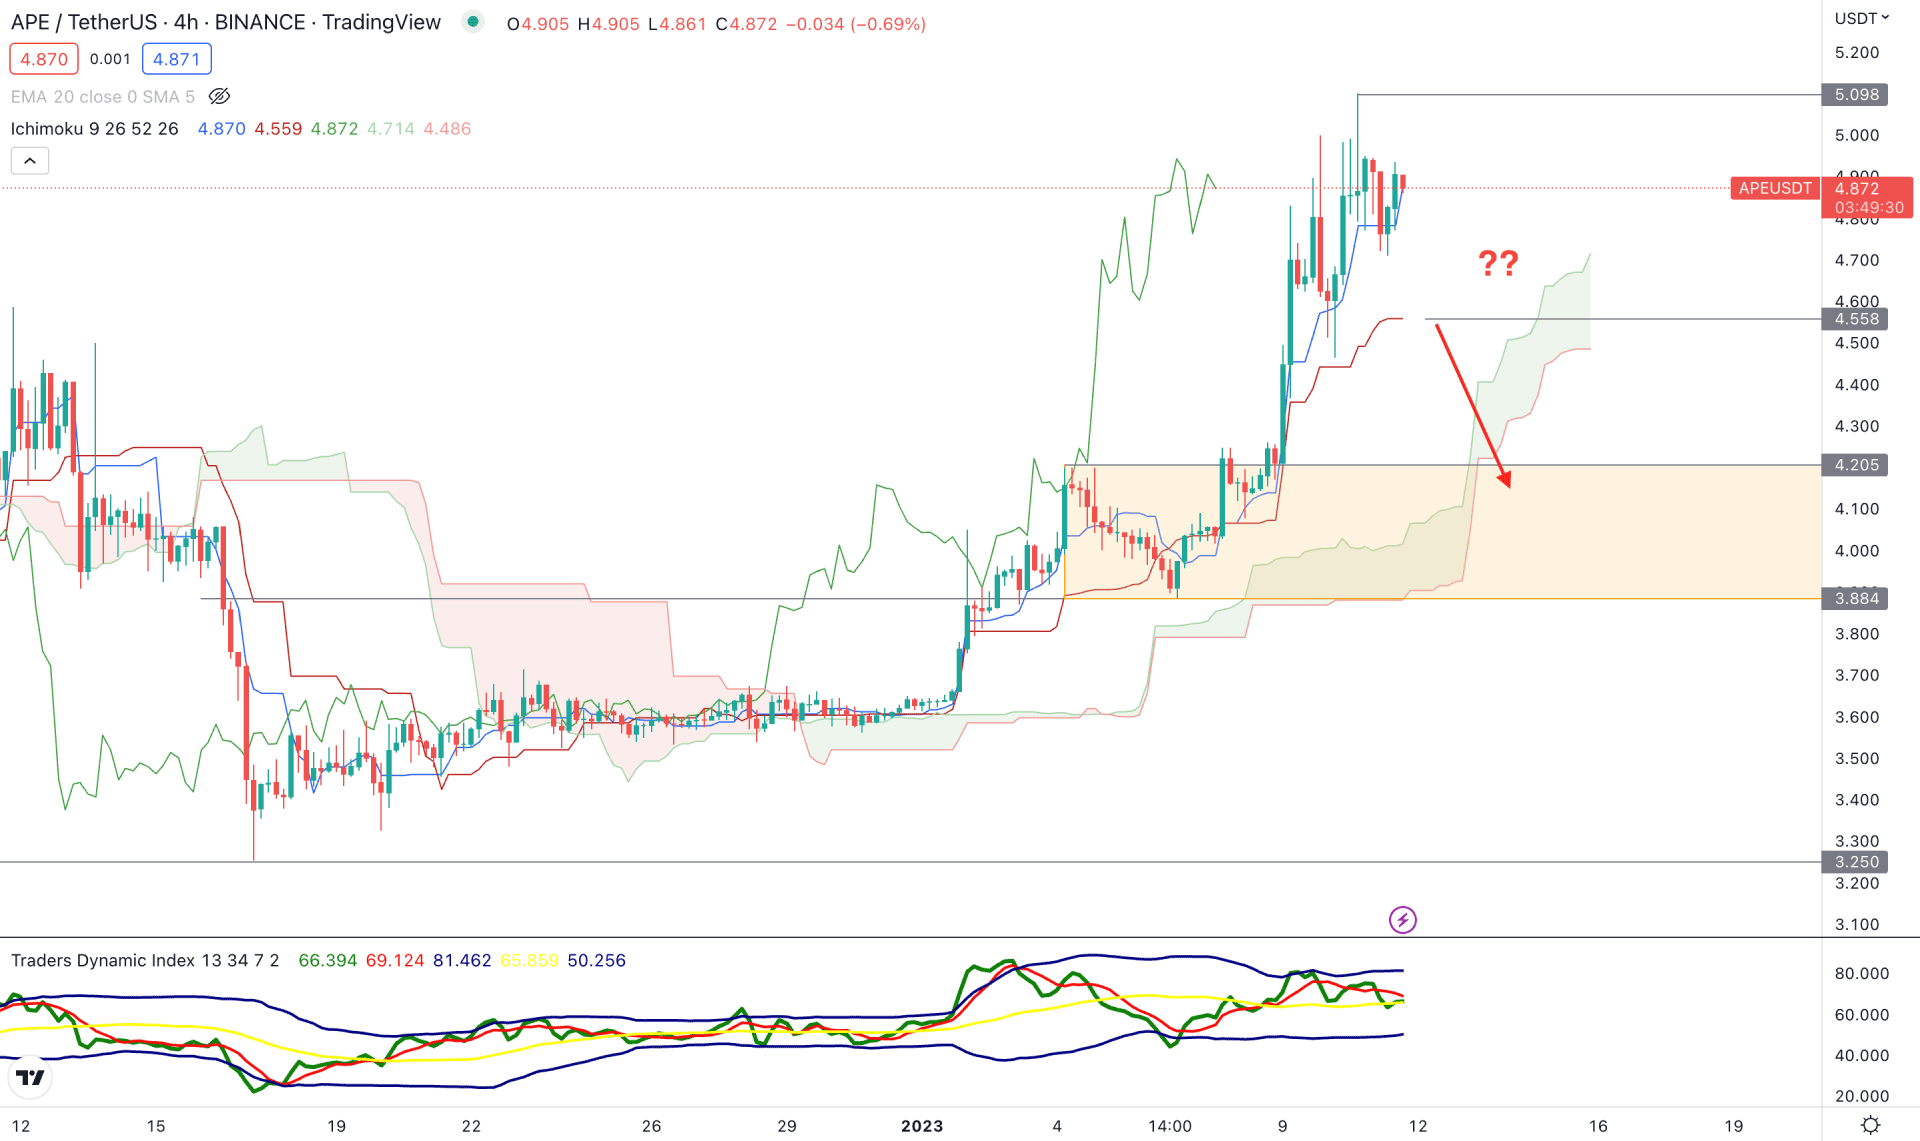
In the H4 timeframe, the buying possibility is still visible as the current price is holding strong ground above the Ichimoku Kumo Cloud. Therefore, investors should look for long opportunities as long as the price trades above the cloud support area.
Based on this current bullish outlook, a massive upside pressure is already visible from the 3.894 low to the 5.098 high and any buying attempt from the current zone would be from the premium area.
In that case, the primary aim to join the bullish rally is to wait for the price to come below the 4.558 low and form a bullish Quasimodo. The high probable buying opportunity would be from the 4.206 to 3.884 zone with a proper candlestick formation. Below the 3.884 level with an H4 candle close would eliminate the bullish pressure and lower the price towards the 3.250 area.
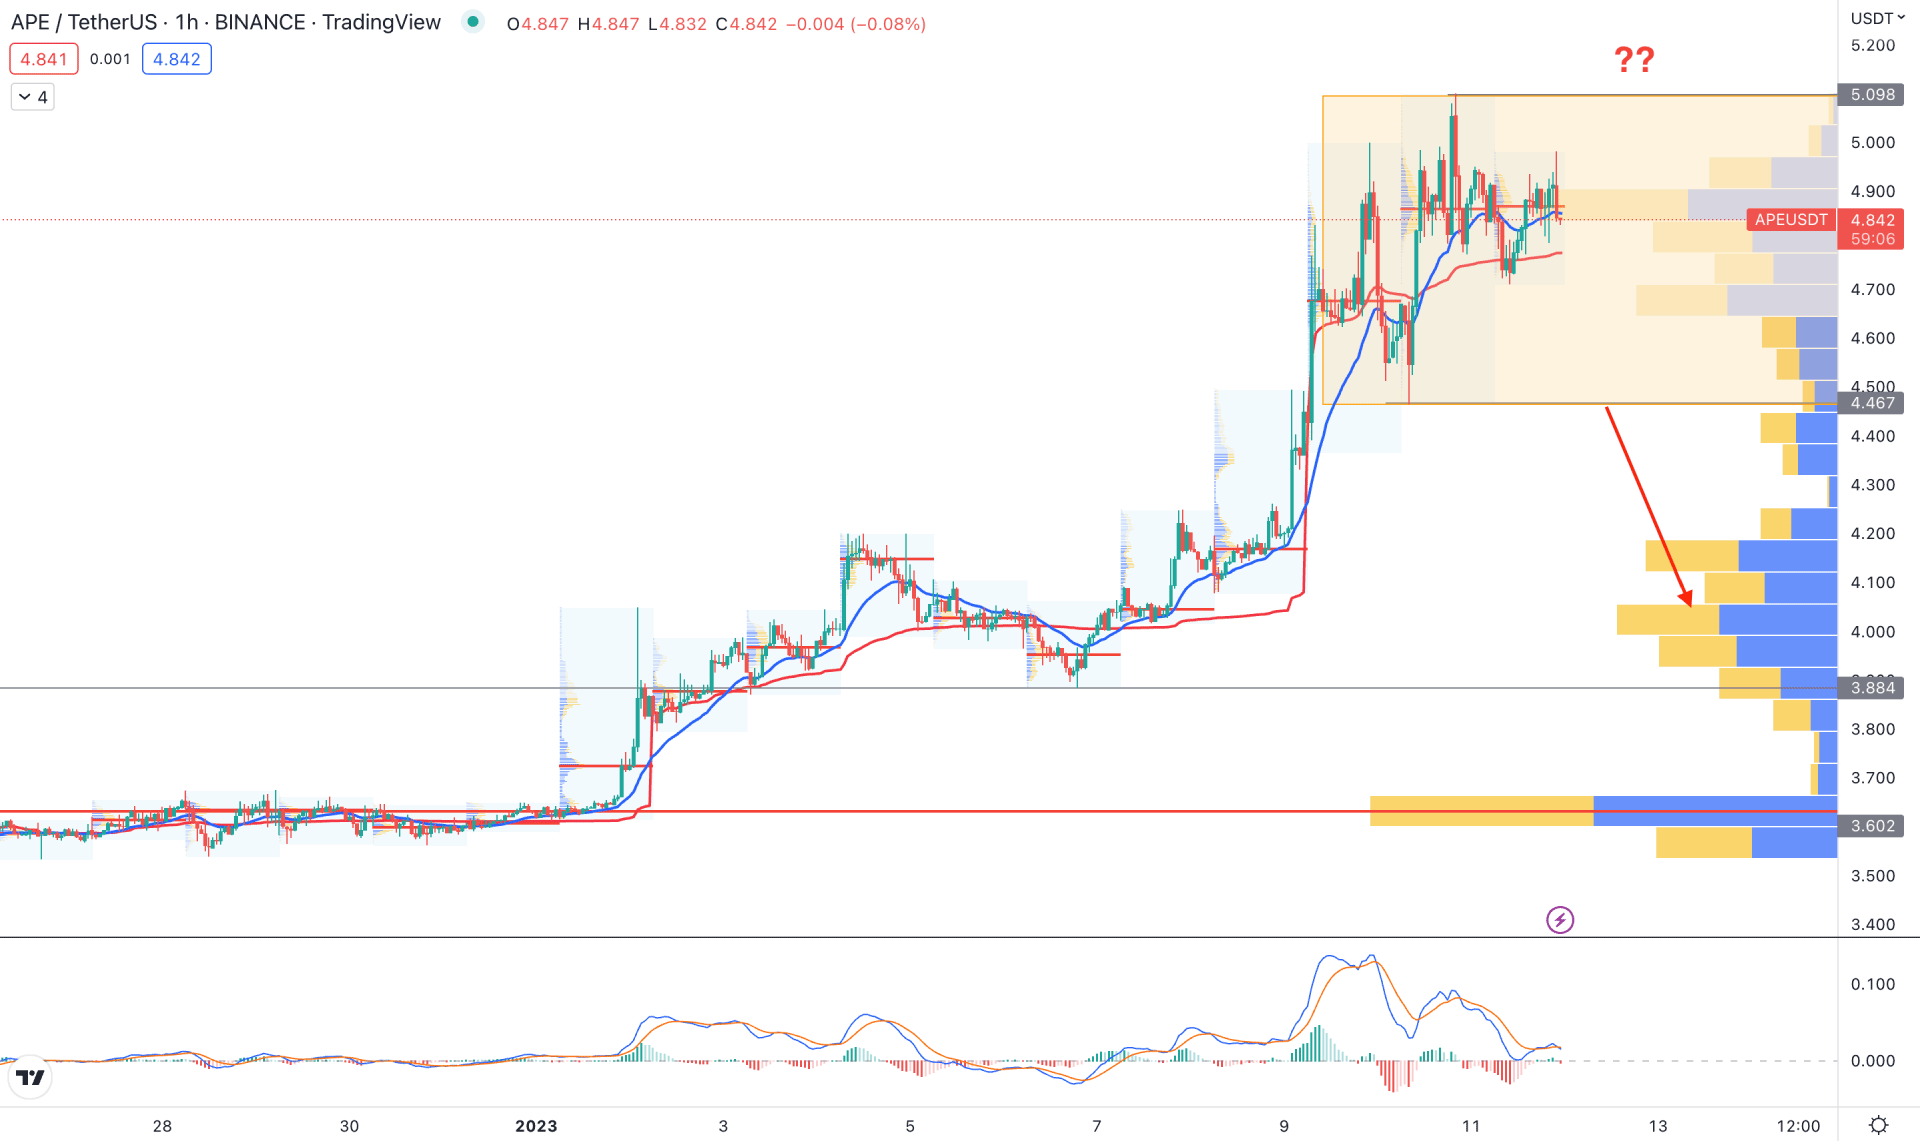
As per the hourly price behavior, the price action becomes very volatile after reaching a 41% high from the 3.602 level. Moreover, there is an indecision formation in recent hours which could cause a bearish correction.
In this context, investors should wait for additional confirmations before joining the bullish really. The dynamic 20 Exponential Moving Average is below the price while the gap between the price and the 3.602 high volume level is extended. It is a sign that a minor bearish correction is pending and investors may expect a breakout from the 5.098 to 4.467 zone.
The MACD exponential moving average also showed a bearish crossover from the upper band which is a sign of a possible where is momentum.
Based on the hourly price behavior, a bearish correction is possible from the 4.002 3.602 area, which could offer a high probable bullish opportunity. On the other hand, a break below the 3.500 level could eliminate the current buying possibility and lower the price in the coming hour.
Based on the current price behavior APE/USDT is more likely to increase in the coming days but investors should wait for a proper bearish correction and bullish rejection in the intraday price.
As the current price is already 40% higher than the hourly high volume level any sign of excessive volatility could eliminate the buying possibility at any time.


