

Published: August 18th, 2026
Analog Devices projects $3.9 billion in revenue for the third quarter of its fiscal year, which it is expected to disclose this week. Analysts' consensus sales estimate is $3.92 billion, up 36.3% from the same quarter last year.
All four of ADI's end markets are expanding, with communications and industry emerging as the main growth drivers. High demand from data centers and communications infrastructure applications drove the fastest-growing segment, communications, with sales of $554.7 million, or 15% of total revenues, and 79% year-over-year growth.
Automotive demand rebounded more gradually, with $871.6 million in automotive revenue, which accounted for 24% of overall revenue and increased 2% year over year.
Meanwhile, rising demand across consumer technology applications helped Consumer produce $397.8 million, or 11% of total sales, up 23% year over year.
Let's see the full outlook from the ADI technical analysis:
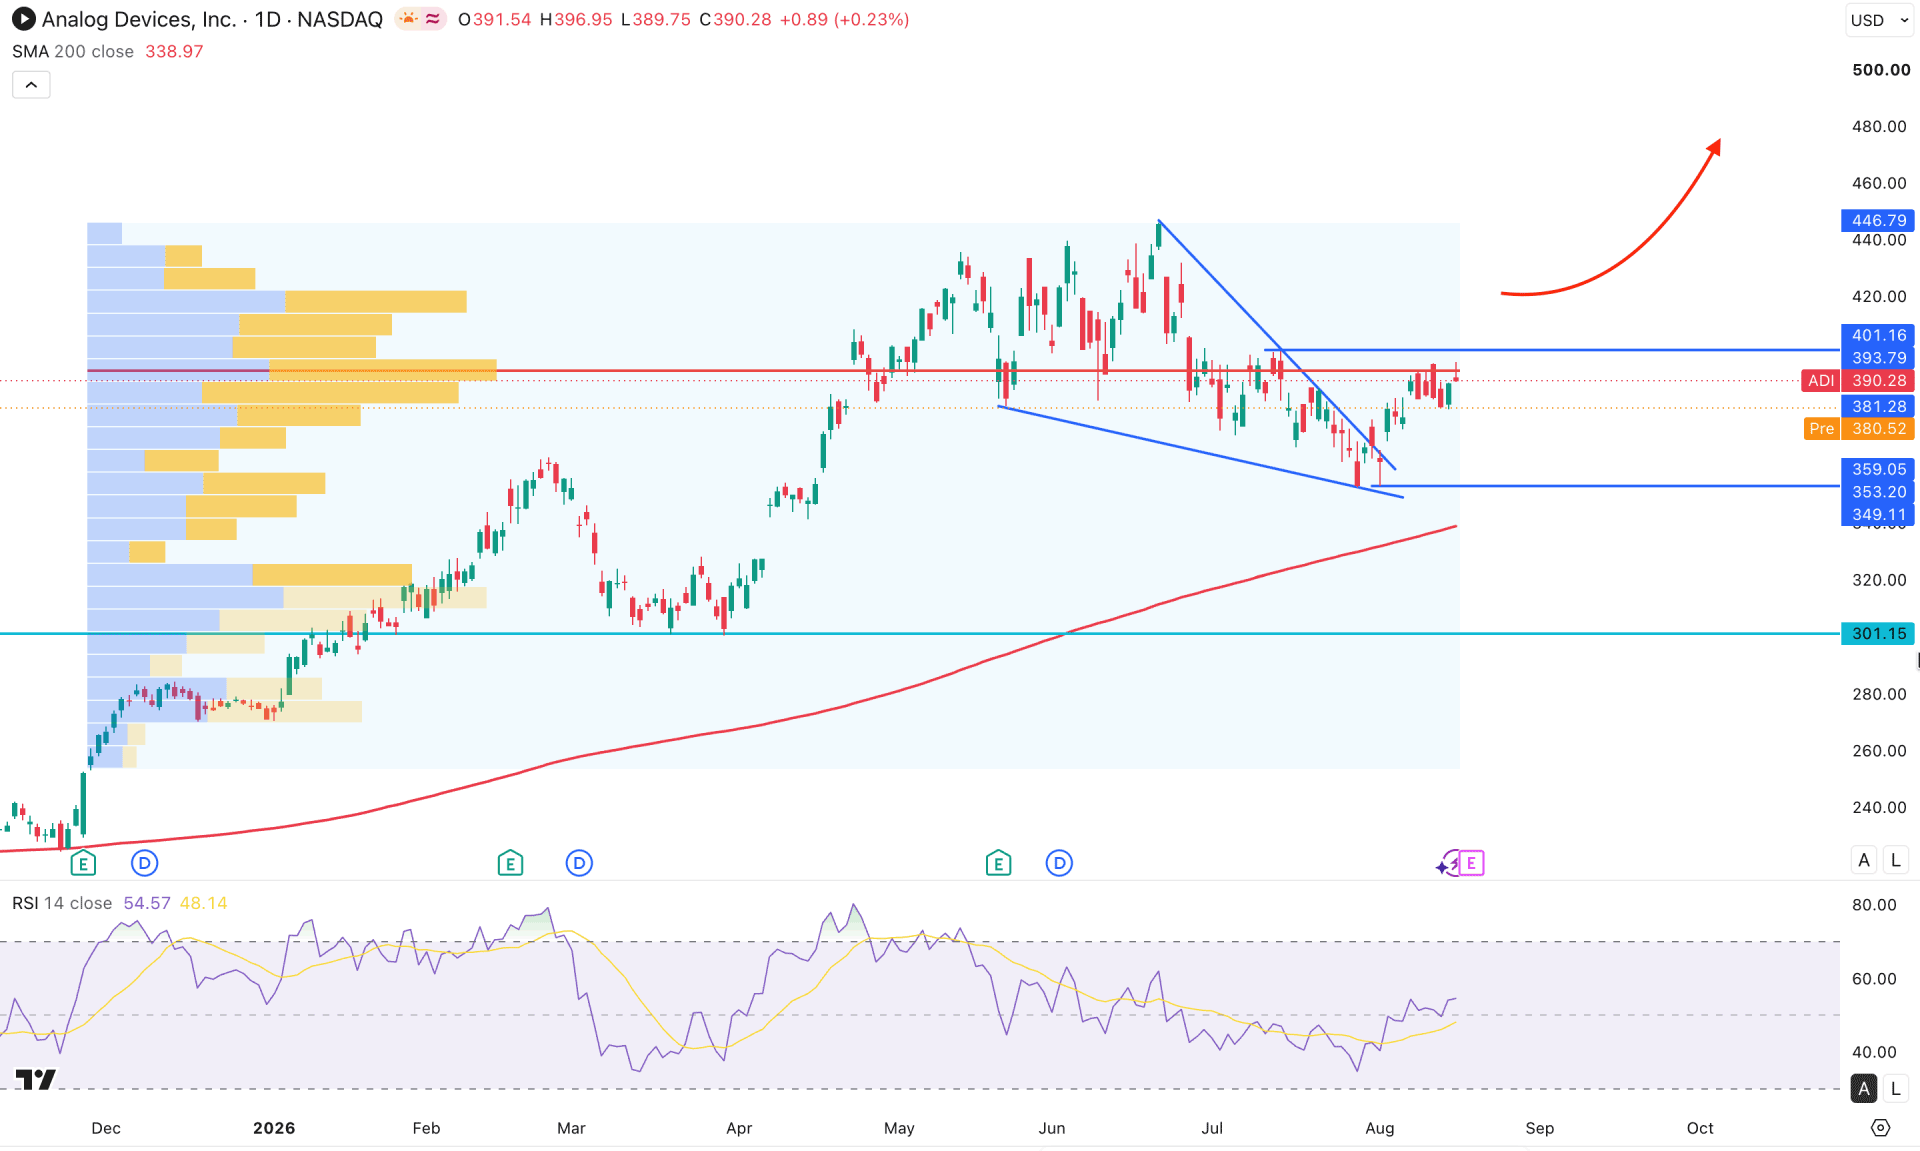
In the daily chart of Analog Devices Stock (ADI), the long-term market momentum is bullish, as the price has continued rising from the 2025 bottom. As no significant selling pressure is visible in the current price area, we may consider a bullish trend-continuation opportunity valid.
On the higher timeframe, the monthly candle suggests a bullish recovery after two consecutive bearish months, signaling potential upside. On the weekly timeframe, the early stages of a bullish recovery are visible, as the price is consolidating after a recovery with an engulfing pattern formation.
In the daily chart, volume is supporting buyers, as the most active level since December 2025 is around the 390.28 level, which is close to the current price. As the price hovers below the high-volume level, a potential breakout is pending, subject to validation of bullish momentum continuation.
In the main price chart, the 200-day SMA is below the current price structure, signaling a long-term bullish trend formation. Primarily, buying pressure remains valid as long as the price stays above the 200-day SMA line.
On the other hand, a bullish pennant pattern breakout is visible, and the most recent price is holding momentum above the pennant support. The Relative Strength Index is also favorable to buyers, as the current line is holding above the 50.00 neutral level.
Based on the overall market structure, we may anticipate bullish continuation as long as the price remains above the 353.20 key support level. A bullish break above the 400.00 psychological level could validate the opportunity, targeting the 450.00 area.
On the other hand, a considerable downside correction remains possible, where a test of the 353.20 support with a potential liquidity sweep could offer another long opportunity.
The ultimate support level for buyers would be the 200-day SMA, which could be tested before validating the next bullish wave. However, failure to hold the market above the 353.20 support line, with consecutive lower-low formations, could invalidate the bullish structure at any time. Before that, failure to break the 400.00 resistance line with a decent bearish recovery could be the first sign of a test of the 353.20 level before reaching the 200-day SMA.
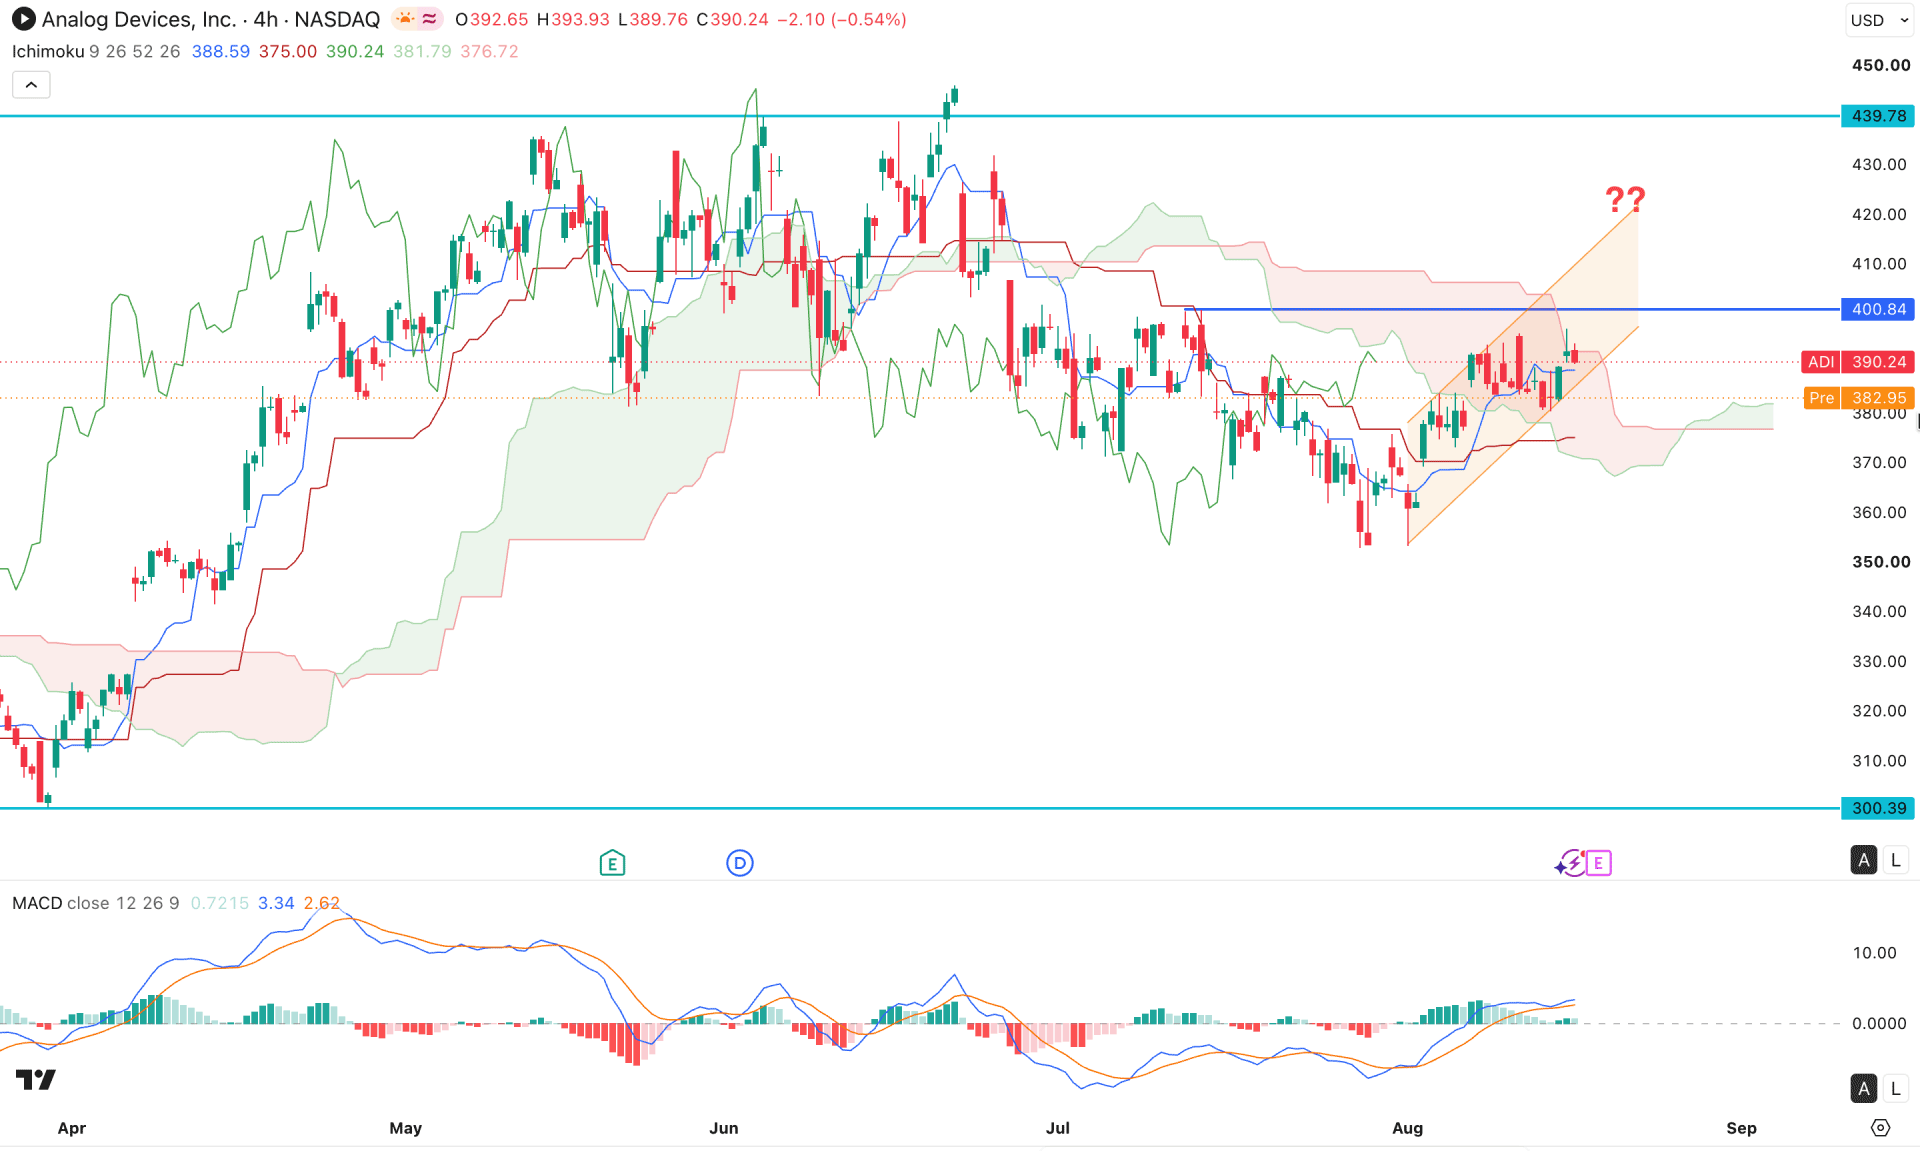
In the four-hour timeframe, ADI is aiming higher with a corrective structure. However, the Ichimoku Cloud is a crucial barrier to watch. Although the price is moving within an ascending channel, mixed market sentiment is visible as the price is hovering around the Ichimoku Cloud area.
In the future cloud, a bullish trend continuation is forming, as the current price is above the dynamic support level, with a bullish flip in the future cloud.
Moreover, the MACD histogram has maintained a buying position by remaining above the neutral line for a considerable time.
Based on this market outlook, bullish trend continuation is not confirmed yet, as the current price is still consolidating around the Ichimoku Cloud area. In this context, a bullish break above the 400.84 resistance level could increase the possibility of testing the 439.78 level before moving toward the 450.00 level.
On the other hand, minor bearish pressure with an immediate bearish break below the ascending channel could extend selling pressure at any time and create a new swing low below the 353.02 level.
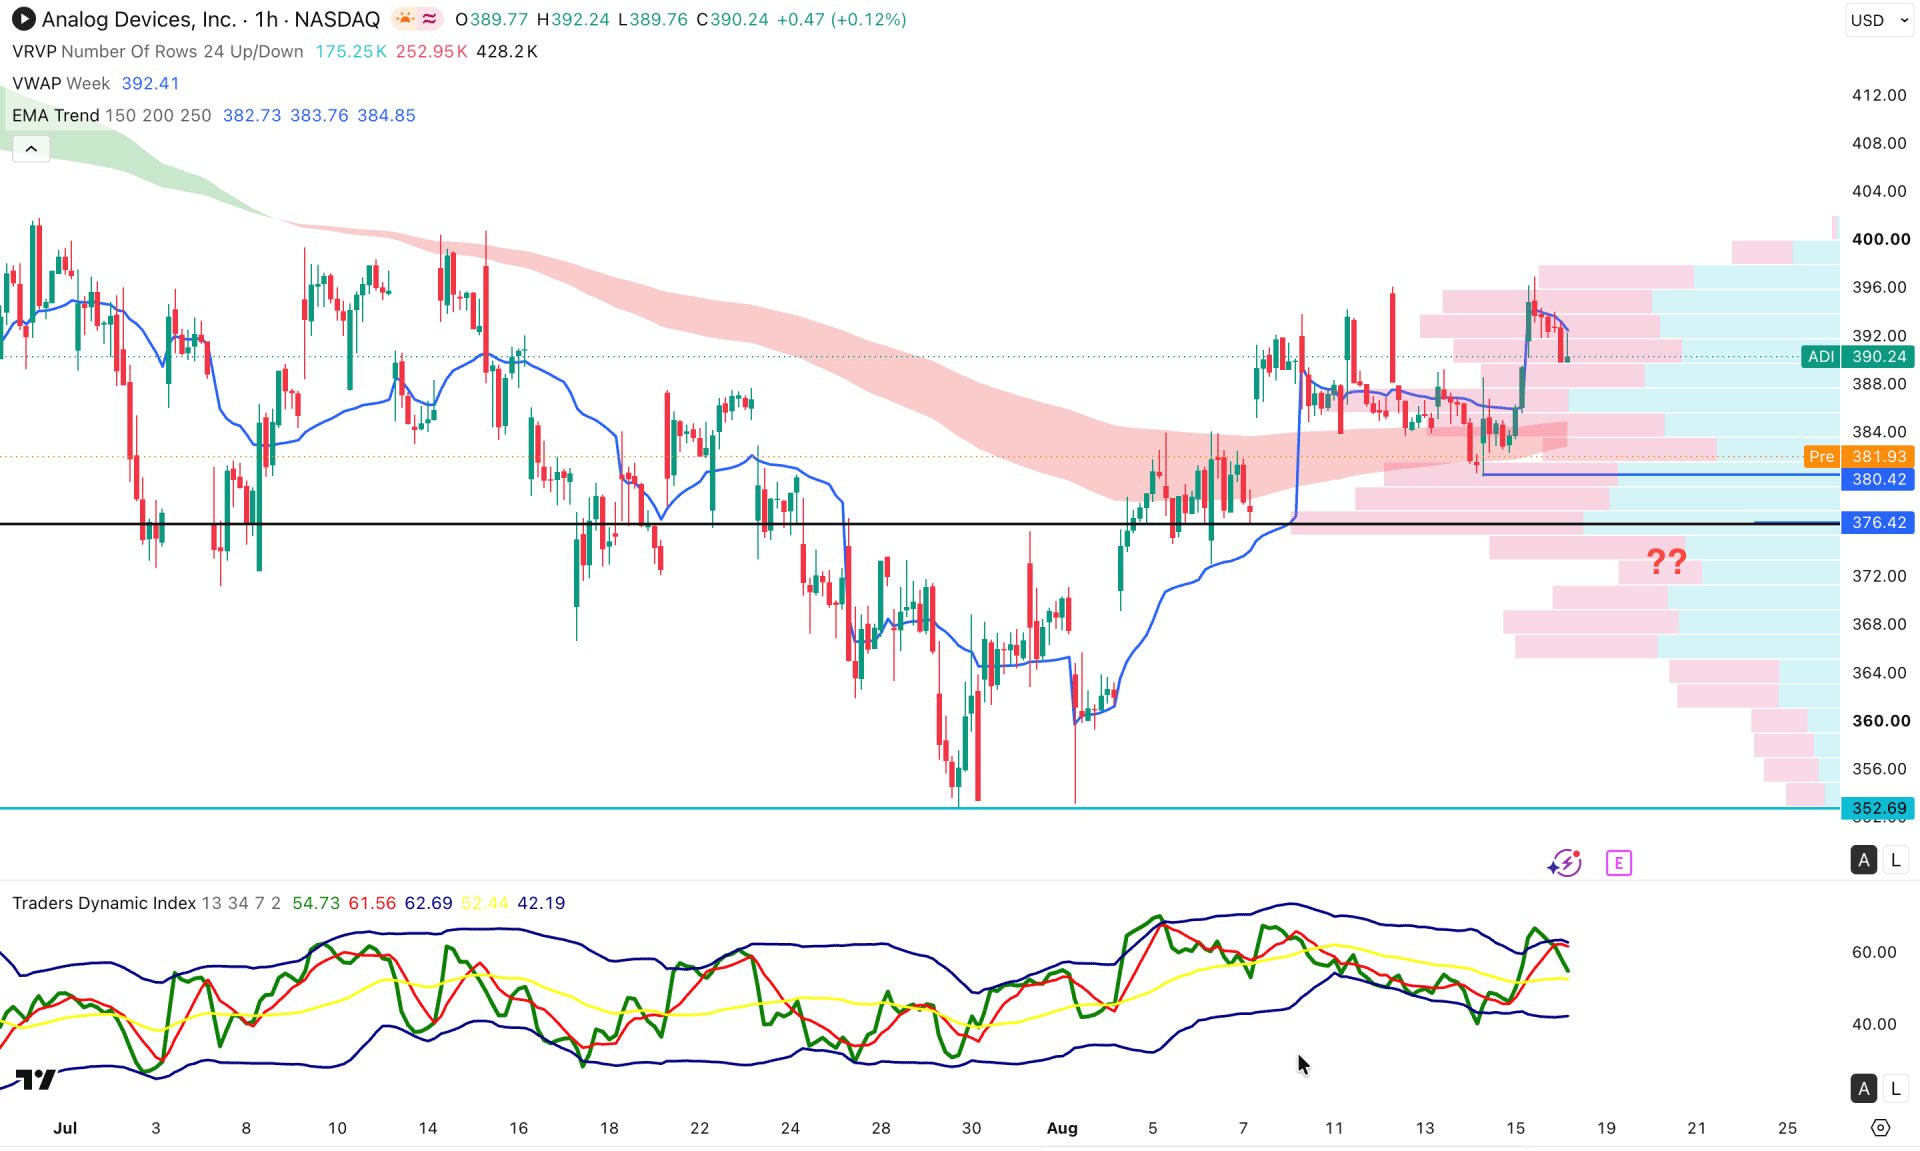
In the hourly timeframe, ADI stock is trading in a bullish zone, as the current price is hovering above the EMA wave and a high-volume level. As a bearish correction is pending after forming a new swing low from the 380.42 bottom, a minor downside correction is still possible.
In the Dynamic Index indicator, the recent line shows bearish pressure from the overbought area, signaling active selling pressure in the market.
Based on this outlook, a bullish rebound needs confirmation from the near-term support level at 380.42. Investors should closely monitor how the price reacts around this area, as a valid liquidity grab with a rebound above the VWAP level could validate a long opportunity from the 381.62 area toward the 376.00 area.
On the other hand, an immediate bearish break with multiple hourly candles below the 376.00 level could increase the possibility of testing the 352.69 supply zone.
Based on the intraday market structure, Analog Devices Stock (ADI) is trading within bullish trend-continuation momentum from the higher timeframe, where an intraday confirmation is still pending. Price is trading in the hourly premium zone, from where a minor correction with a valid rebound from the new demand zone could resume the existing trend in line with the daily context.


