Published: February 14th, 2023
American Express reported impressive fourth-quarter results and offered an upbeat outlook for 2023, resulting in investors' satisfaction. The management's positive forecast projects double-digit percentage revenue growth this year, which builds on the 25% top-line growth achieved in 2022. Moreover, the management eased investors' concerns about the company's performance in an uncertain macroeconomic environment by stating that they have not seen any indications of a recession from their customer base.
The fourth quarter saw a 17% YoY increase in revenue, which was a record $14.2 billion, driven by the company's highest-ever quarterly card member spending. The management anticipates a strong growth and expects revenue to rise by 15% to 17% in 2023.
Although the stock has risen by 17% in the last three months, it is still priced reasonably. The company offers an attractive dividend, and its shares trade at only 18 times earnings, which is less than the S&P 500's average price-to-earnings ratio of around 20. Moreover, the management's expectation of robust revenue growth in 2023 is an added incentive.
Despite the recent increase in share price, the stock's value has declined by approximately 4% in the past 12 months. Investors who have missed the opportunity to buy shares at a reduced price may reconsider their view. Based on American Express's business momentum, the stock looks undervalued, although there is no guarantee that it will rise to $210 in the following year.
Let’s see the upcoming price direction of this instrument from the AXP technical analysis:

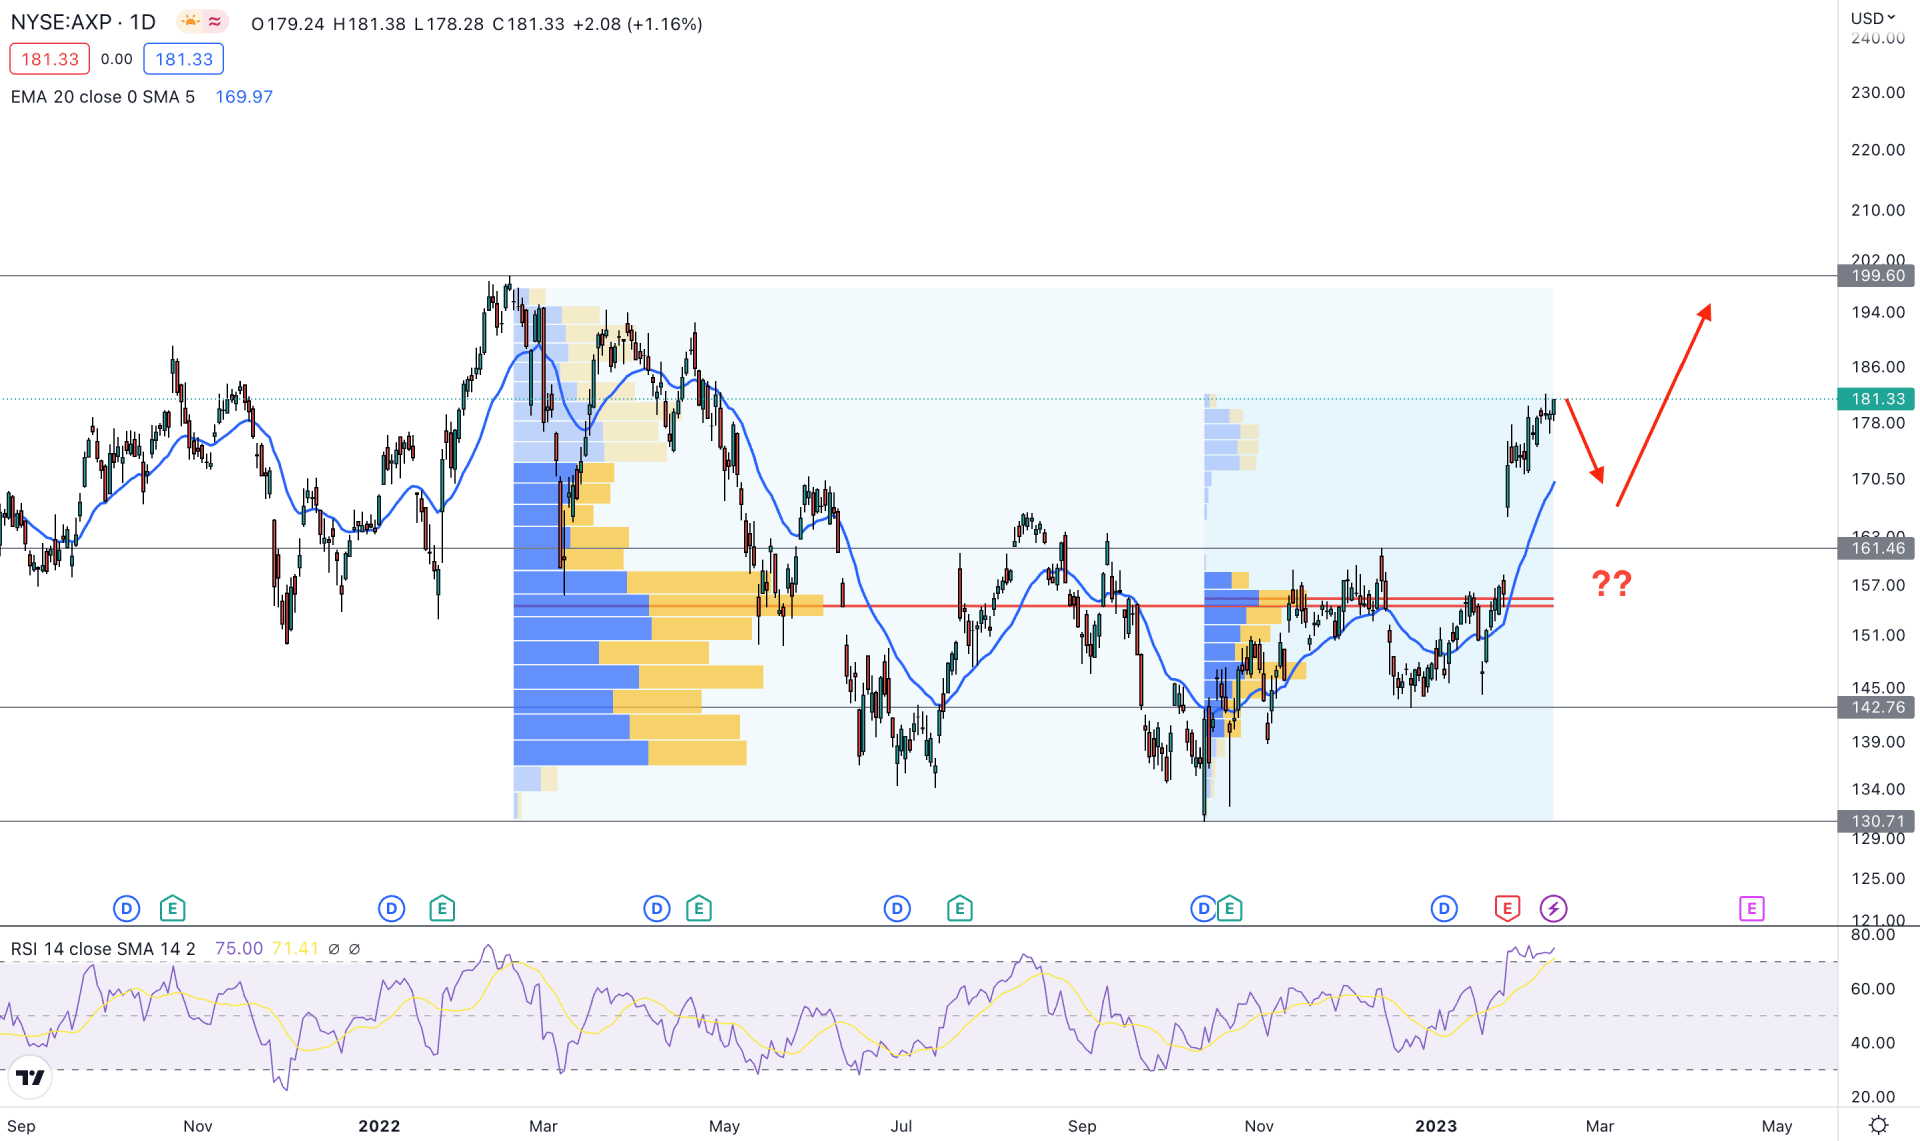
In the daily timeframe, the broader outlook of the AXP stock is bullish. January 2023 appeared as a strong bullish monthly candle, while the current February price is above the January high. The strong uptrend is also visible from the weekly chart, as multiple bullish weekly candles are seen in these months.
Institutional investors support the upside momentum as the current price is having multiple high-volume levels below it. The first high volume from January 2022 to February 2023 is spotted at the 154.56 level. Another high volume level from September to February is also found at 155.51 level. It is a sign that several institutional investors' interest was seen from the 156.00 to 154.00 area, a sign of strong buying pressure.
In any trend trading opportunity, it is wise to wait for the price to complete the correction first. For the AXP daily chart, a sufficient bearish correction is pending, even if the major market trend is bullish.
The dynamic 20 DMA is below the current price with a strong gap, while the current Relative Strength Index (RSI) is at an overbought area.
Based on the current daily structure, a minor downside correction may come in the AXP price. However, any bullish rejection from the 163.00 to 155.00 area with a daily close could offer a long opportunity, targeting the 200.00 level.
The alternative trading approach is to wait for the price to come below the 151.00 level, which could extend the downside pressure toward the 130.00 area.

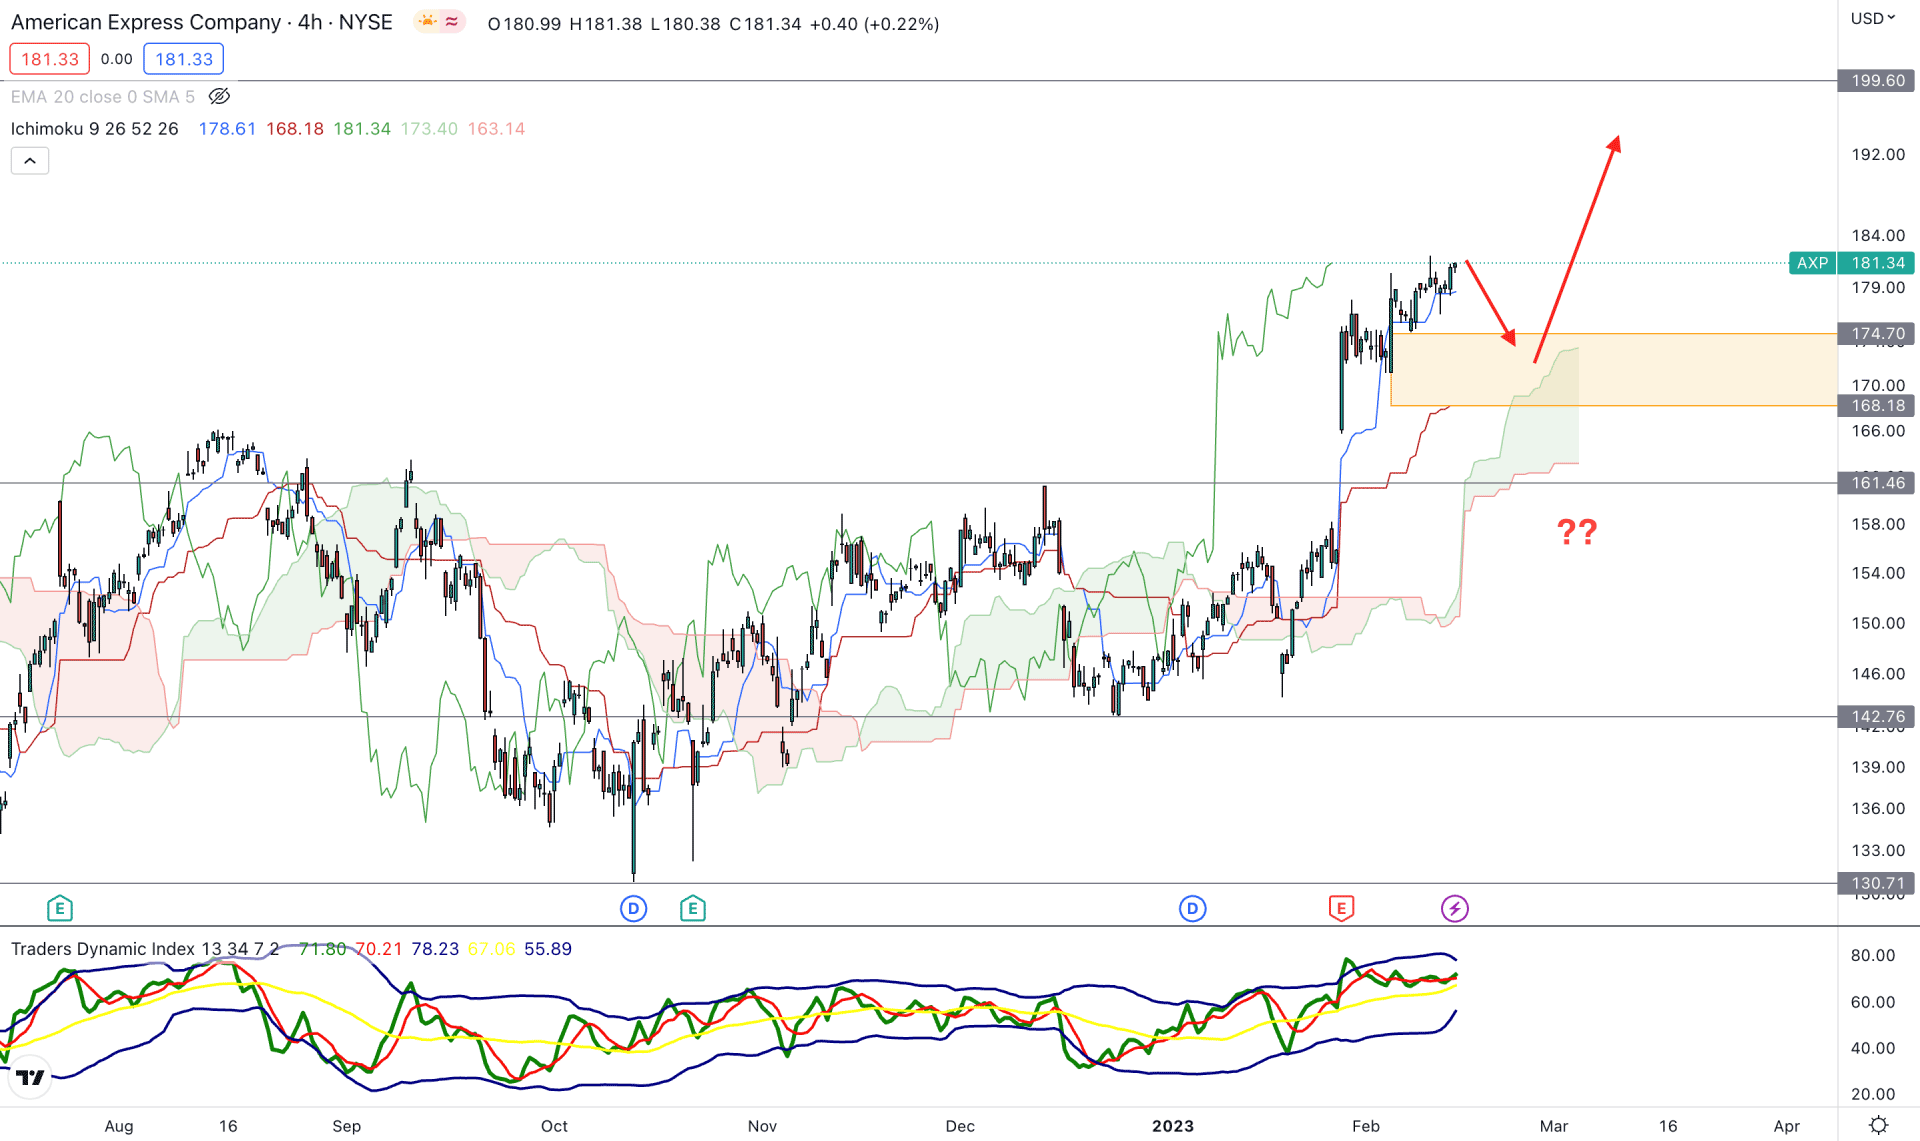
In the H4 timeframe, the current market outlook for AXP is bullish as the current price is above the Ichimoku Kumo Cloud with a bullish continuation pattern.
In the future cloud, the gap between Senkou Span A and B has expanded, while both of these lines represent a strong bullish trend.
The current dynamic levels are below the price, while the gap between the Tenkan Sen and Kijun Sen indicates a bearish correction possibility.
In the indicator window, the current Traders Dynamic Index structure shows a bullish momentum as it remained above the 50% level for a considerable time.
Based on this structure, we may expect the price to come down towards the dynamic Kijun Sen or Cloud support before forming another higher high. However, breaking below the 160.00 level with an H4 close will eliminate the current buying possibility.

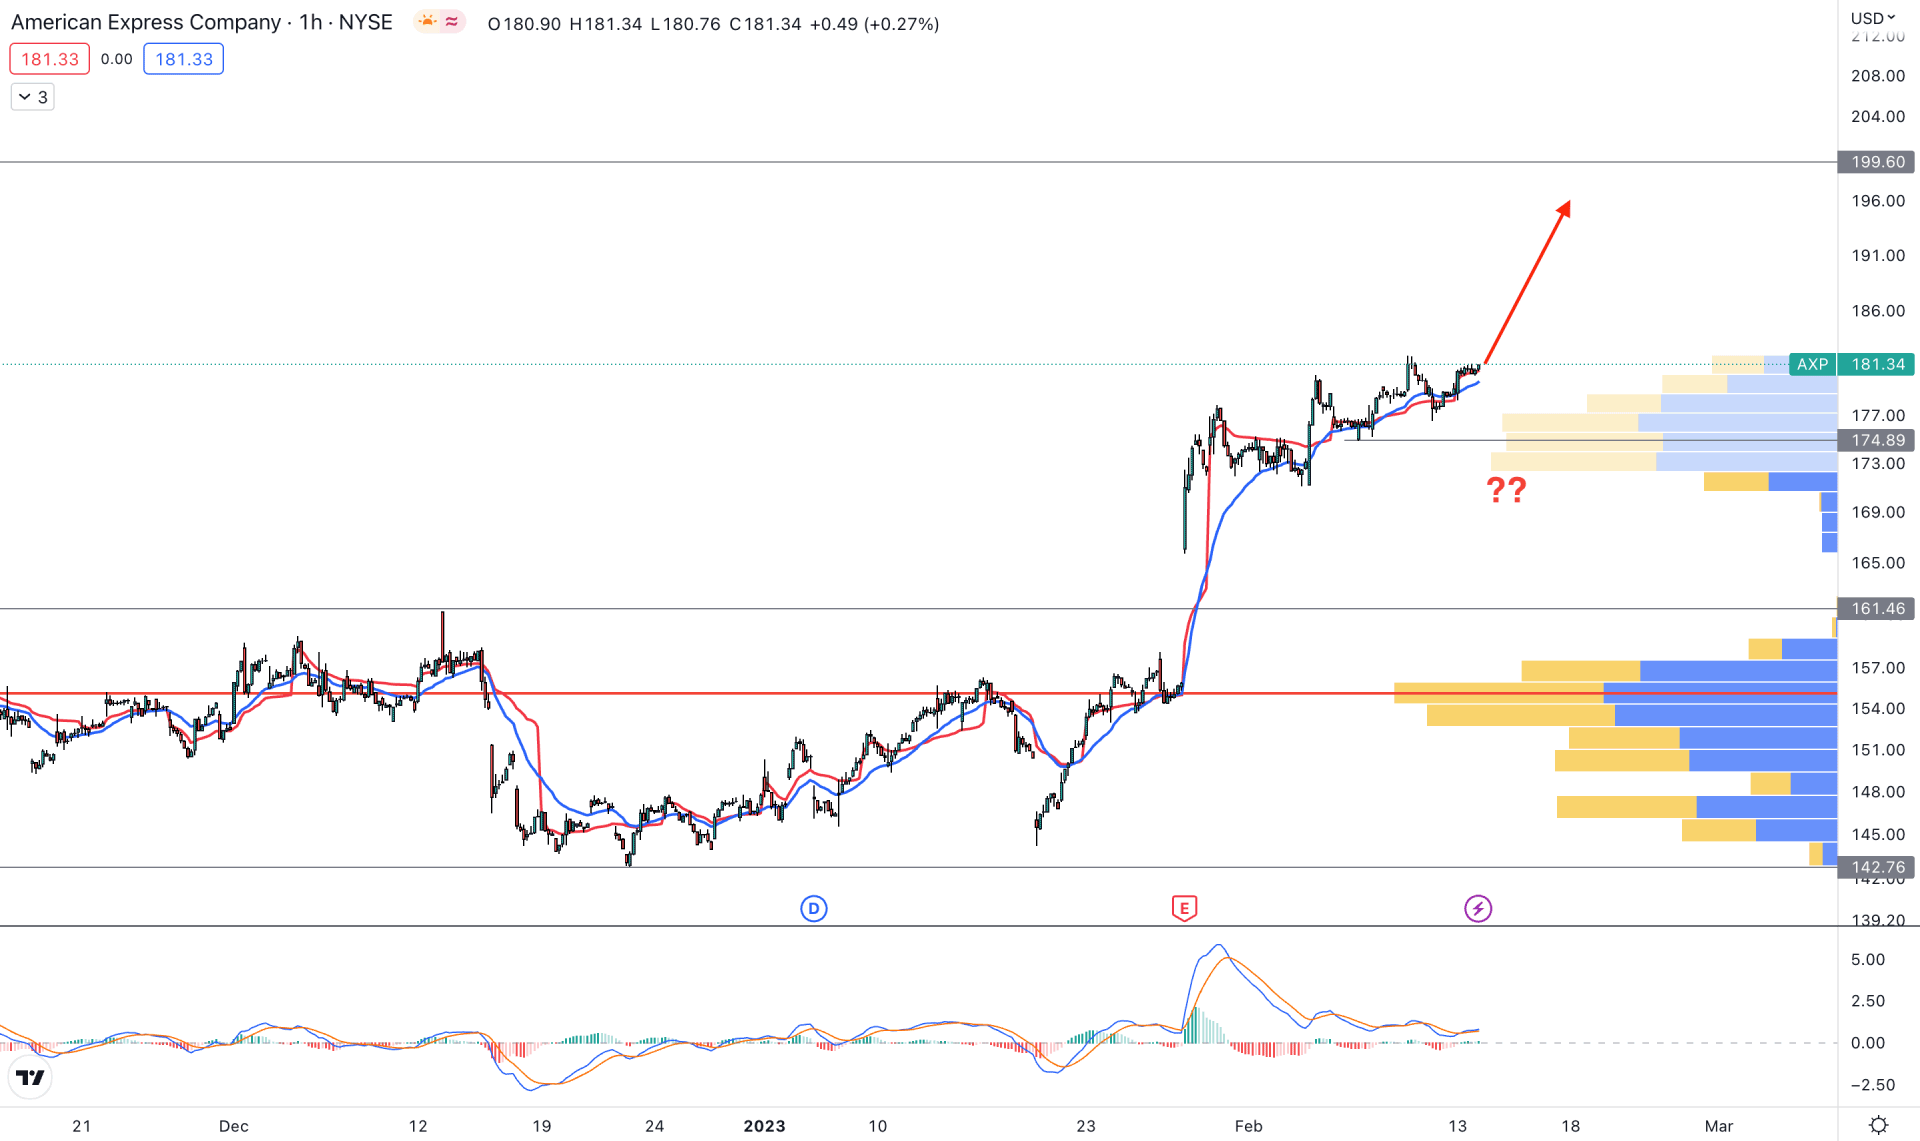
In the hourly chart, the current price outlook is extremely bullish as it is above the visible range high volume level of 155.21. Moreover, the dynamic 20 EMA and weekly VWAP are closer to the current price, working as a support level.
The indicator windows show a buying possibility as the current MACD EMA’s are extremely corrective but holding a strong ground above the neutral zero level.
Based on this price structure, further upside momentum could come until the price exceeds the 174.00 level.
A strong break and an H4 candle below the 172.00 level could lower the price toward the 155.00 area.
Based on the current multi-timeframe analysis, the broader outlook of the AXP is bullish, where a minor downside pressure is still pending. Therefore, the best buying is available once the correction is over with bullish rejection candlesticks.