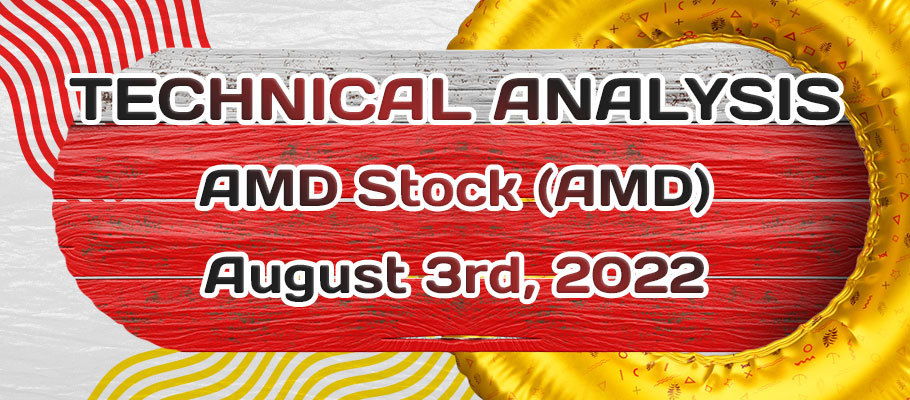
Published: August 3rd, 2022
Advanced Micro Devices, Inc. (AMD) Stock decreased by 0.4% after the market closed, although there was upbeat data for revenue and earnings per share.
In the latest quarterly earnings report, AMD reported a 70% increase in revenue to $6.6 billion, above the consensus of $6.53 billion. Moreover, the earnings per share came at $1.05, above the expectation of $1.03. All revenue segments showed a positive result besides the revenue Xilinx (NASDAQ: XLNX).
According to AMD Ceo, the company showed eight consecutive positive quarters, which came from its strong execution and expansion of the product portfolio. Moreover, the growth will extend in the coming quarter while the 5-nanometer product shipment will be the key price driver.
In the revenue segment, the data center segment showed an 83% year-over-year increase to $1.5 billion due to its EPYC™ server processor sales. The client segment's revenue was up by 25% to $2.2 billion year-over-year. The gaming segment also saw a development of 32% revenue growth to $1.7 billion.
In the coming quarter, the company expects the revenue to be within the $6.5-6.9 billion range, while the full year projection showed a $26.3 billion revenue, up from $26.1 billion.
Let’s see the future price direction from AMD Stock (AMD) Technical analysis:
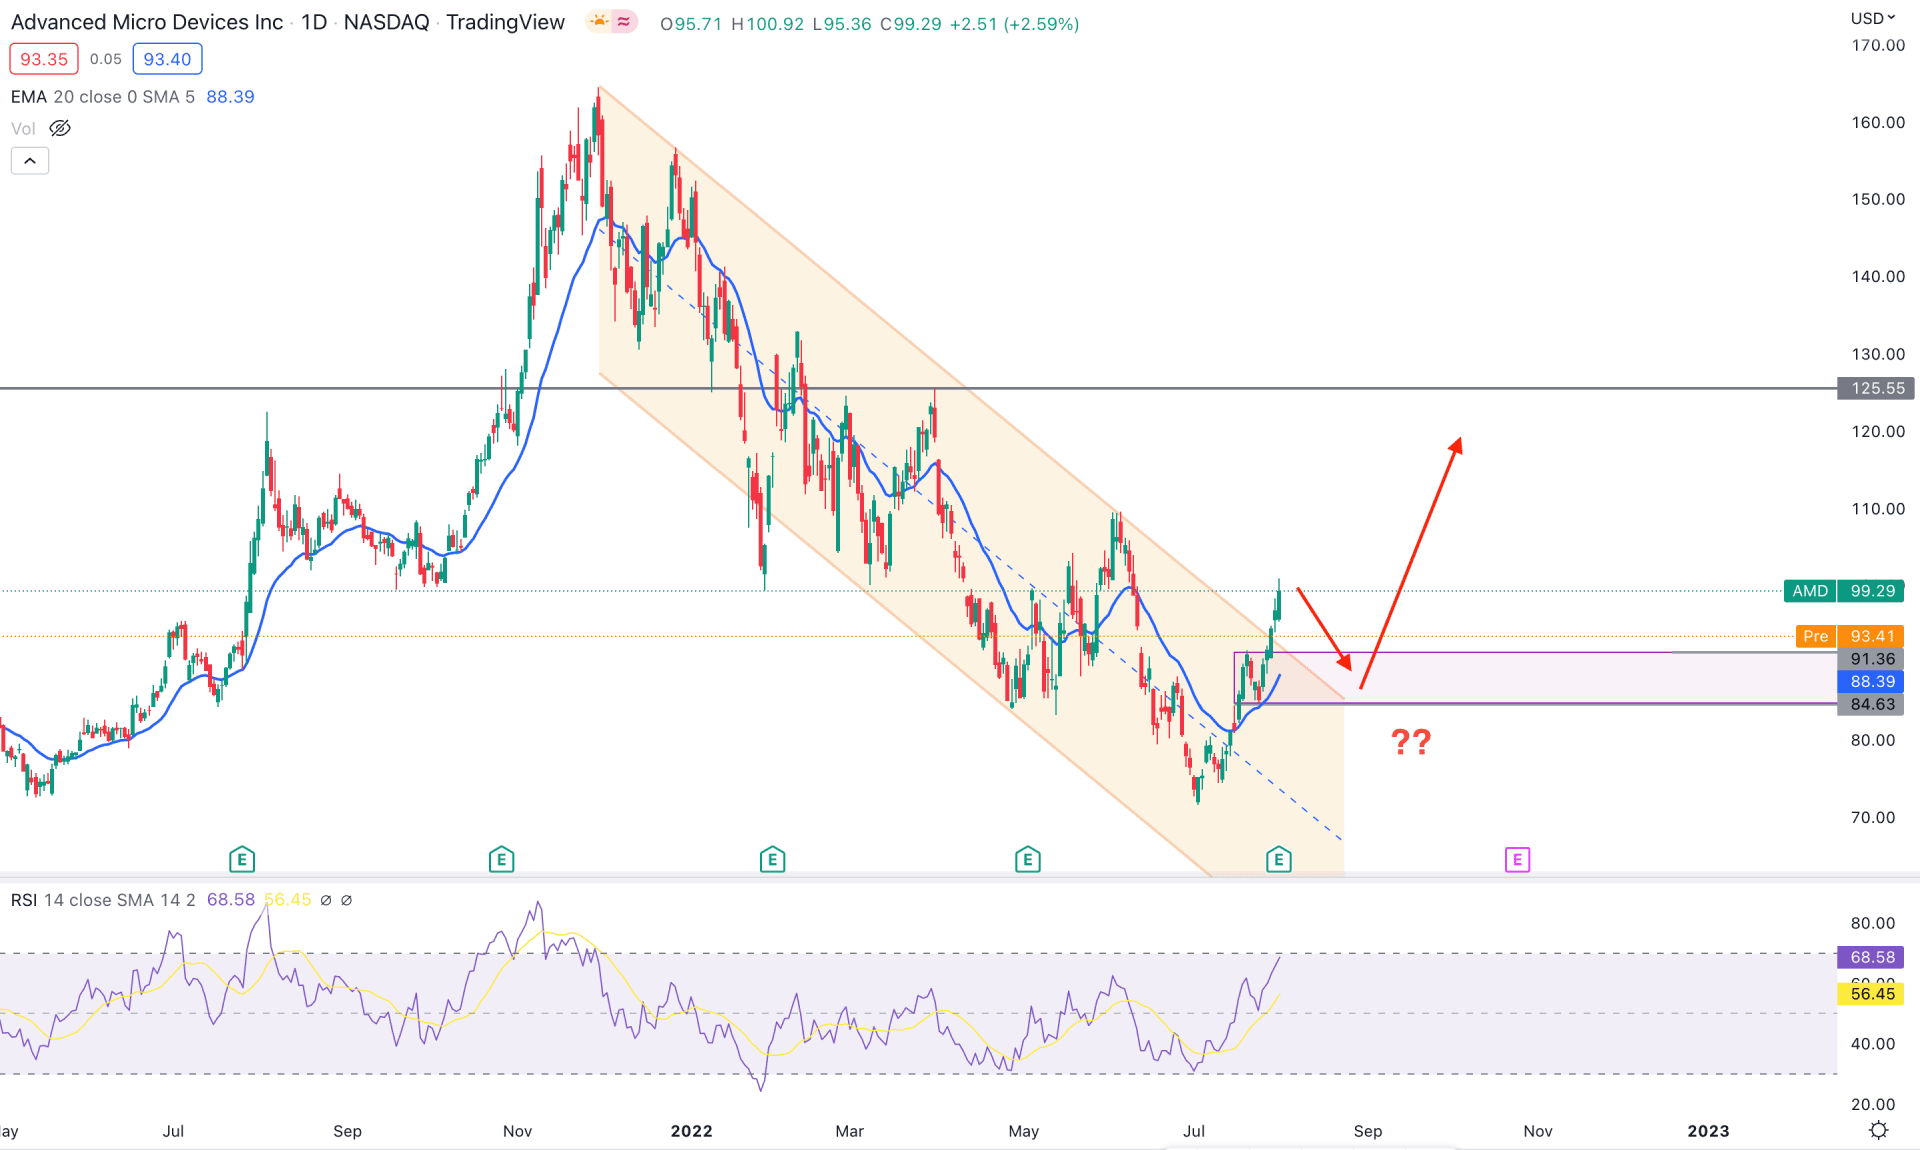
Although AMD provided consecutive positive quarters, it failed to show any strong buyers’ presence in the daily chart. As a result, the price peaked at 71.73, with a 56% loss from the November 2021 high. However, the lower price with a growth potentiality could grab buyers' attention for this instrument.
Although the selling pressure was intense in recent months, the price trades within a channel. Therefore, after a considerable correction, the recent channel breakout with a positive quarterly earnings report could provide a bullish opportunity.
The price moved above the dynamic 20 EMA, followed by the V-shape recovery within the channel. As a result, the 91.36 to 84.63 zone has become an area of interest by investors. The Relative Strength Index (RSI) reached the 68.58 level, with further upside pressure above the 70.00 level pending.
Based on the AMD stock daily chart, the validation of the channel breakout needs a bearish correction towards the 64.63 area from where any bullish daily candle could open a bullish opportunity. On the other hand, the alternative approach is to find the price below the 80.00 psychological level, which may open a bearish opportunity toward the 48.00 level.
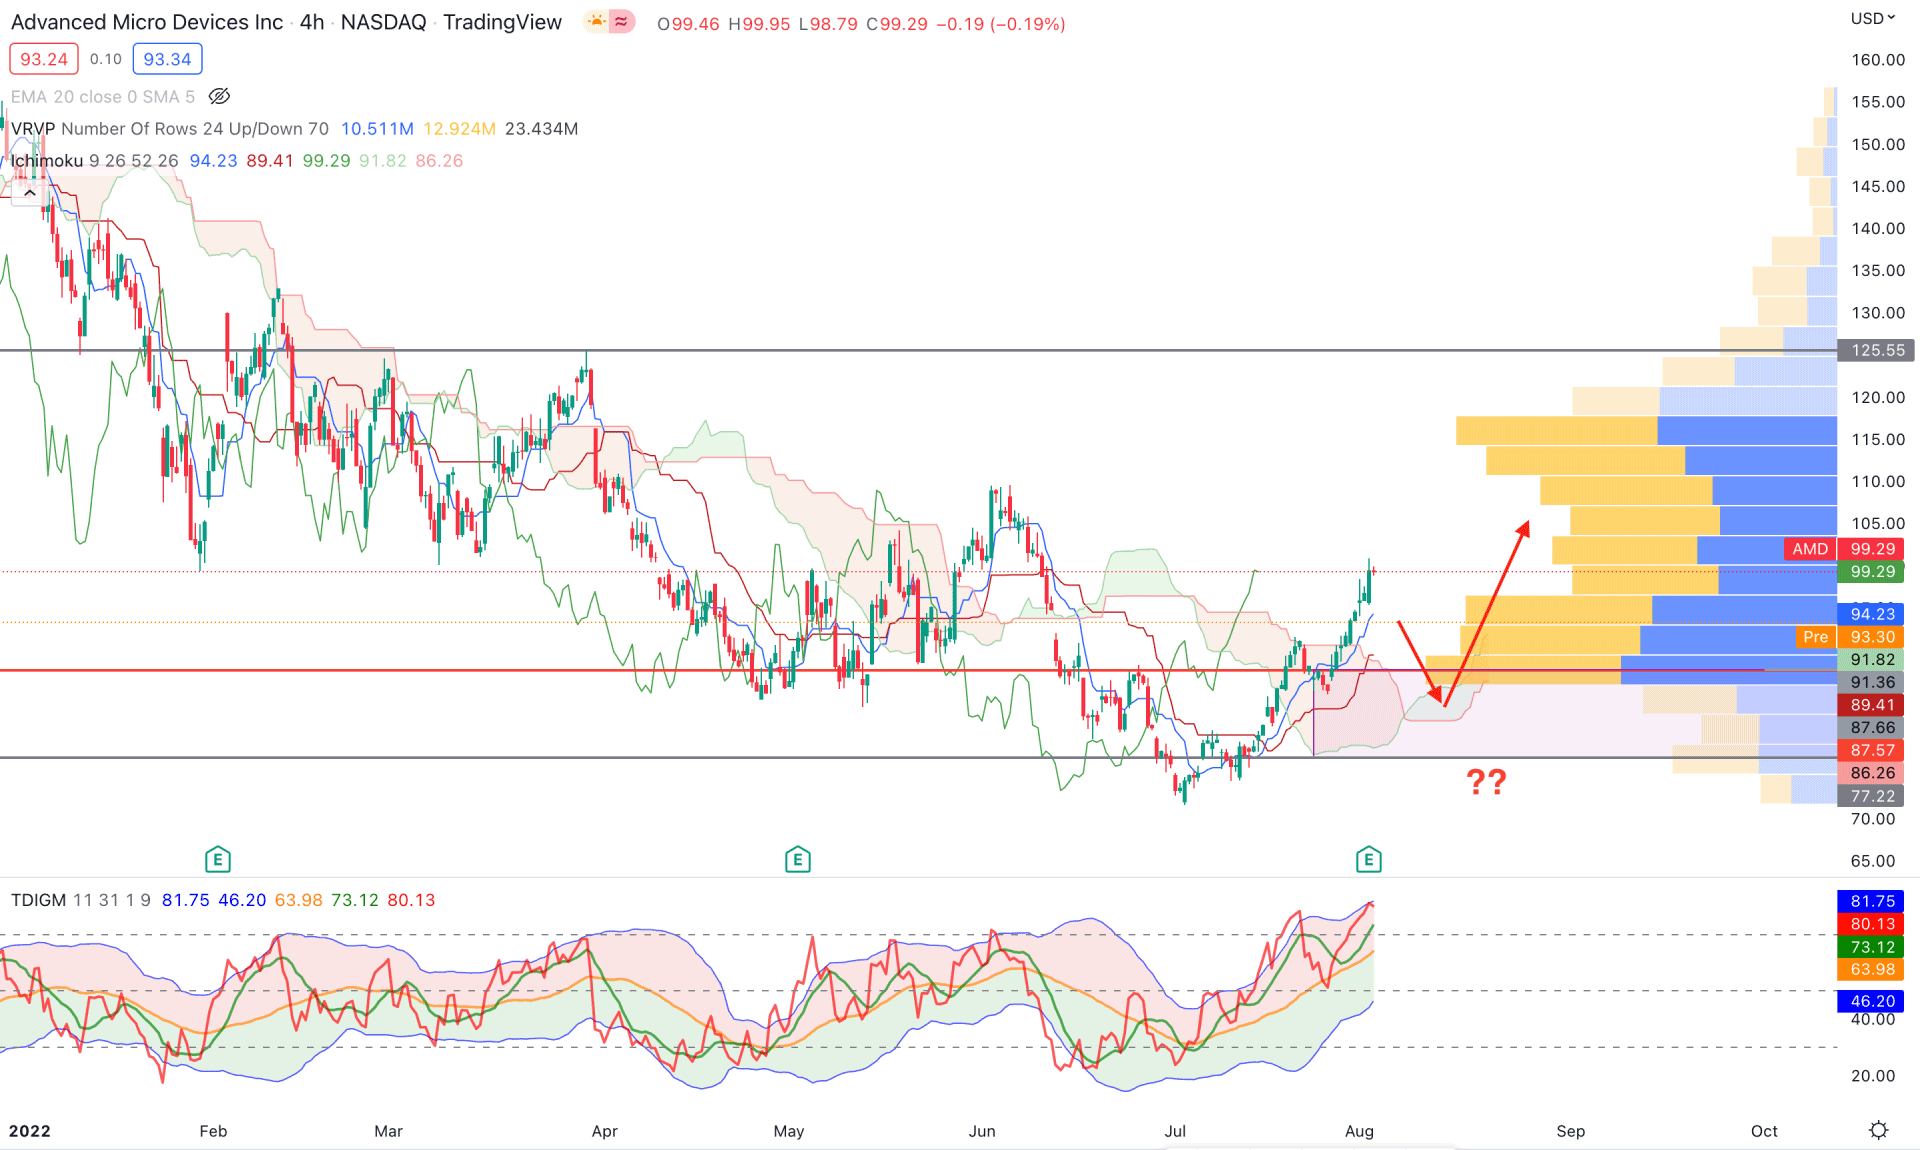
According to the AMD H4 chart, the price offers a potential bullish opportunity where the risk vs. reward ratio is affordable. Based on the Ichimoku Cloud, the price moved above the Cloud area, indicating that bulls have taken it towards their zone. On the other hand, the future cloud is also supportive for bulls where the Senkou Span A is above the Senkou Span B.
Based on the visible range volume, the price can find the 87.66 level as a confluence support level, whereas the 77.72 is a static level. As a result, the 87.66 to 77.72 zone could work as a trend shifting point from where any bullish rejection could increase the price.
The indicator window shows an extreme buying activity where the current TDI level is at the upper boundary. However, the pre-market price is below the 99.29 closing price, where downside pressure is pending, based on TDI.
Based on the H4 context, the 87.66 to 77.72 zone would be a solid buying point from where a bullish rejection with an H4 close above the dynamic Kijun Sen would take the price higher towards the 125.55 resistance level. On the other hand, a bearish H4 candle below 77.00 would provide a bearish opportunity toward the target of the 65.00 level.
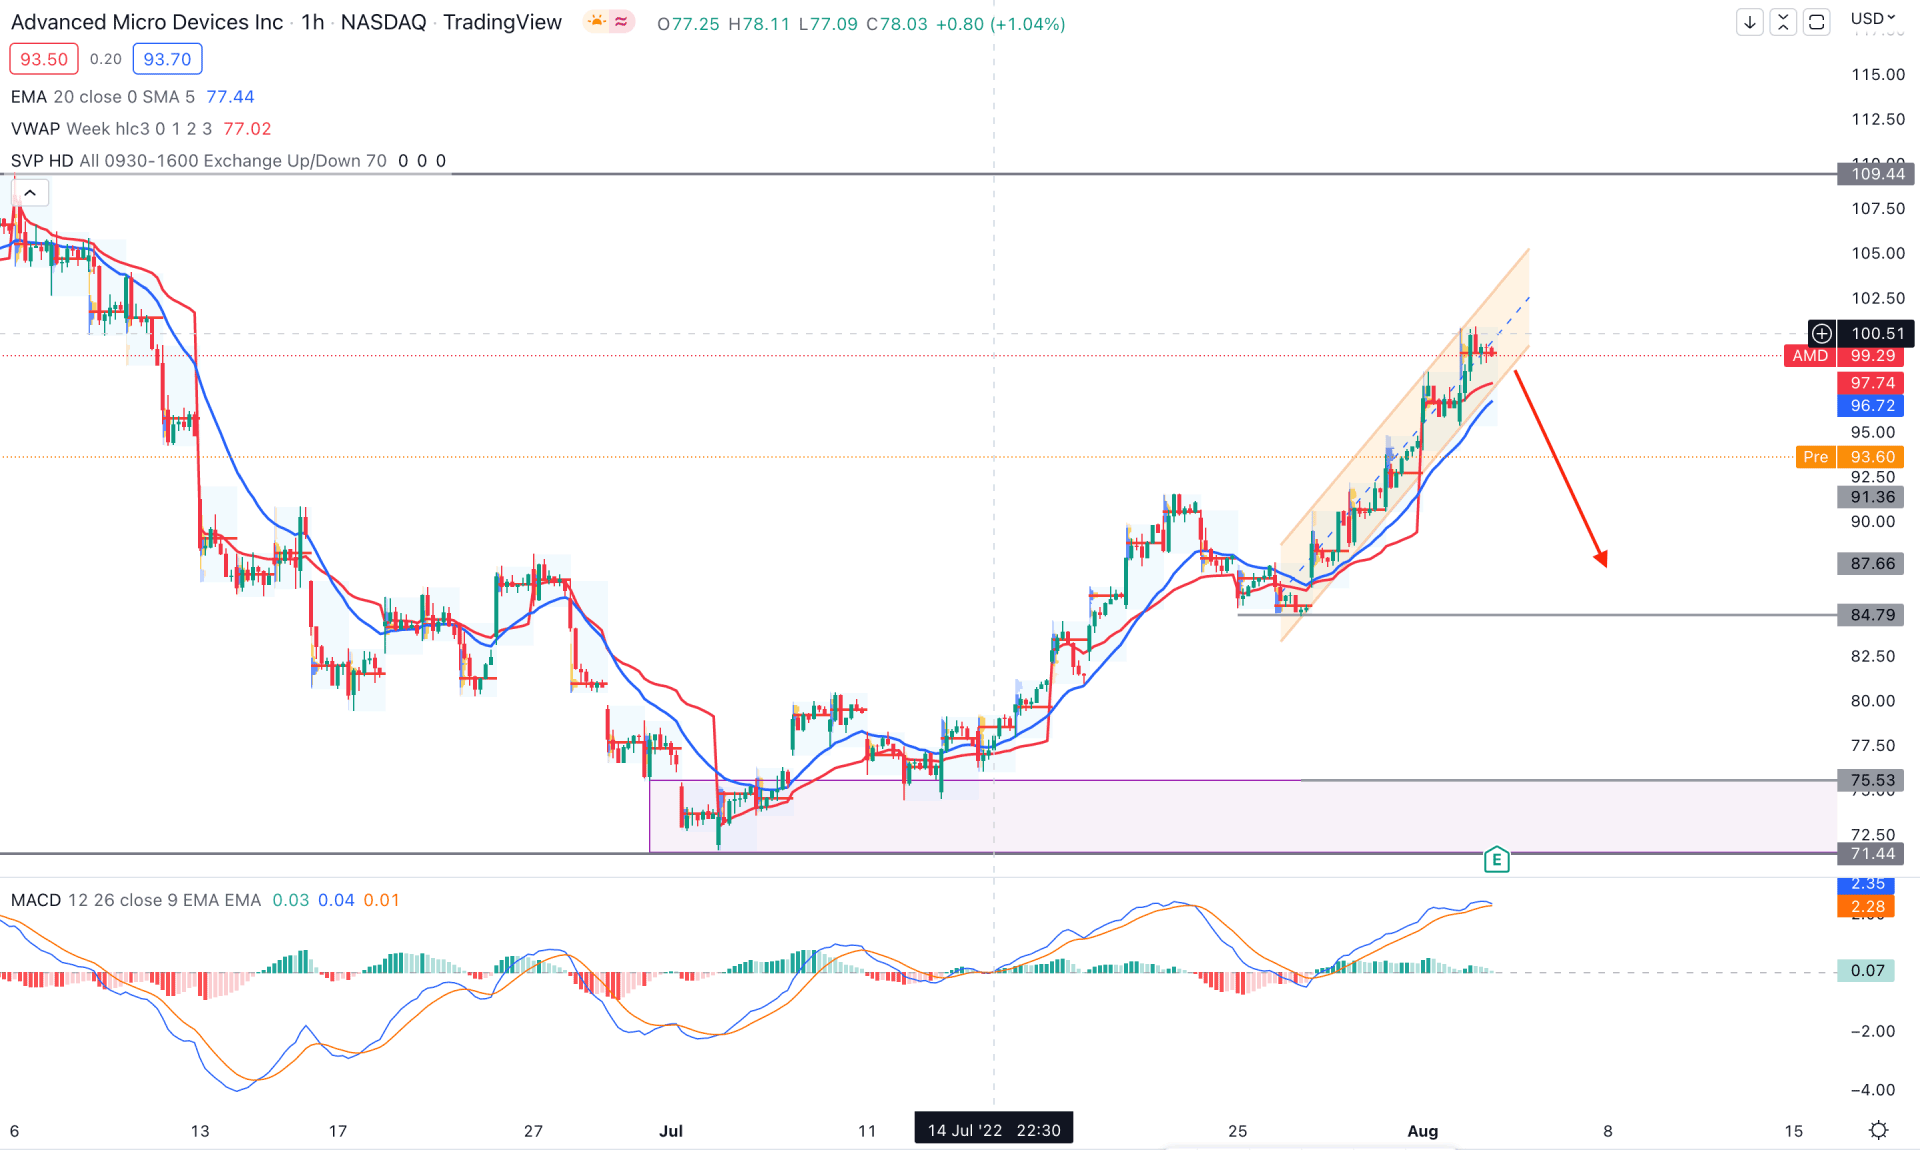
The AMD stock intraday chart trades within an impulsive bullish pressure where the current price is above the dynamic 20 EMA and weekly VWAP. However, the buying pressure from 77.50 left the 76.53 to 71.44 area untested. As a result, any bearish H1 close below the bullish channel could lower the price toward the 76.53 level.
The indicator window shows an overextended MACD where a bearish crossover in MACD EMA’s could initiate the selling pressure. Based on this structure, the long-term bullish pressure may resume once the price completes its intraday correction by moving below the 84.79 swing low.
Based on the current multi-timeframe analysis, AMD stock is more likely to move down with a corrective movement. However, if the price shows any strong bullish rejection from the near-term support level, it could provide a bullish opportunity followed by the daily channel breakout.


