Published: October 29th, 2024
Because of Amazon Web Services (AWS), investors can experience cloud computing through Amazon (AMZN) shares. AWS is the industry leader in cloud computing and has a sizable global market share. It offers various services, such as databases, storage, processing power, and AI/ML tools.
This week, the results are anticipated following Thursday's market close. The $1.14 Researchers Consensus EPS forecast has been downward 4% since the start of August, indicating somewhat pessimistic expectations for earnings for the quarter that will be reported.
Nevertheless, significant growth is anticipated; the estimate calls for an annual increase in EPS of 34%.
AWS's year-over-year growth rate is noteworthy, and it is currently reaccelerating. Concerns were raised during several periods of slower development, but the AI craze has helped allay those worries.
Given that the present 33.3X ahead 12-month revenue multiple is only a small portion of the 60.3X five-year average and the 123.4X five-year peaks, the valuation envision is not stretched. The present PEG ratio is also 1.2X, which is significantly lower than past medians.
Let's see the upcoming price direction of this stock from the AMZN technical analysis:

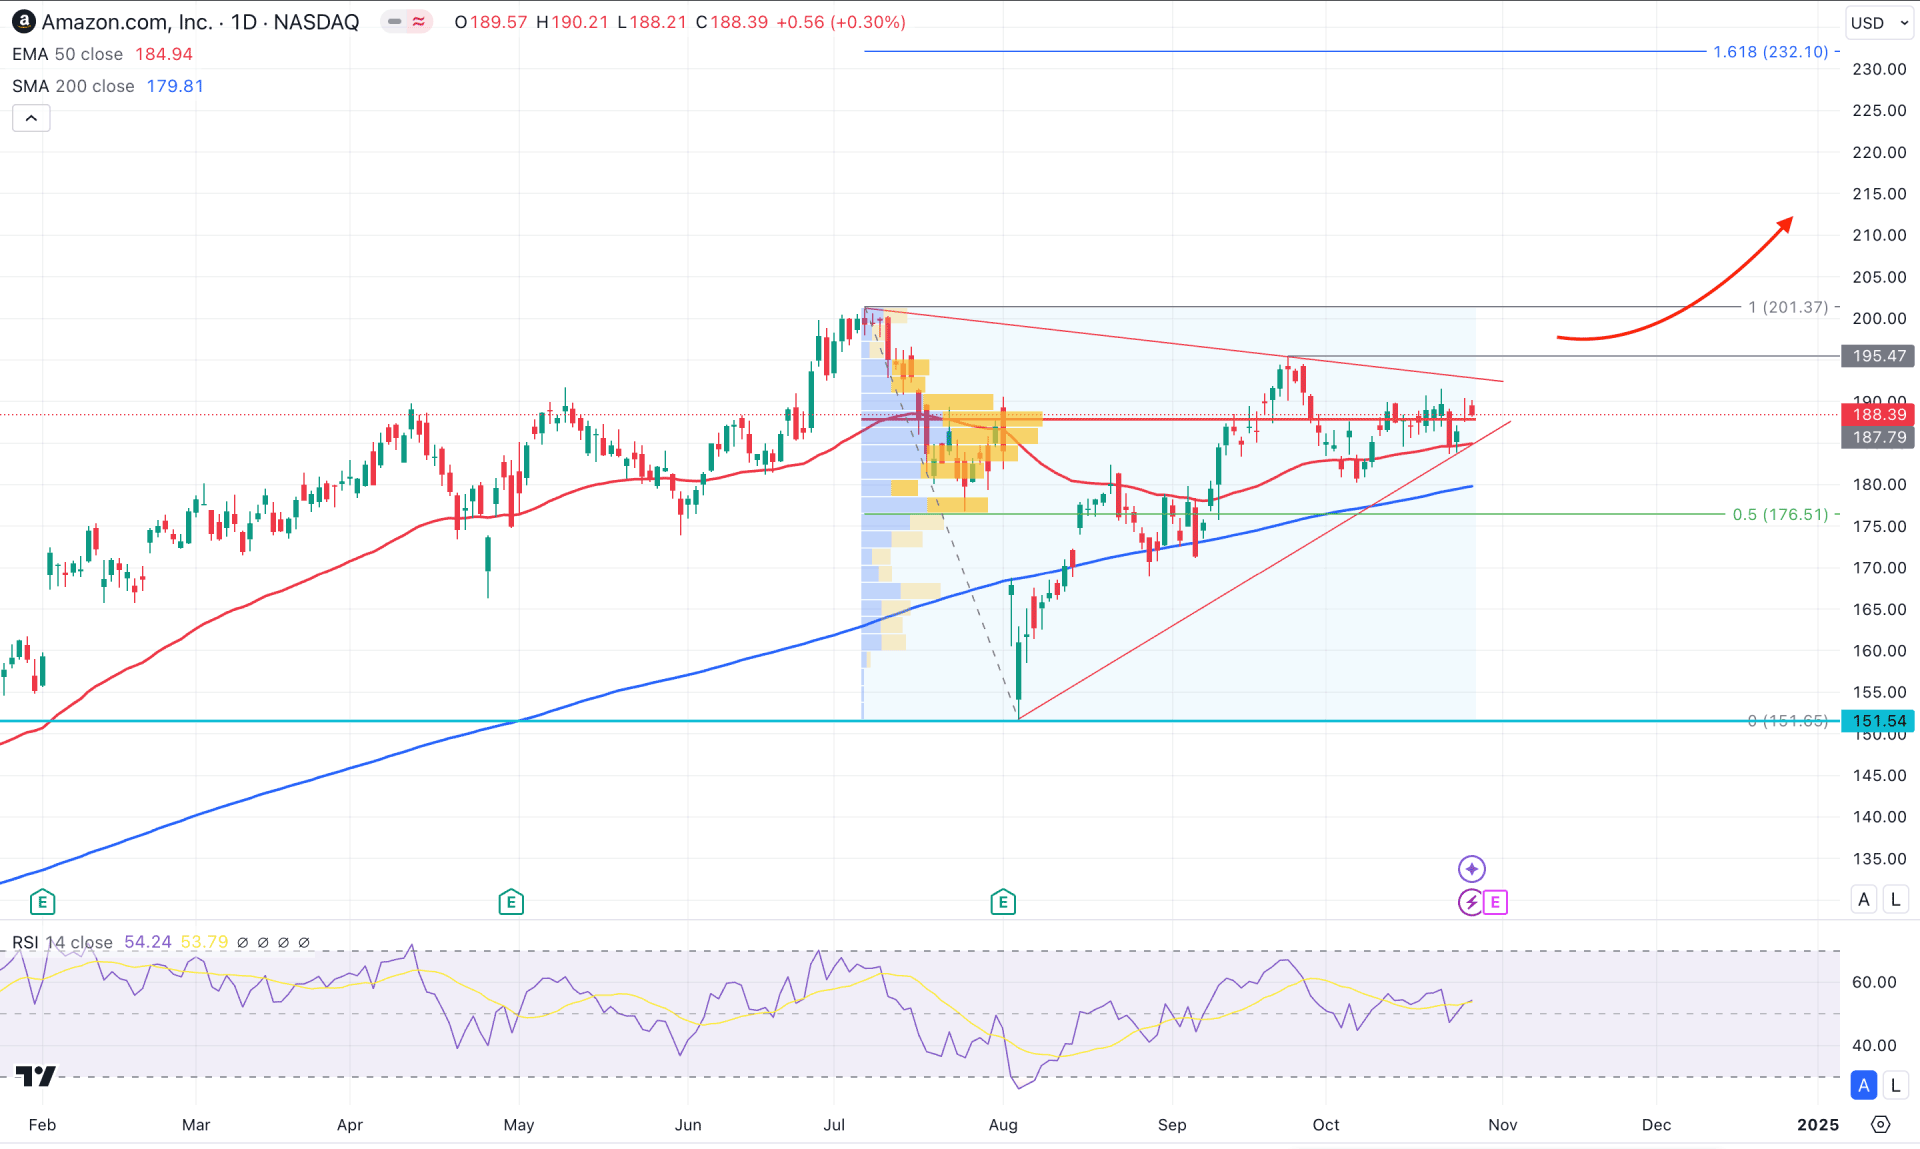
In AMZN's daily chart, the most recent price action is corrective, as the current price is hovering within the symmetrical triangle formation. In this context, the ideal trading approach is to look for a valid breakout before anticipating the long-term trend.
In the higher timeframe, the price is trading at the premium zone. The monthly candle in August 2024 came with a bearish exhaustion, followed by a bullish candle in September. Following the market trend, the price is trading bullish, and the September high could work as a crucial resistance.
The volume shows a positive outlook as the current price hovers just above this line. A potential range breakout could offer a trend trading opportunity as the current price action is corrective and the high volume line is closer.
In the main price chart, the 200-day Simple Moving Average is below the current price, which suggests a major bullish trend. Moreover, the 50-day EMA is also below the current price and working as a confluence bullish factor. In that case, the major market momentum will be bullish as long as it hovers above the 200-day SMA line.
In the secondary indicator window, the current 14-day Relative Strength Index (RSI) hovers at the 50.00 area, suggesting a neutral momentum. In that case, a valid bullish Symmetrical triangle breakout with a daily candle above the 195.47 high could validate the bullish possibility of aiming for the 232.10 Fibonacci Extension level.
The alternative approach is to look for massive downside pressure with a daily candle below the 200-day SMA line. In that case, the downside pressure could extend and find support from the 151.54 horizontal line.

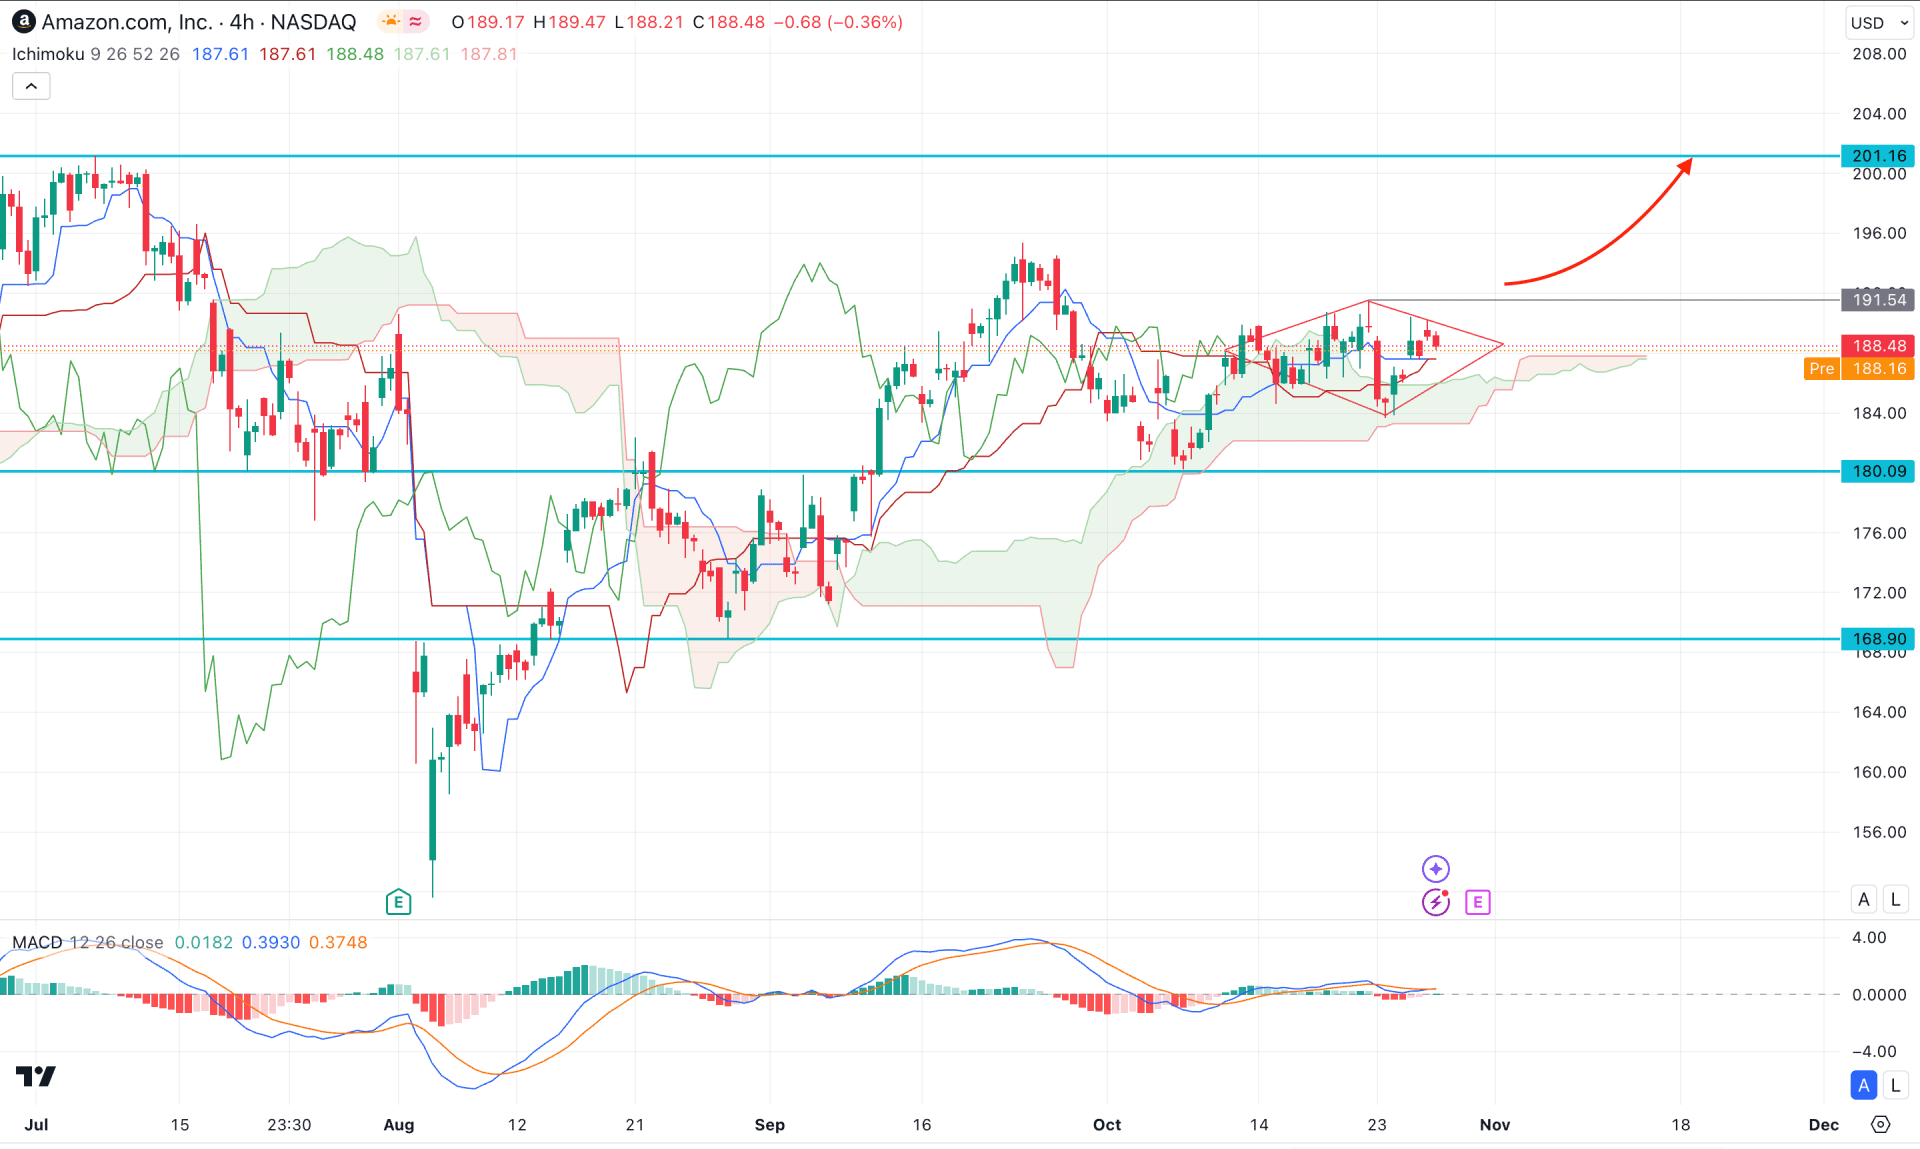
In the H4 timeframe, AMZN is trading within a corrective momentum where the dynamic Ichimoku Cloud is below the current price. Moreover, the Senkou Span A aimed higher and reached the Senkou Span B level, which suggests a potential buying pressure.
In the indicator window, the MACD Histogram is sideways at the neutral line, while the signal line is hovering above it. Moreover, the dynamic Tenkan Sen and Kijun Sen are below the current price and working as near-term support.
Based on the H4 outlook of AMZN, the current sideways market is trading within a Diamond Pattern, from where a bullish breakout could provide a high probable long opportunity.
On the other hand, a bearish cloud break could provide another long opportunity from the 184.00 to 180.00 zone. However, breaking below the 180.00 level with a bearish daily candle might invalidate the current outlook and lower the price in the coming days.

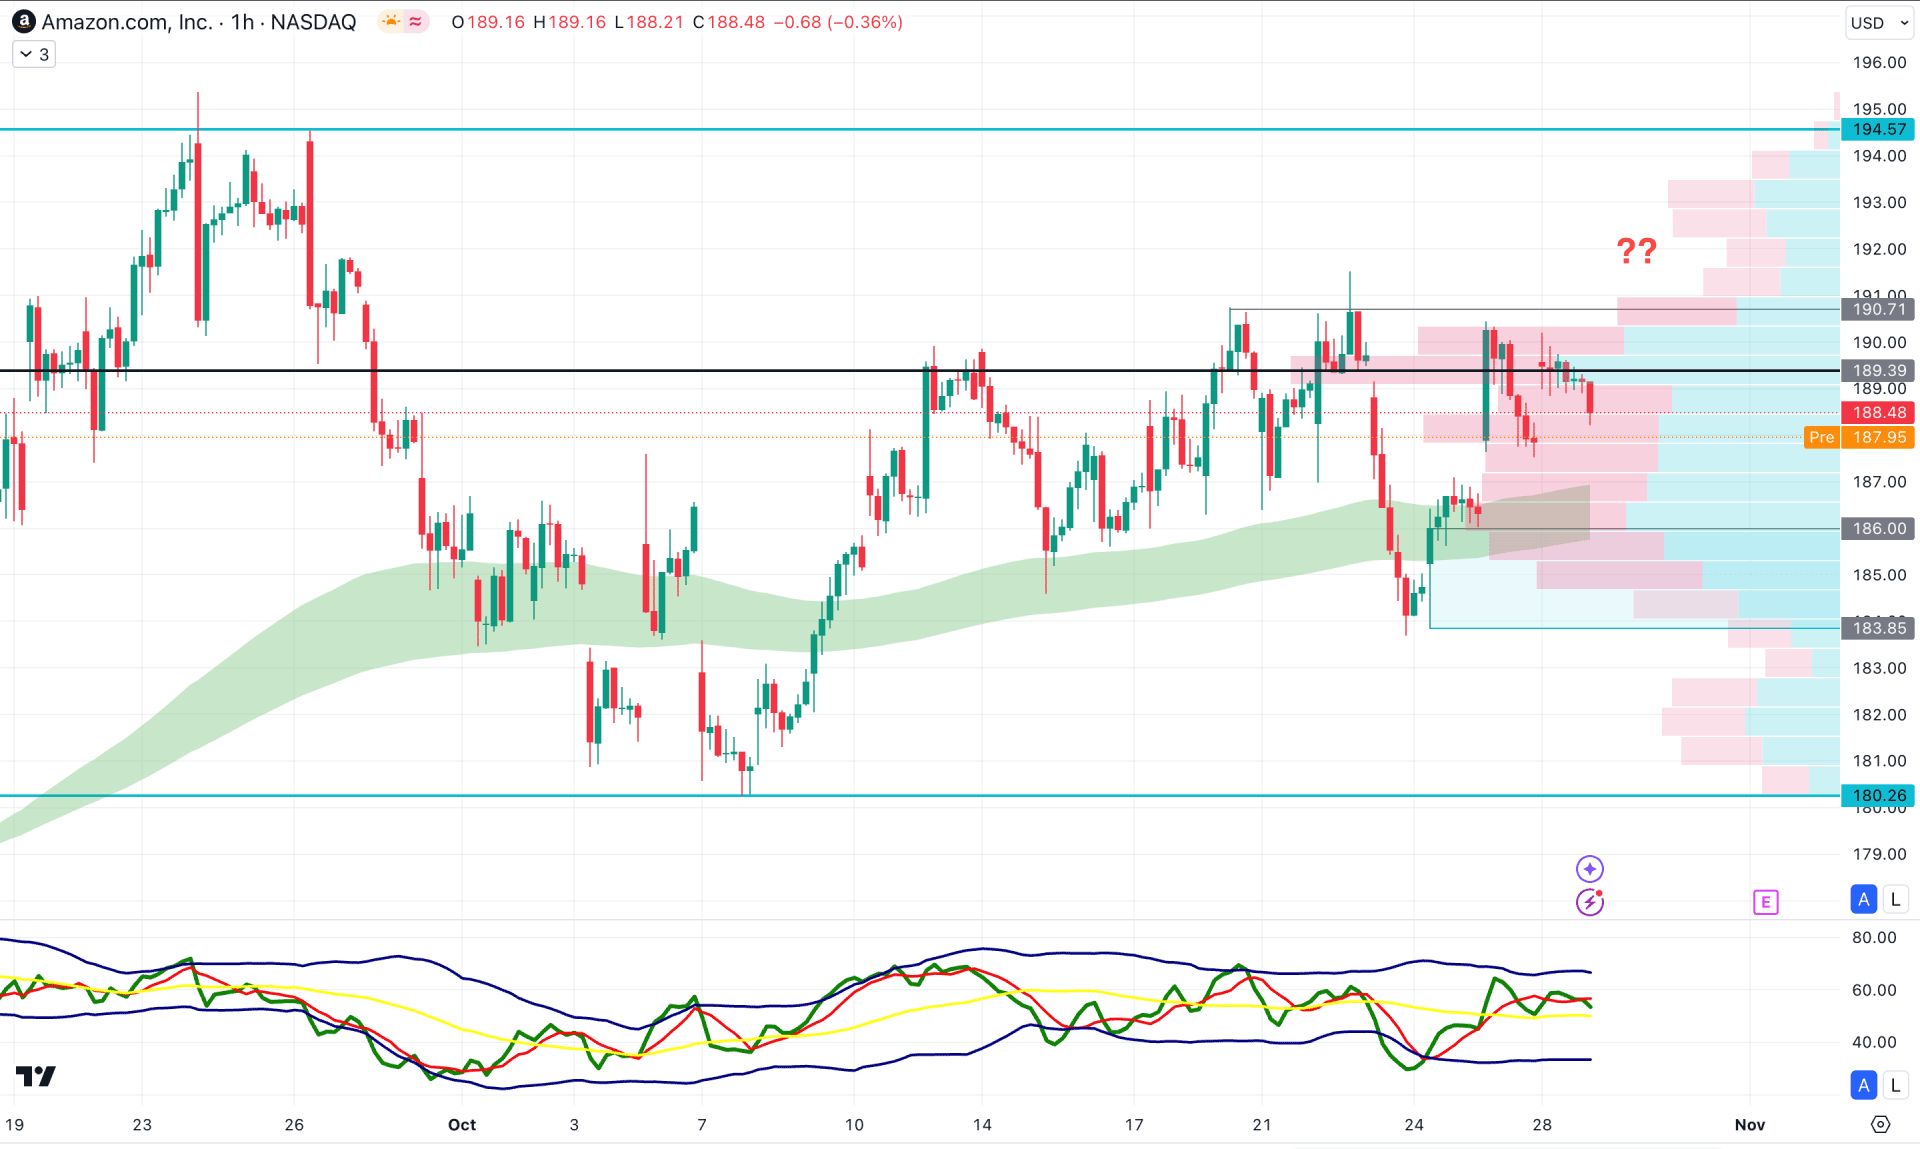
In the H1 timeframe, AMZN is trading within a buying pressure, where a bullish V-shape recovery is visible. The price moved below the 15 October high but rebounded immediately with a counter-impulsive bullish pressure. However, the visible range high volume line is closer to the current price, which signals a potential order building.
In the secondary window, the Traders Dynamic Index (TDI) remains at the midpoint, suggesting a corrective price action.
Based on this outlook, a bullish break with an hourly candle above the 190.71 level could match the long-term market's direction, aiming for the 230.00 area.
However, a deeper discount below the 186.00 to 183.85 imbalance zone could lower the price below the 180.00 area.
Based on the ongoing market outlook, AMZN is more likely to extend the buying pressure, following the major market trend. In that case, a high probability of a long opportunity might come after a valid price action in the intraday chart.