
Published: April 23rd, 2025
This week, Wall Street will be closely watching Alphabet's GOOGL quarterly results. The tech giant is scheduled to announce its first-quarter results on Thursday, April 24.
Alphabet stock has been under increasing antitrust challenges as a push to perhaps split Google's search engine sector has caused market sentiment to decline amid wider economic worries. Additionally, the selloff has been prolonged by monopoly concerns about Alphabet's control in the web advertising business, which has seen a 20% year-to-date decline in GOOGL shares.
Nevertheless, Alphabet's stock is still up +40% over the previous two years, so it's worth considering whether this is a good opportunity to purchase the dip.
If all goes according to plan, Alphabet's Q1 sales would reach $75.53 billion, up 12% from $67.59 billion in the previous quarter. In terms of profitability, Q1 EPS is anticipated to increase by 6% to $2.01 from $1.89 per share in the previous year. With a median profit surprise of 11.57% over the last four quarters, Alphabet has outperformed the consensus estimate for eight straight quarters.
The most alluring aspect of Alphabet shares at present is that, out of the "Magnificent 7" large tech firms, GOOGL has the lowest P/E valuation. At about $150, GOOGL has been trading at a forward P/E multiple of 16.9X, which is much less than the benchmark S&P 500's 19.8X.
Let's see the further aspect of this stock from the GOOGL multi-timeframe analysis:
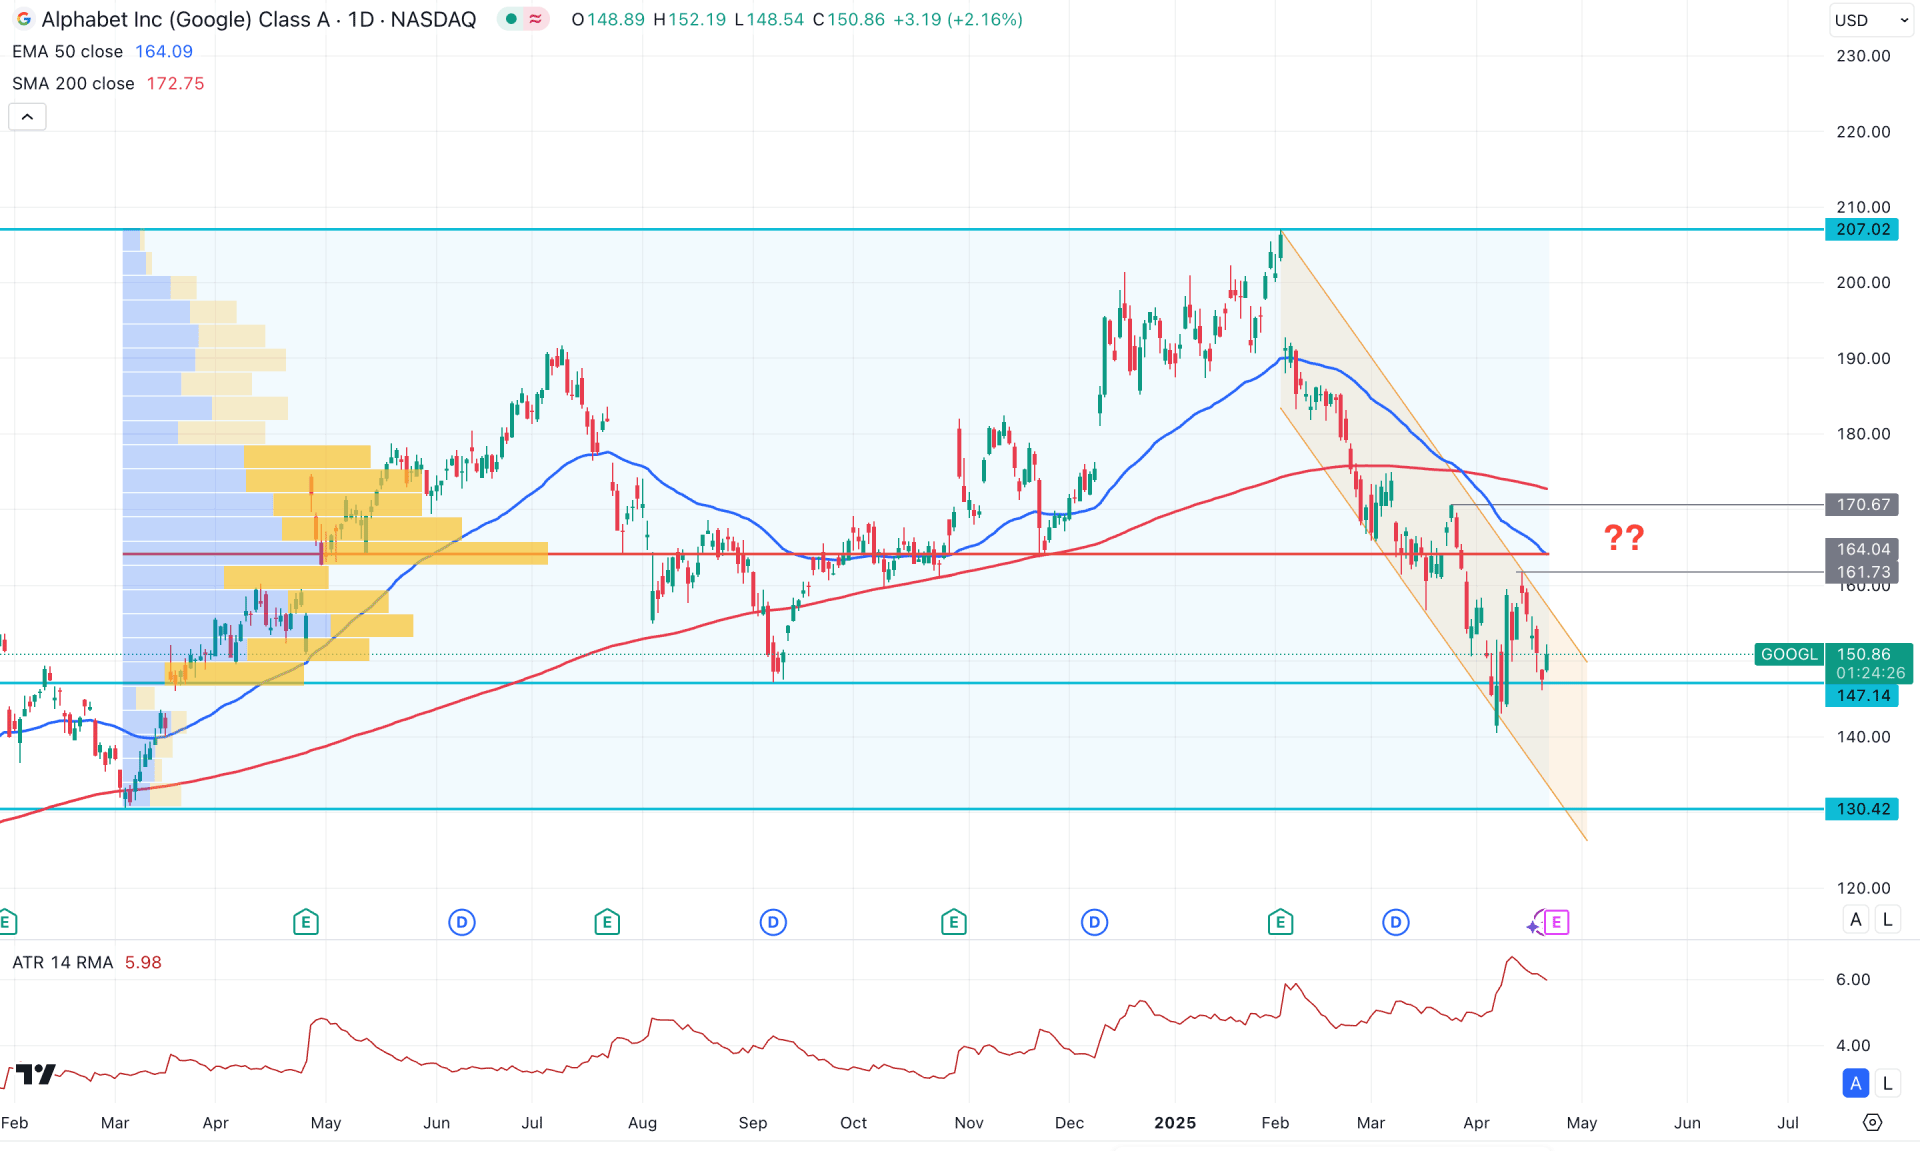
In the daily chart of Alphabet (GOOGL), a minor bearish correction is visible, with the current price hovering near the yearly low. Therefore, the primary outlook for this instrument is a potential trend continuation, provided the bottom is validated.
In the higher time frame, the downside pressure remains intact, as evidenced by three consecutive bearish months. Although a liquidity sweep occurred near the September 2024 low, it is not sufficient to confirm a valid bottom. On the weekly chart, the downside continuation is also valid, with the price trading within a descending channel.
On the other hand, the most active price level since March 2024 is above the current price and is acting as resistance. As long as this high-volume zone stays above the current price, the downside pressure may persist.
On the main price chart, the 200-day SMA is above the current price and trending downward, indicating a bearish long-term trend that could lead to further downside momentum. The medium-term trend aligns with this view, as the 50-day EMA is also above the current price. The crossover between these dynamic lines suggests a death cross formation, which is a key bearish signal.
In the indicator window, the current ATR level reflects a stable trend, as the line has been gradually rising over time. Additionally, the Relative Strength Index (RSI) remains below the 50.00 neutral mark, reinforcing the presence of bearish pressure.
Based on the current market outlook, bearish momentum remains valid for GOOGL, with potential for a range extension that could push the price to a new swing low. In that case, any immediate bearish daily candle below the 144.00 level could present a short opportunity, targeting the 130.42 support level.
Conversely, the 161.73 level is the immediate resistance, from which further selling pressure may emerge. However, a break above the 170.67 swing high could confirm a trend reversal, with potential upside toward the psychological 200.00 level.
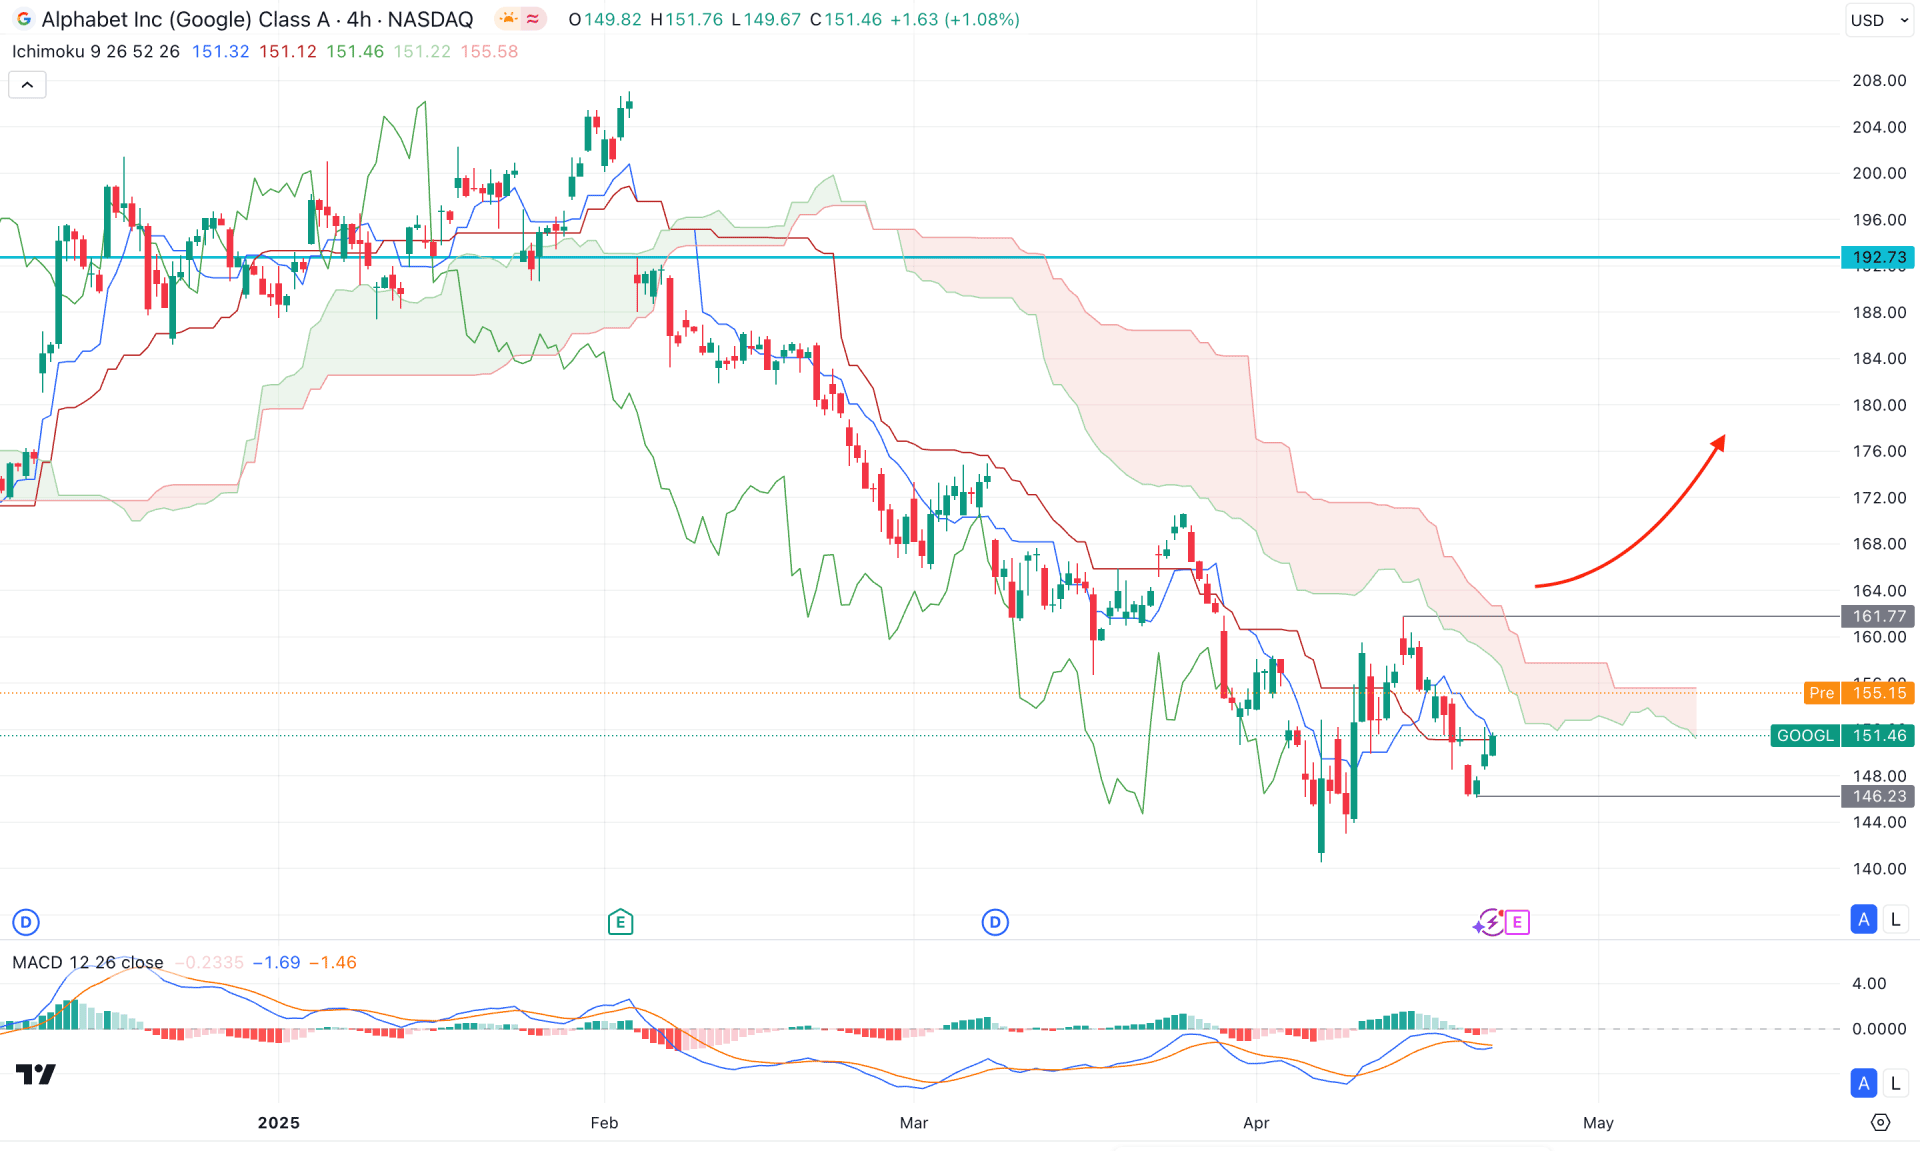
In the H4 timeframe, the recent price is trading bearish as consecutive lower lows are visible below the Ichimoku Cloud zone. Moreover, the Senkou Span A aimed lower below the Senkou Span B, which also signals a possible bearish continuation.
On the other hand, the indicator window shows a different story, where the MACD Histogram remains closer to the neutral point. Moreover, a potential divergence is visible as the signal line failed to form new lows, following the market trend.
Based on the market outlook, the immediate trading opportunity is to look for an H4 candle below the 146.23 level. Following the resistance from the dynamic Kijun Sen line, the price could head lower and form a new swing low below the 140.00 area.
On the other hand, any bullish rebound with a new swing high above the 161.77 level could signal an immediate trend reversal, which needs more confirmation before validating the long signal. A consolidation above the 160.00 level with a range breakout could be a potential long opportunity, aiming for the 192.73 resistance level.
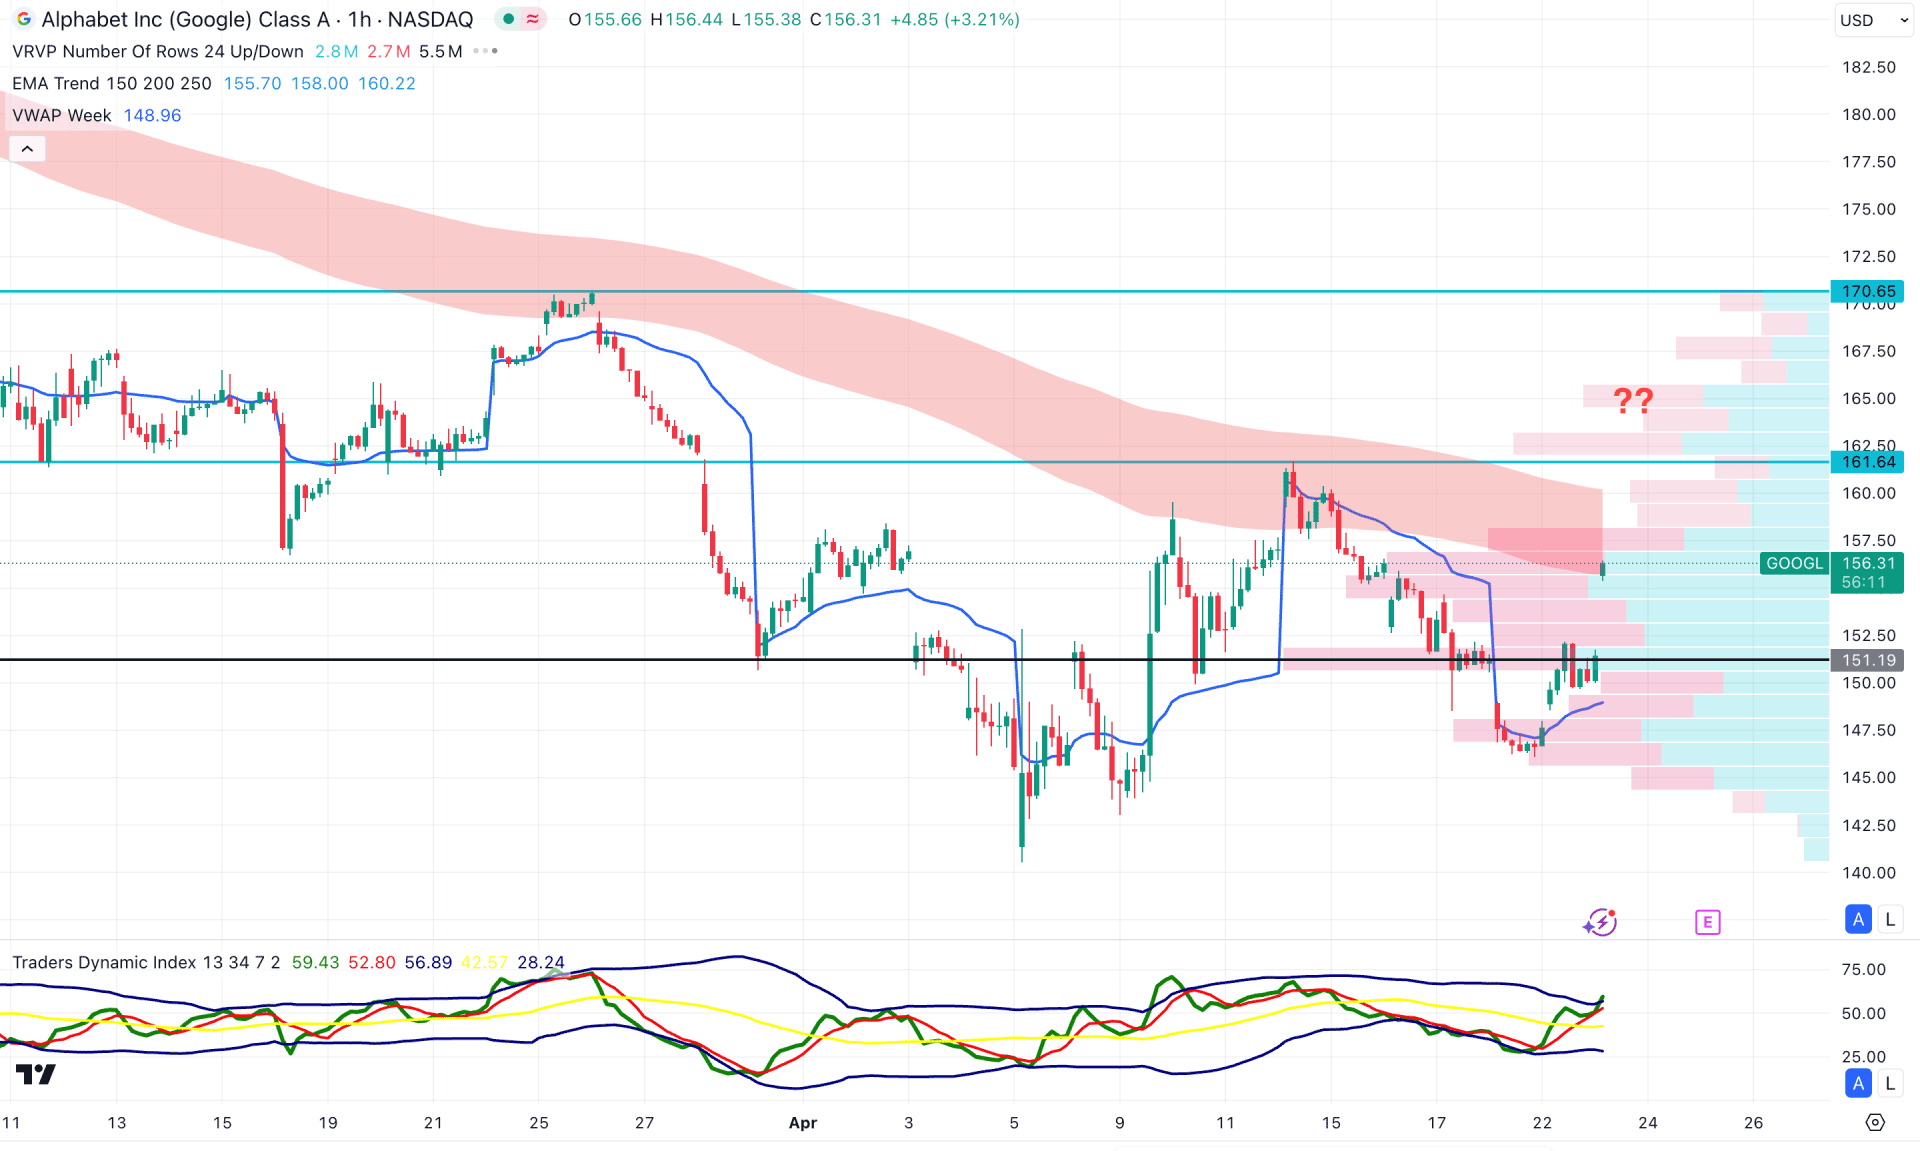
On the hourly time frame, an immediate bullish price action is visible as the current price is trading above the high-volume level. Additionally, the Traders Dynamic Index has flipped its position and formed stable momentum above the 50.00 neutral point. Confirmed buying pressure is also evident from the weekly VWAP level, which is positioned below the current price.
On the other hand, the Moving Everest Wave is located above the current price and is acting as a major barrier for the bulls. In this case, investors should monitor how the price reacts at the current resistance area, as a potential bullish breakout above the 164.00 level could validate the trend reversal.
Conversely, a corrective move with a bearish hourly candle closing below the weekly VWAP level might resume the existing downtrend and open the door to a potential decline toward the 140.00 area.
Based on the current market context, Alphabet stock is trading within a zone of pressure where a minor upward correction could present a potential short opportunity. However, the price remains within a descending channel on the daily chart, where a bullish breakout could reverse the market trend at any time.


