

Published: July 22nd, 2026
Google's parent firm, Alphabet (GOOGL), will release its second-quarter earnings this week and investors are keen to know the outcome. Revenue is expected to reach about $116.8 billion, increasing roughly 21% from the previous year, according to consensus projections.
Last quarter, Google Cloud grew at the quickest rate among major cloud providers, growing 63% year over year. The company's overall revenue increased by 22% to $109.8 billion. The Net income increased as well, but a large portion of that growth was driven by unrealised gains on Alphabet's investments in businesses like SpaceX.
Alphabet plans to spend between $180 billion and $190 billion on capital projects in 2026. It uses that sum to create data facilities and AI processors, but investor patience has been put to the test.
The bull argument is strengthened by Cloud's over $460 billion order backlog, which indicates years of future income already booked.
Alphabet's biggest business is still search advertising, and investors want confidence that traditional ad revenue isn't being undermined by AI-generated search summaries.
Strong sales alone won't be sufficient today since the market wants evidence that Alphabet's artificial intelligence bet is generating long-term profit, not just higher bills.
Let's see the further outlook from the GOOGL price analysis:
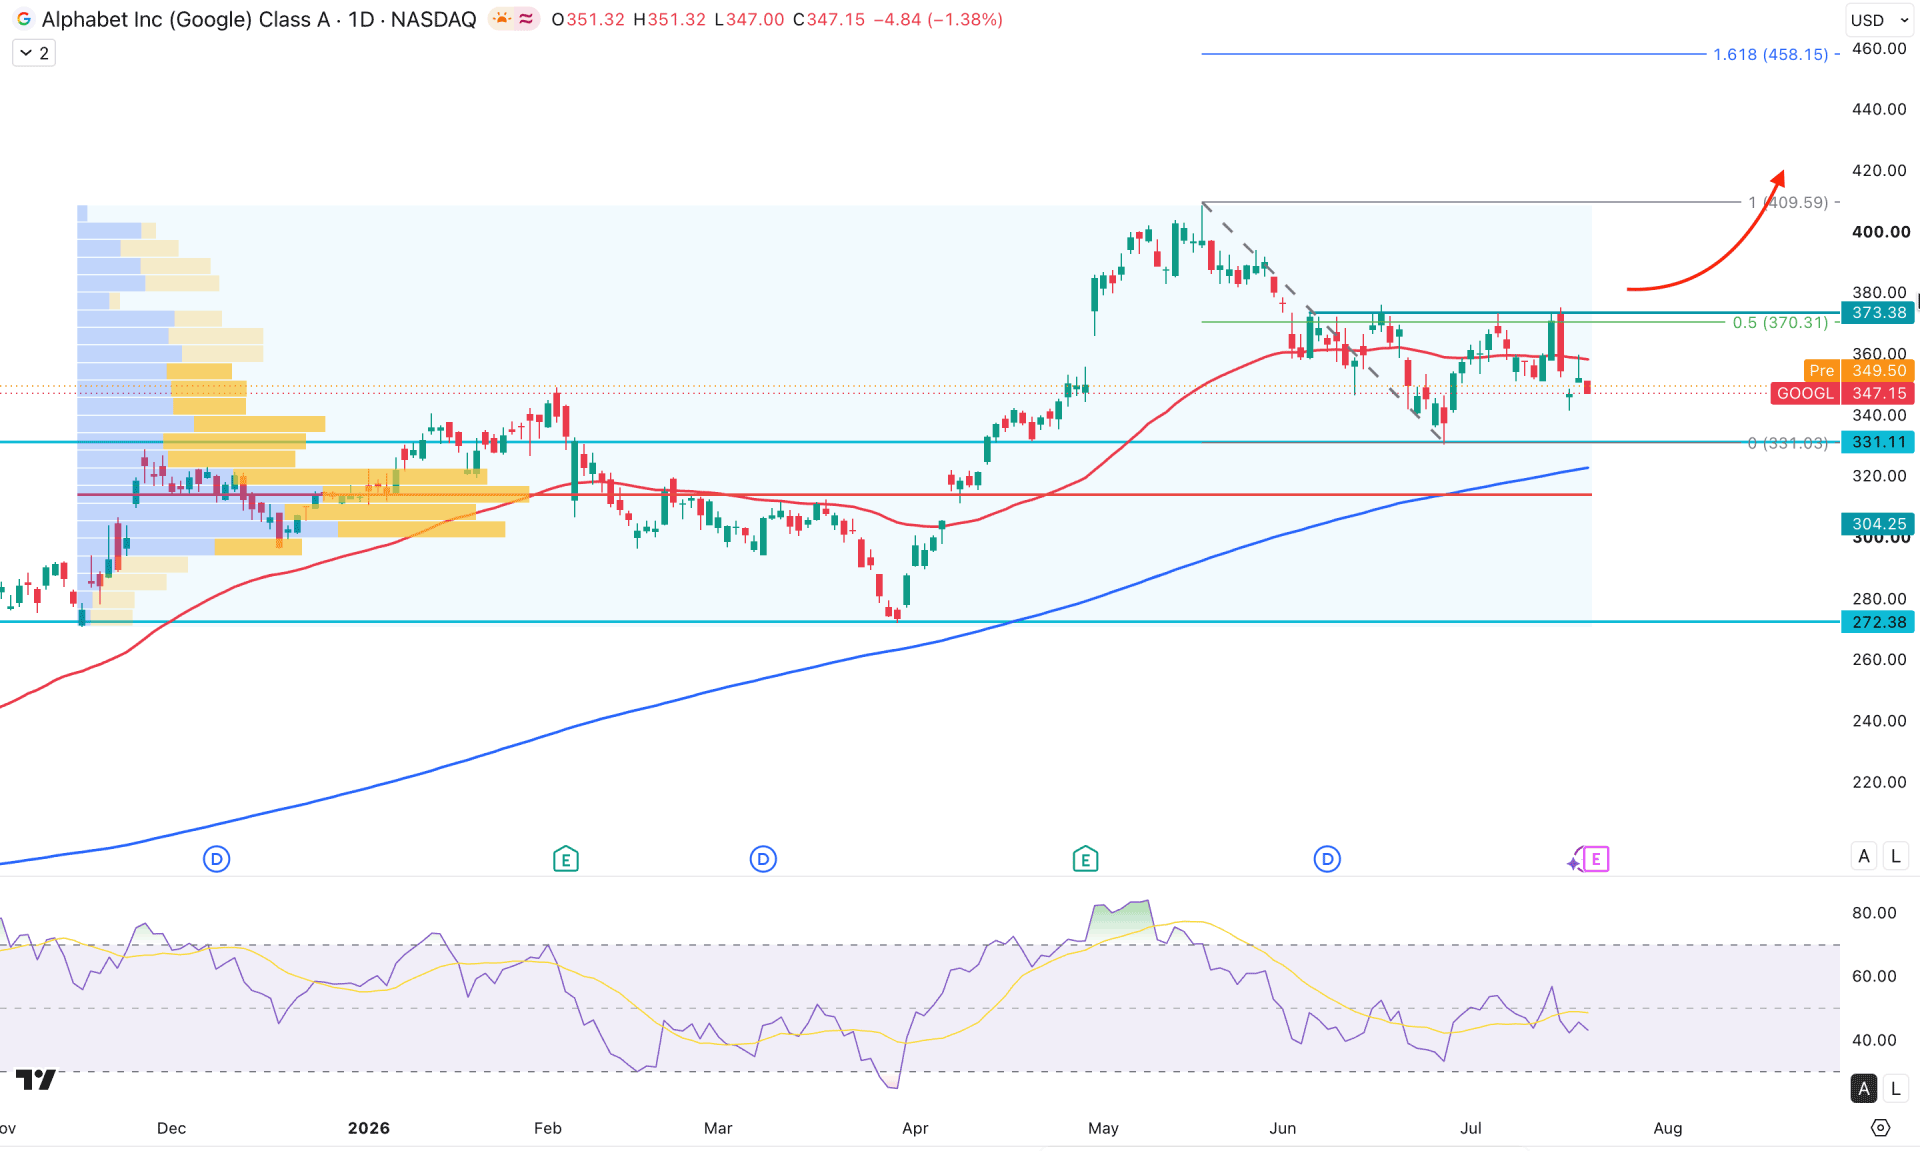
In the daily chart of Alphabet stock, an ongoing bullish momentum is visible, and the most recent price is trading sideways after creating a new all-time high. A potential ranging market is visible, from where a valid confirmation is needed before anticipating a bullish trend continuation.
Looking at the higher timeframe, the monthly candle suggests a corrective downside pressure, as three consecutive bearish months are visible, followed by a strong bullish body formed in April 2026. The downside pressure from the existing swing high is insignificant, validating the strength of the reversal. However, the price is currently trading at a crucial premium zone, from where anticipating more bullish waves could be challenging.
The weekly timeframe suggests a consolidation after a bearish wave, from where a validation is pending before anticipating a downside drop formation. Moreover, the high level area since November 2025 is marked below the existing swing low, suggesting a strong support level. As the price keeps approaching the support area, bulls might be interested in continuing the existing bullish momentum.
In the daily timeframe, a sideways market is visible for the 50-day EMA, which is closer to the current price and remains flat. Although the 200 SMA is showing bullish traction from the high-volume area, the medium-term trend needs proper validation to anticipate a bullish continuation.
In the Relative Strength Index, the current line is sideways below the 50.00 neutral level, from where a recovery above the midline is needed before reaching the 70.00 overbought area.
Based on the overall market structure, the corrective market momentum is clear, while the entire structure remains bullish. As the price remains sideways below the 50 EMA, more downside pressure is possible. A valid rebound with sufficient liquidity grab from the 331.11 level could be a potential long opportunity, targeting the 400.00 psychological level. Moreover, an immediate bullish rebound with a recovery of the 373.38 resistance level could offer an immediate long opportunity.
On the bearish side, the ongoing short-term downside pressure is visible, as the current price is below the 15 EMA. In that case, the price is likely to test the 331.11 support level. Moreover, a failure to hold buying pressure at the near-term support area could increase the possibility of moving below the 304.25 high-volume level and testing the 272.38 support area.
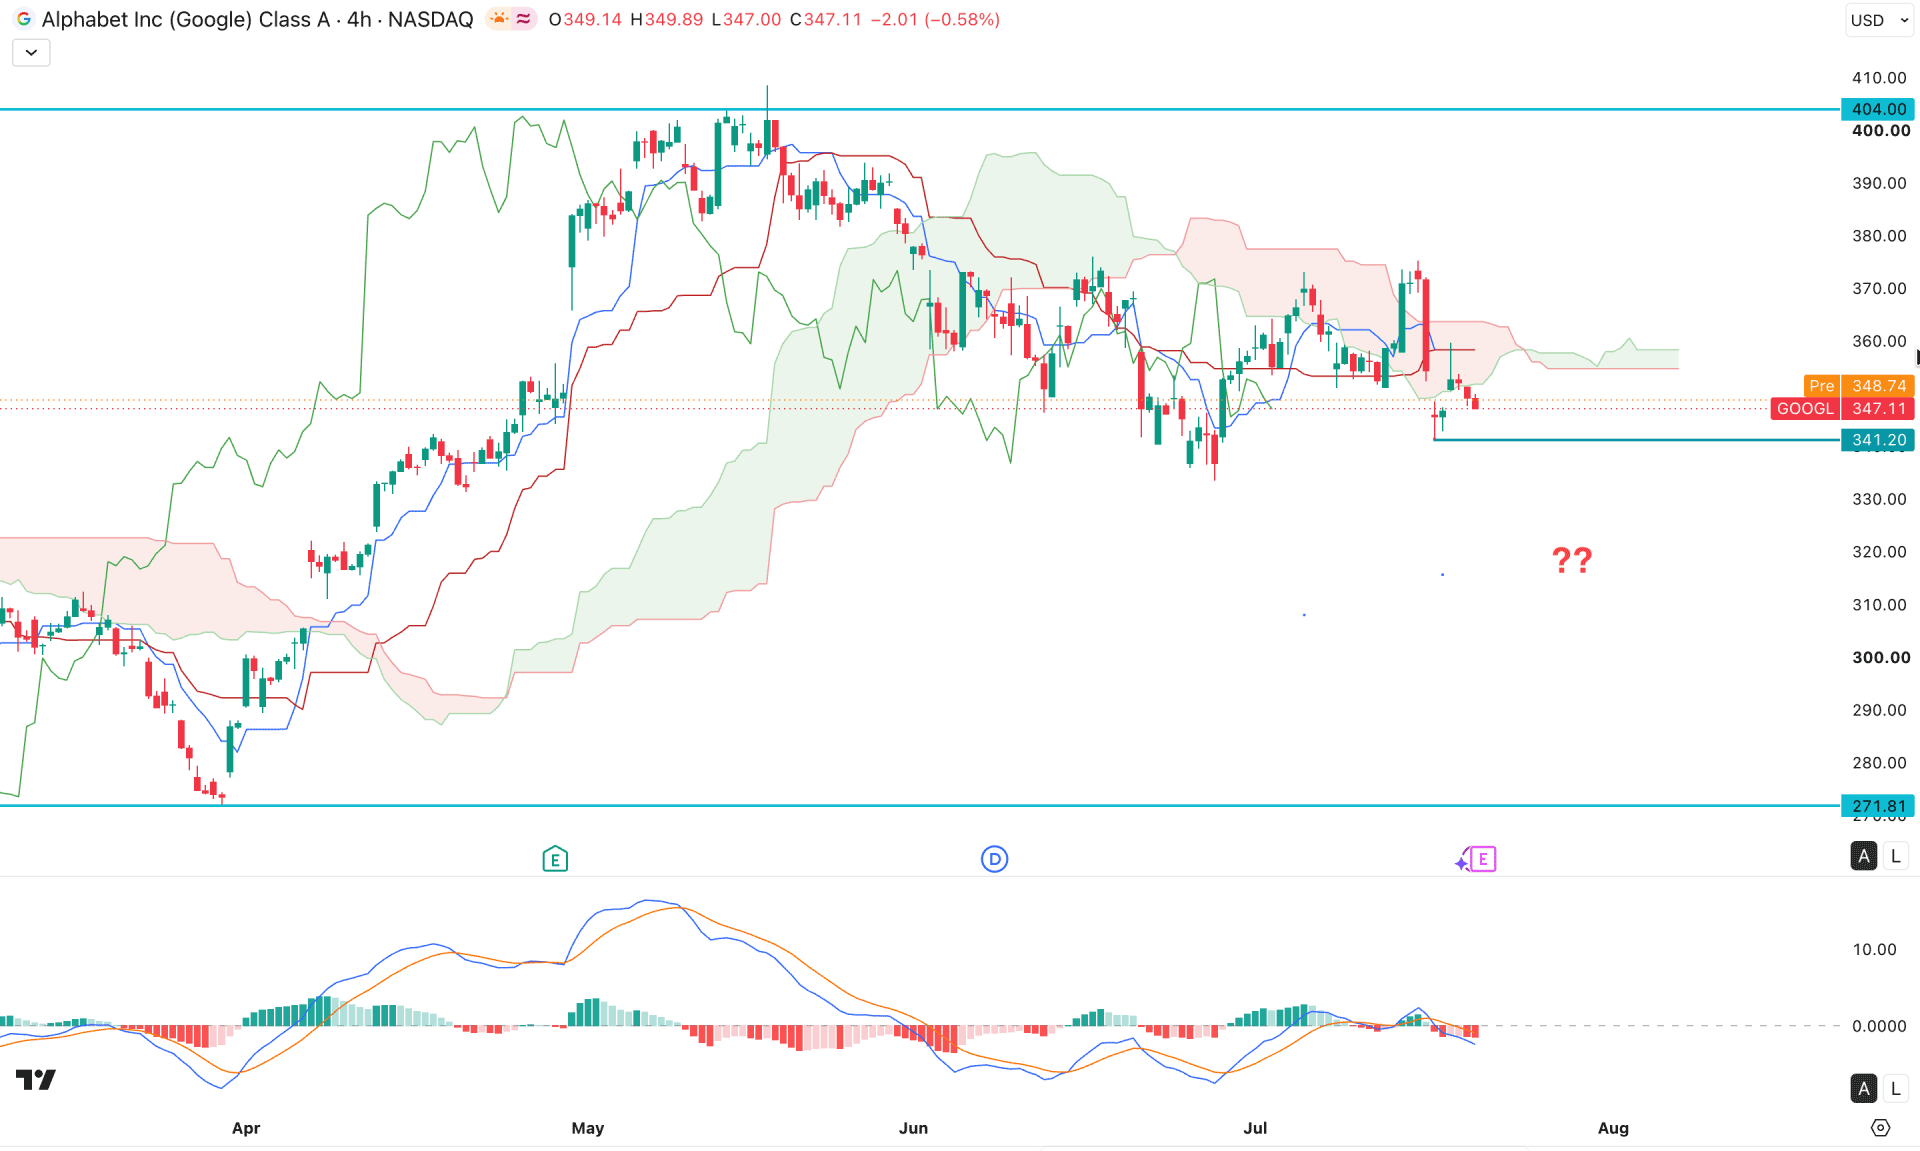
In the four-hour timeframe, the Alphabet stock is below the Ichimoku cloud area. The recent price shows a false bullish break, grabbing the buy-side liquidity. Although the future cloud is bullish, the recent price is trading below the cloud resistance, and dynamic lines are above the current price.
In the indicator window, the MACD signal line is below the neutral level, following the same momentum as the histogram. Although the signal line has not reached the oversold area, it signals more space to extend the downside correction.
Based on this structure, the ongoing momentum is bearish, where the 341.20 level is a crucial support line to watch. A break below this line could extend the bearish pressure, and the price could reach the 300.00 psychological level.
On the other hand, a bullish rebound with a valid recovery above the cloud resistance is needed before invalidating the bearish possibility. In that case, creating a new swing high above the 380.00 area could be the first sign of a bullish reversal.
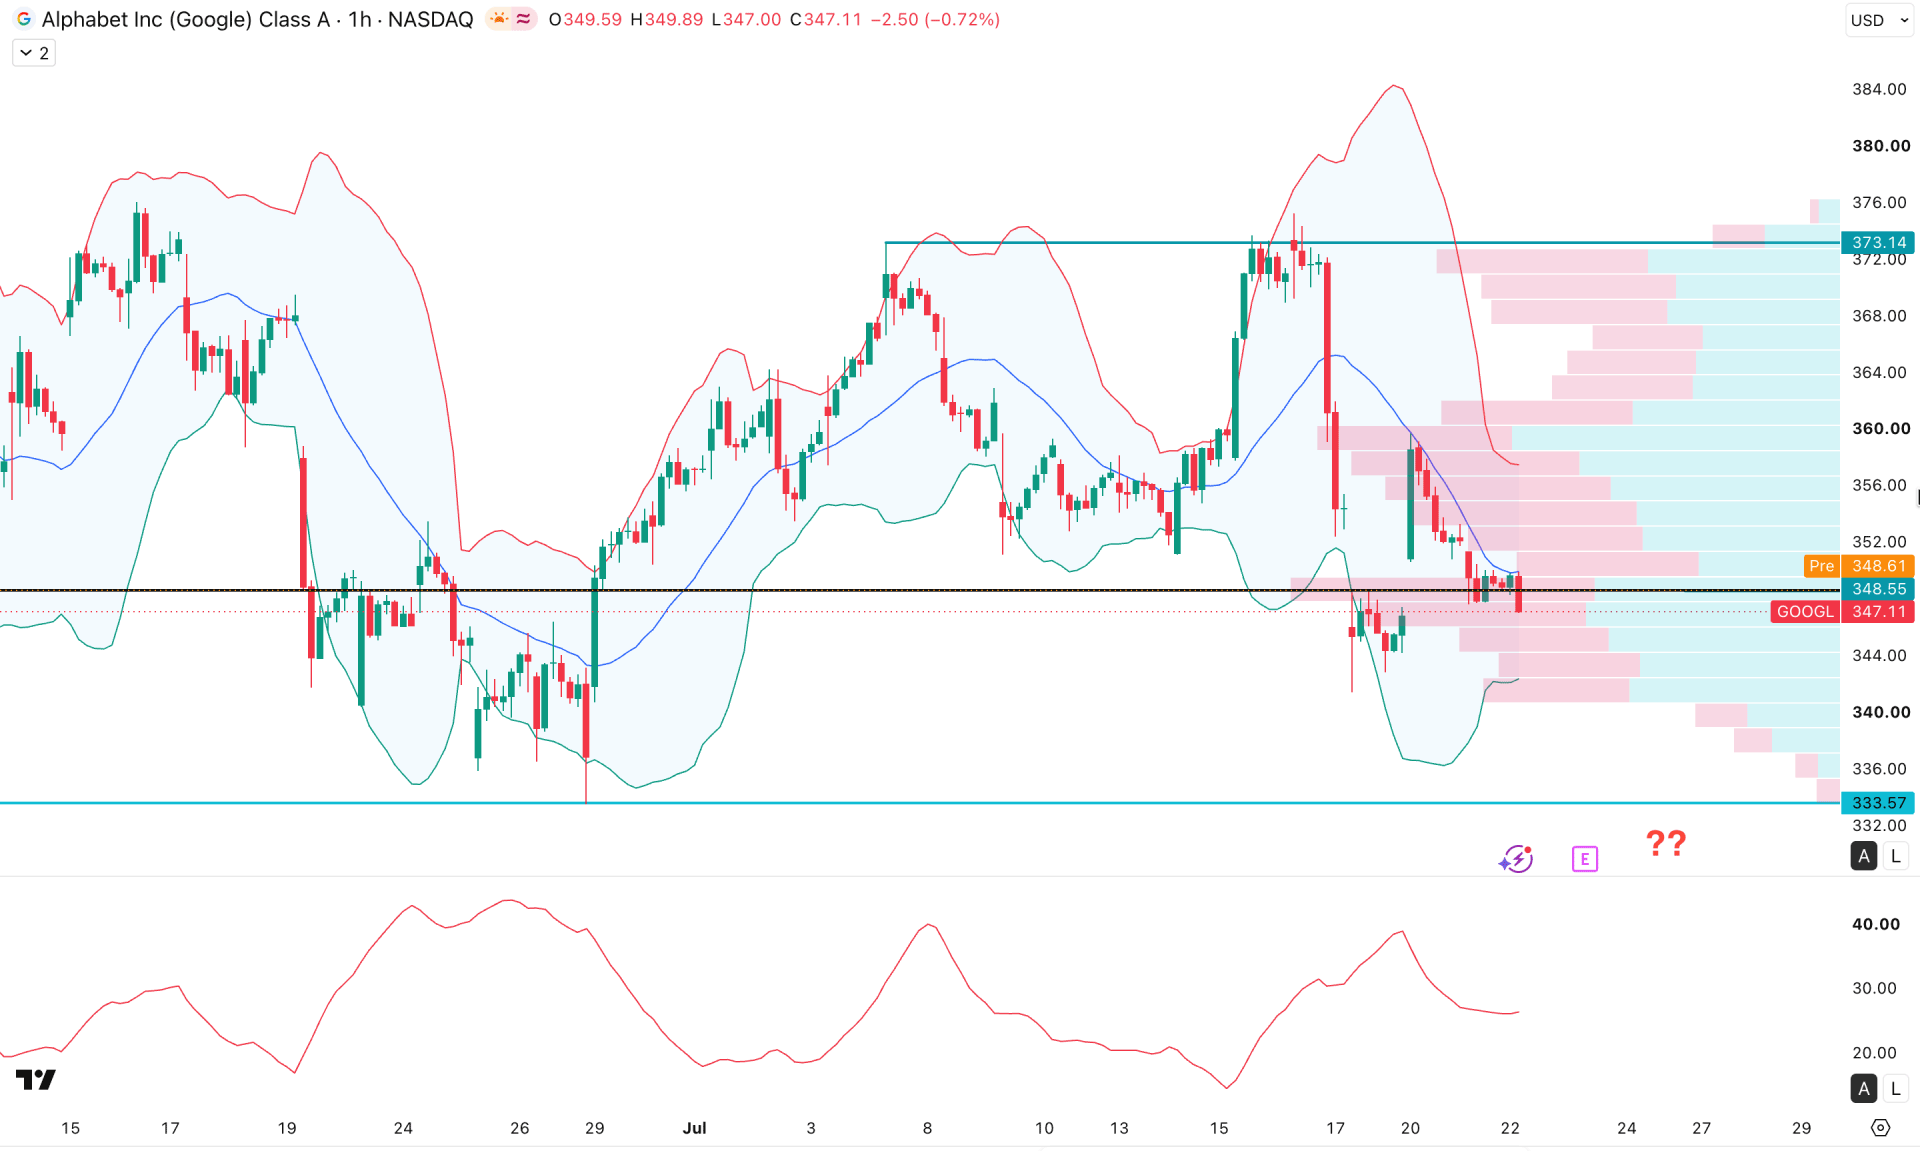
In the hourly timeframe, the current price is trading sideways after sweeping liquidity from the 373.14 high. Moreover, the high volume line is closer to the current price, signaling increased trading volume.
Multiple hourly candles are present below the mid Bollinger Bands line, while the lower Bollinger Band line is showing a bullish rebound from the bottom. Moreover, the Average Directional Index became flat after tapping the 40.00 area. Still, the current line is above the 20.00 satisfactory level, signaling a trend formation.
Based on this outlook, the price is likely to extend downside pressure, as the primary barrier is present at the lower Bollinger Band line. Below this level, the ultimate support level is at 333.57, which could be tested before forming a bullish rebound.
On the bullish side, recovery above the mid Bollinger Band line is possible, which could open the room for moving beyond the 380.00 level.
Based on the entire market structure, Alphabet stock is trading within a corrective zone higher. The overall market momentum remains bullish. Investors should closely monitor how the price trades below the existing daily resistance level. As the price has tested the line multiple times, a possible recovery with a daily close above it could validate the long-term trend continuation.


