Published: February 7th, 2024
From the year's onset, seasoned investors touted Alphabet as the crème de la crème of stocks due to the market sentiment. With an impressive year-to-date surge, Google has effortlessly surpassed the S&P 500's modest gains, offering investors a tantalizing glimpse of success.
Its revenue, a staggering $297 billion over the past decade, is a testament to its unwavering dominance in the digital realm. Google's revenue growth isn't merely a facade, with an operating profit margin hovering at a robust 26.51%.
Moreover, with a cash hoard nearing $120 billion, Alphabet is a bastion of financial fortitude, capable of weathering storms and seizing opportunities with equal aplomb. Whether through prudent investments or strategic buybacks, Alphabet's treasure trove of cash serves as a beacon of stability in an ever-changing market.
At a forward price-to-earnings ratio of 19.65, Alphabet represents not just a bargain but a beacon of potential in a sea of uncertainty. Its competitive advantage and unwavering growth trajectory portray a company poised for greatness.
As the investment landscape continues to evolve, Alphabet stands as a steadfast beacon of opportunity, beckoning investors with the promise of prosperity. While past performance may not guarantee future success, Alphabet's relentless march toward greatness is a testament to the enduring power of informed investment decisions.
Let’s see the upcoming price direction of this stock from the GOOG technical analysis:
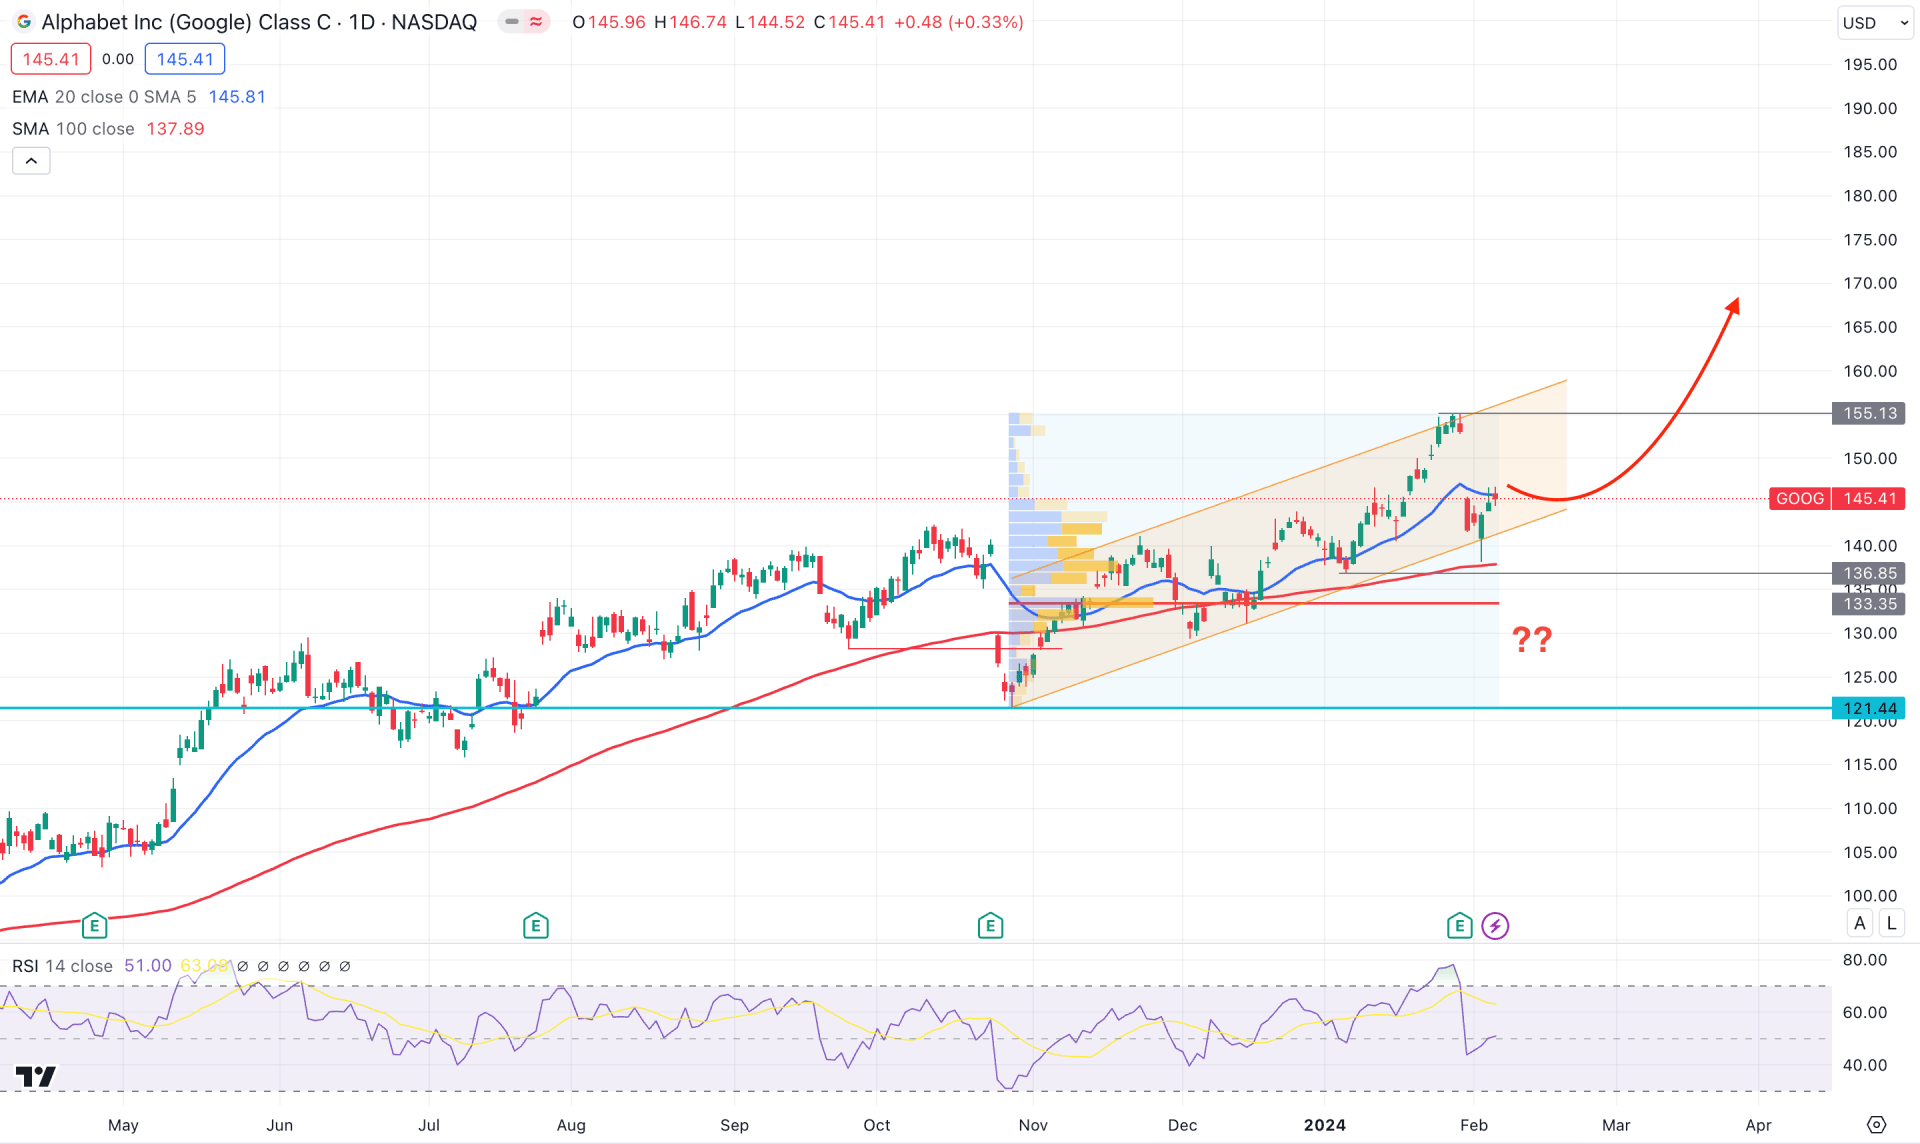
In the daily chart of GOOG, the overall market trend is bullish. Moreover, a stable momentum is visible above the critical dynamic line, which could offer a trend trading opportunity.
Since the beginning of 2023, this stock has shown an impressive return of 43%, higher than the S&P 500’s 30% gain. As the recent price remains at a historic high level, investors need sufficient clues before anticipating a long movement.
In the higher timeframe, the January close came as a Shooting Star, sweeping the liquidity from the February 2022 high, which was at 152.14. However, it is too early to anticipate a bearish leg as the ongoing ascending channel support is still protected.
In the volume structure, no significant high-volume activity is seen at the all-time high area, where the most active level since November 2023 has been at 133.40. As the current price still trades above the high volume line, investors might expect a bullish continuation at any time.
In the main price, the 100-day SMA is the major support at the channel low, while the current price hovers at the 20-day EMA level. Meanwhile, the RSI formed a strong rebound from the 70.00 overbought level and moved below the neutral 50.00 line.
Based on the daily market structure, a long-term view is bullish, and a rebound is possible above the current all-time high level. In that case, the 100-day SMA would be a major support, and the bull case is valid as long as the price trades above it.
On the bearish side, an ascending channel breakout with a weekly close below the 136.85 static support could lower the price toward the 121.44 level.
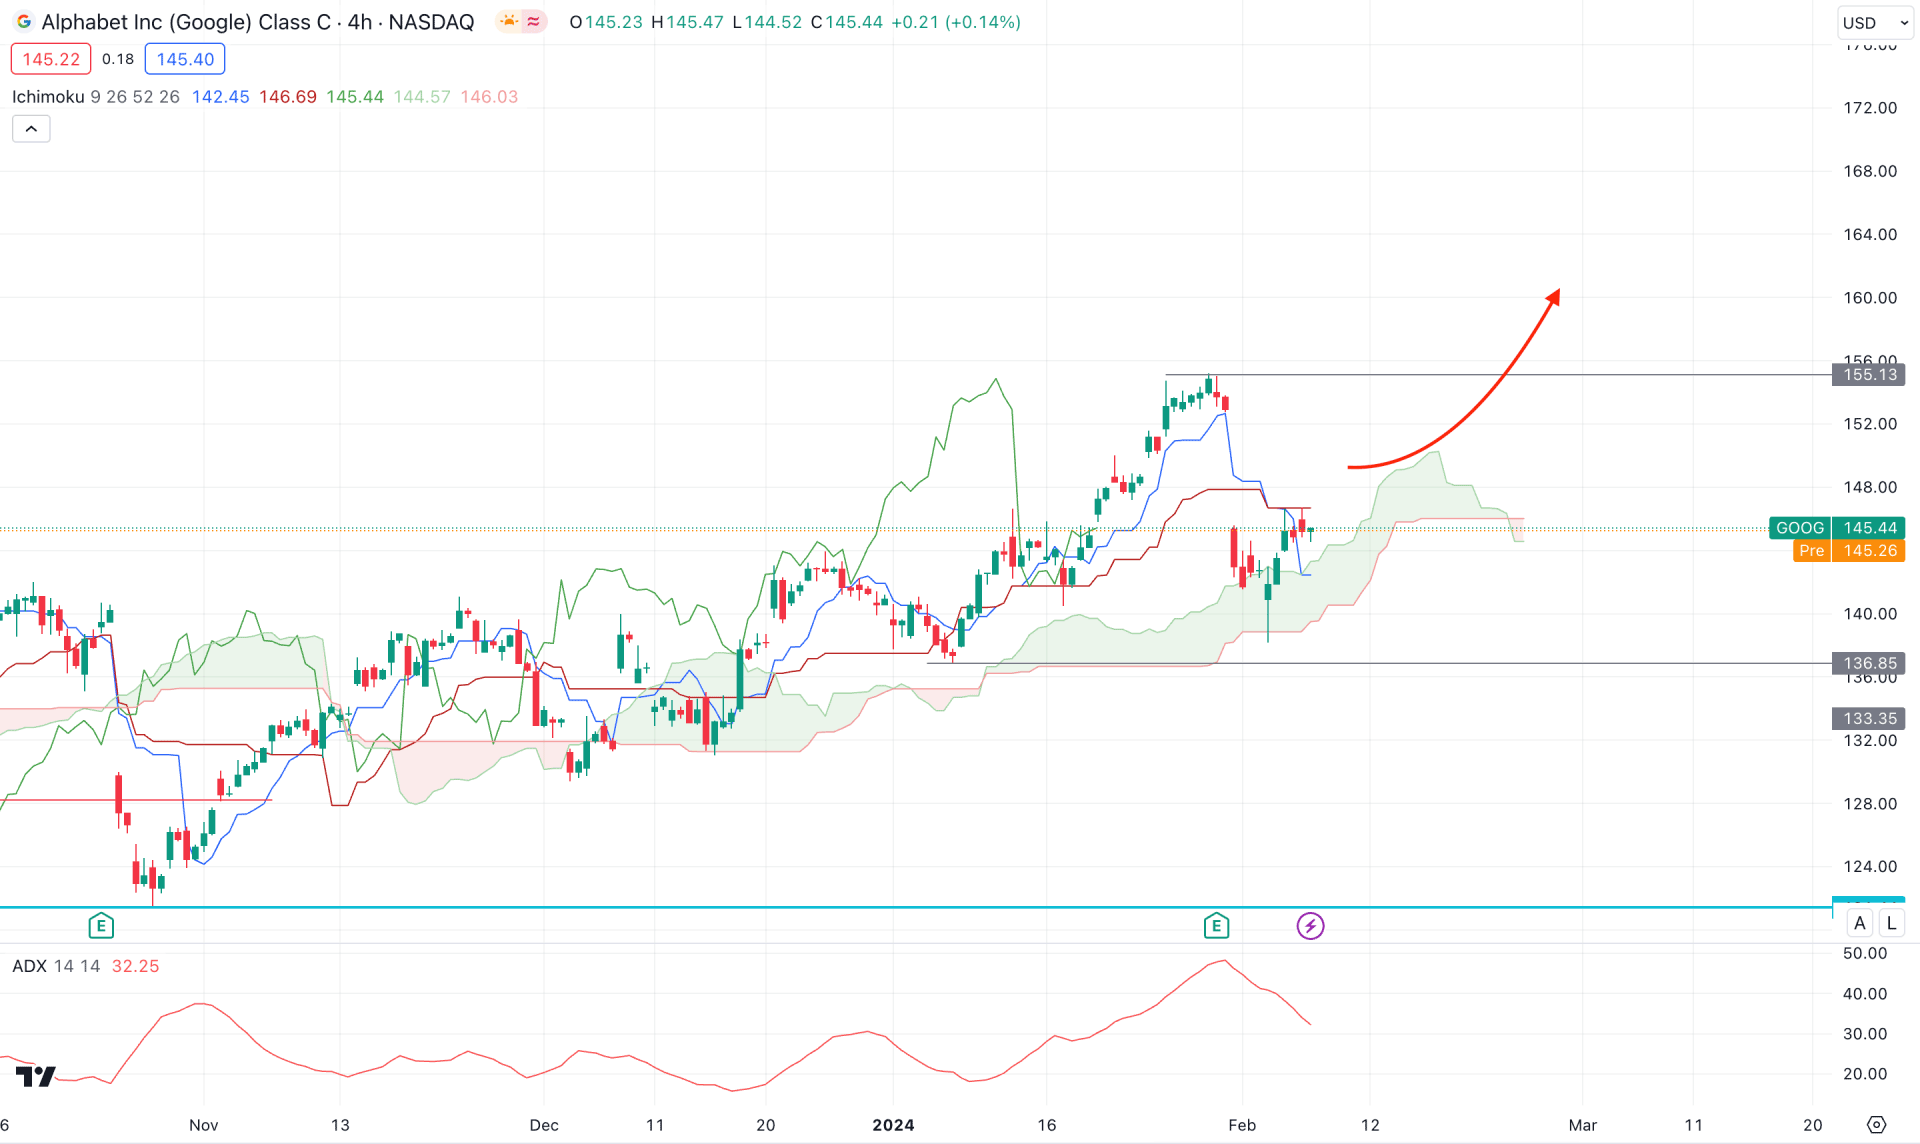
In the H4 chart, the Ichimoku Cloud zone is below the current price, working as near-term support. However, the recent price shows a corrective momentum as it trades below the Dynamic Kijun Sen level, while a bearish crossover is visible in the future cloud.
In the indicator window, the Average Directional Index (ADX) peaked at the 50.00 line and showed a recovery. However, a rebound from the 20.00 area could indicate a bullish signal in the main chart.
Based on this outlook, a strong bullish recovery above the Kijun Sen support could resume the existing trend, targeting the 165.00 psychological level.
On the bearish side, a bearish cloud breakout could indicate the primary signal of a selling pressure, where consolidation below the 136.85 level could validate the bearish possibility.
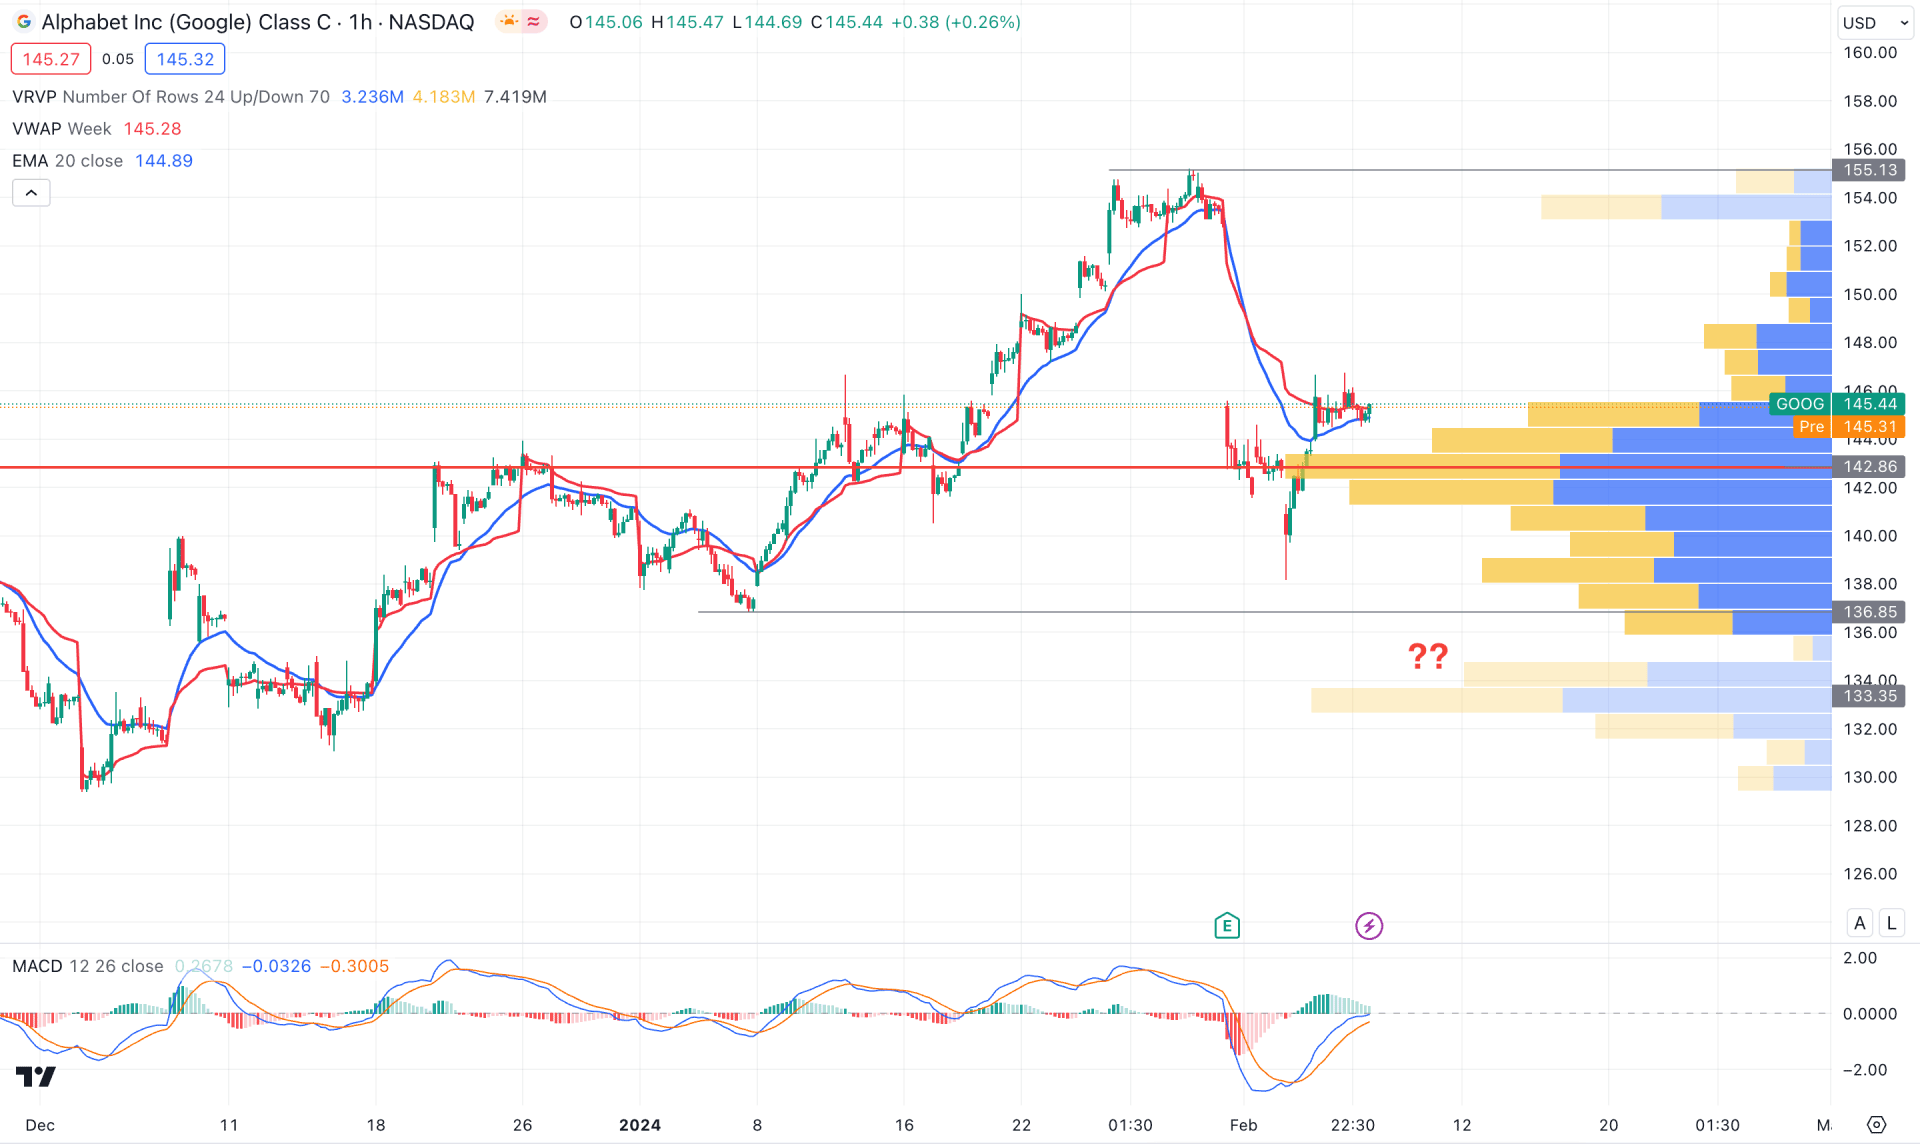
The hourly chart shows steep selling pressure from the 155.13 high after the release of the quarterly earnings report. However, the downside momentum is limited as the current price remains above the visible range high volume level.
The dynamic 20-hour EMA and weekly VWAP are closer to the price, suggesting a corrective market pressure. The indicator window shows a bullish recovery, as the MACD Signal line showed a crossover at the bottom.
Based on this outlook, the recent upward pressure from the 138.17 low with an hourly candle above the dynamic 20 EMA could be a long opportunity in this stock.
On the bearish side, the 126.85 level would be a major barrier, as an H4 candle below this line could be a short opportunity to target the 128.00 level.
Based on the current multi-timeframe analysis, Alphabet Stock (GOOG) has a higher possibility of continuing the bullish trend. In that case, a high probable long opportunity might come once the price overtake the Kijun Sen level in the H4 timeframe.


