
Published: May 2nd, 2023
Last week, Alphabet (GOOG, GOOGL) reported its first-quarter earnings that exceeded revenue and profit expectations with an authorized $70 billion stock repurchase program.
Despite a decline in the digital advertising industry, the parent company of Google and YouTube reported higher-than-expected revenues in its advertising divisions. After several difficult quarters, YouTube's ad revenue surpassed expectations, reaching $6.69 billion, exceeding expectations.
In addition, Alphabet's Google Cloud business segment attained profitability for the first time, with revenue growth of 28%, the highest among the company's primary business segments.
The company disclosed several charges associated with its cost-cutting initiatives, including $2.6 billion for cutbacks and office space reductions.
Alphabet has been reducing costs aggressively this year, with 12,000 job cuts announced in January. Moreover, with its AI chatbot, Bard, Google has been at the forefront of the AI competition. In order to adapt its AI strategy to its evolving business model, Alphabet is integrating two AI teams, and the transition was reflected in Tuesday's results.
During the first quarter, Alphabet's AI initiatives incurred a total loss of $3,3 billion, while its Other Bets segment posted a loss of $1,231 million. Operating income for the quarter was $17.4 billion for Alphabet.
Let’s see the upcoming price direction of Alphabet Inc (GOOG) from the technical analysis:
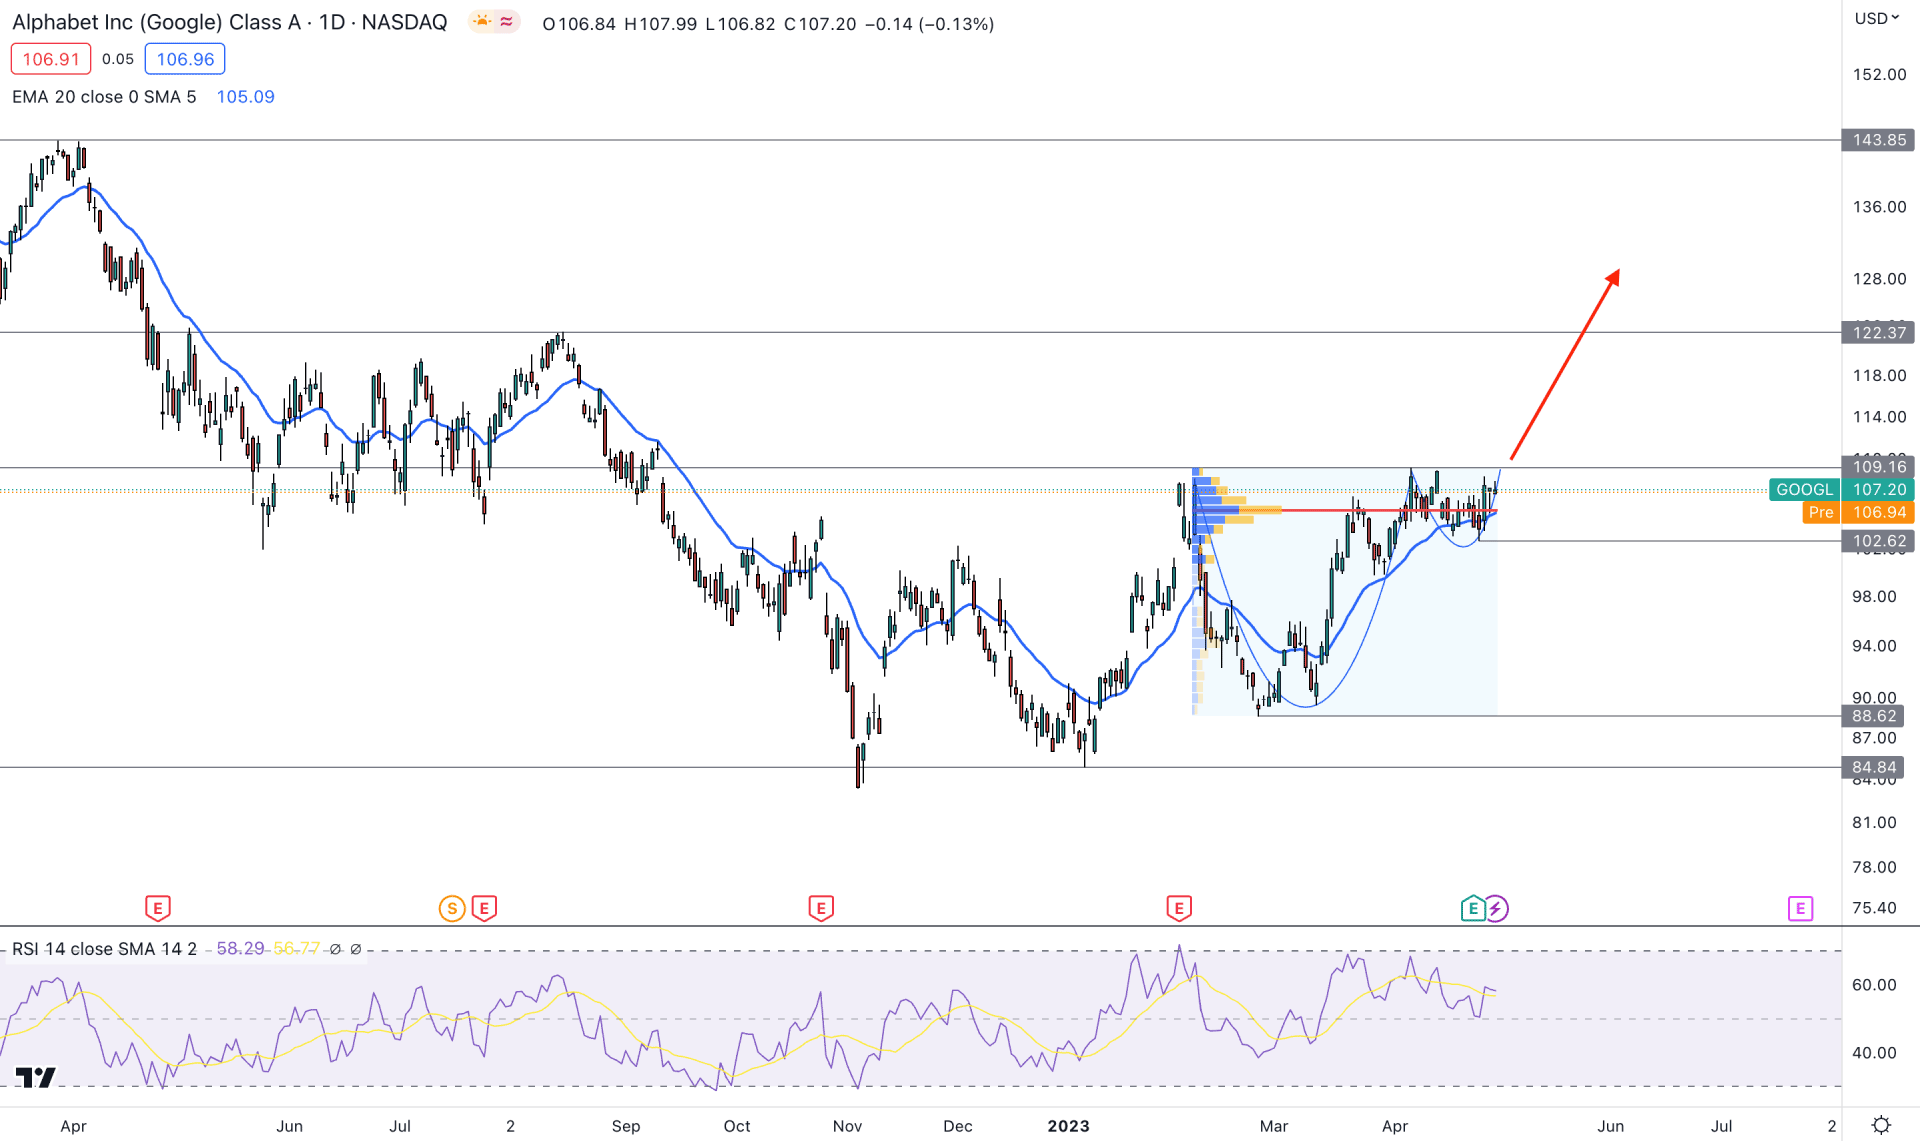
In the daily chart, Alphabet Inc stock (GOOG, GOOGL) formed a strong bullish possibility as the current price trading within a bullish Cup & Handle pattern. It is a potential breakout pattern, which results in an impulsive bullish trend after a solid breakout.
The buying pressure was initiated at the beginning of 2023, when February and March provided a strong bullish range breakout in the monthly time frame. As a result, the trading approach in this stock is to look for long opportunities to match the higher timeframe’s direction, supported by the fundamental outlook.
In the daily chart, the latest high volume level since 8 February is spotted below the current price, which is working as an immediate support level. Therefore, as long as the price trades above this high volume level, bulls could extend the momentum in the coming days.
The dynamic 20 Exponential Moving Average in the main price chart is below the price and provides minor support. Meanwhile, the current RSI is sideways but within a descending channel.
Based on the daily outlook of GOOG, the broader market context is bullish, and a daily candle above the 109.10 level would validate the bullish Cup & Handle pattern breakout. In that case, the primary would be to open a long trade, targeting the 122.37 resistance level.
On the other hand, the alternative approach is to seek short opportunities if a bearish daily candle comes below the 102.62 support level. It will open a downside possibility, where the ultimate aim is to test the 88.62 support level.
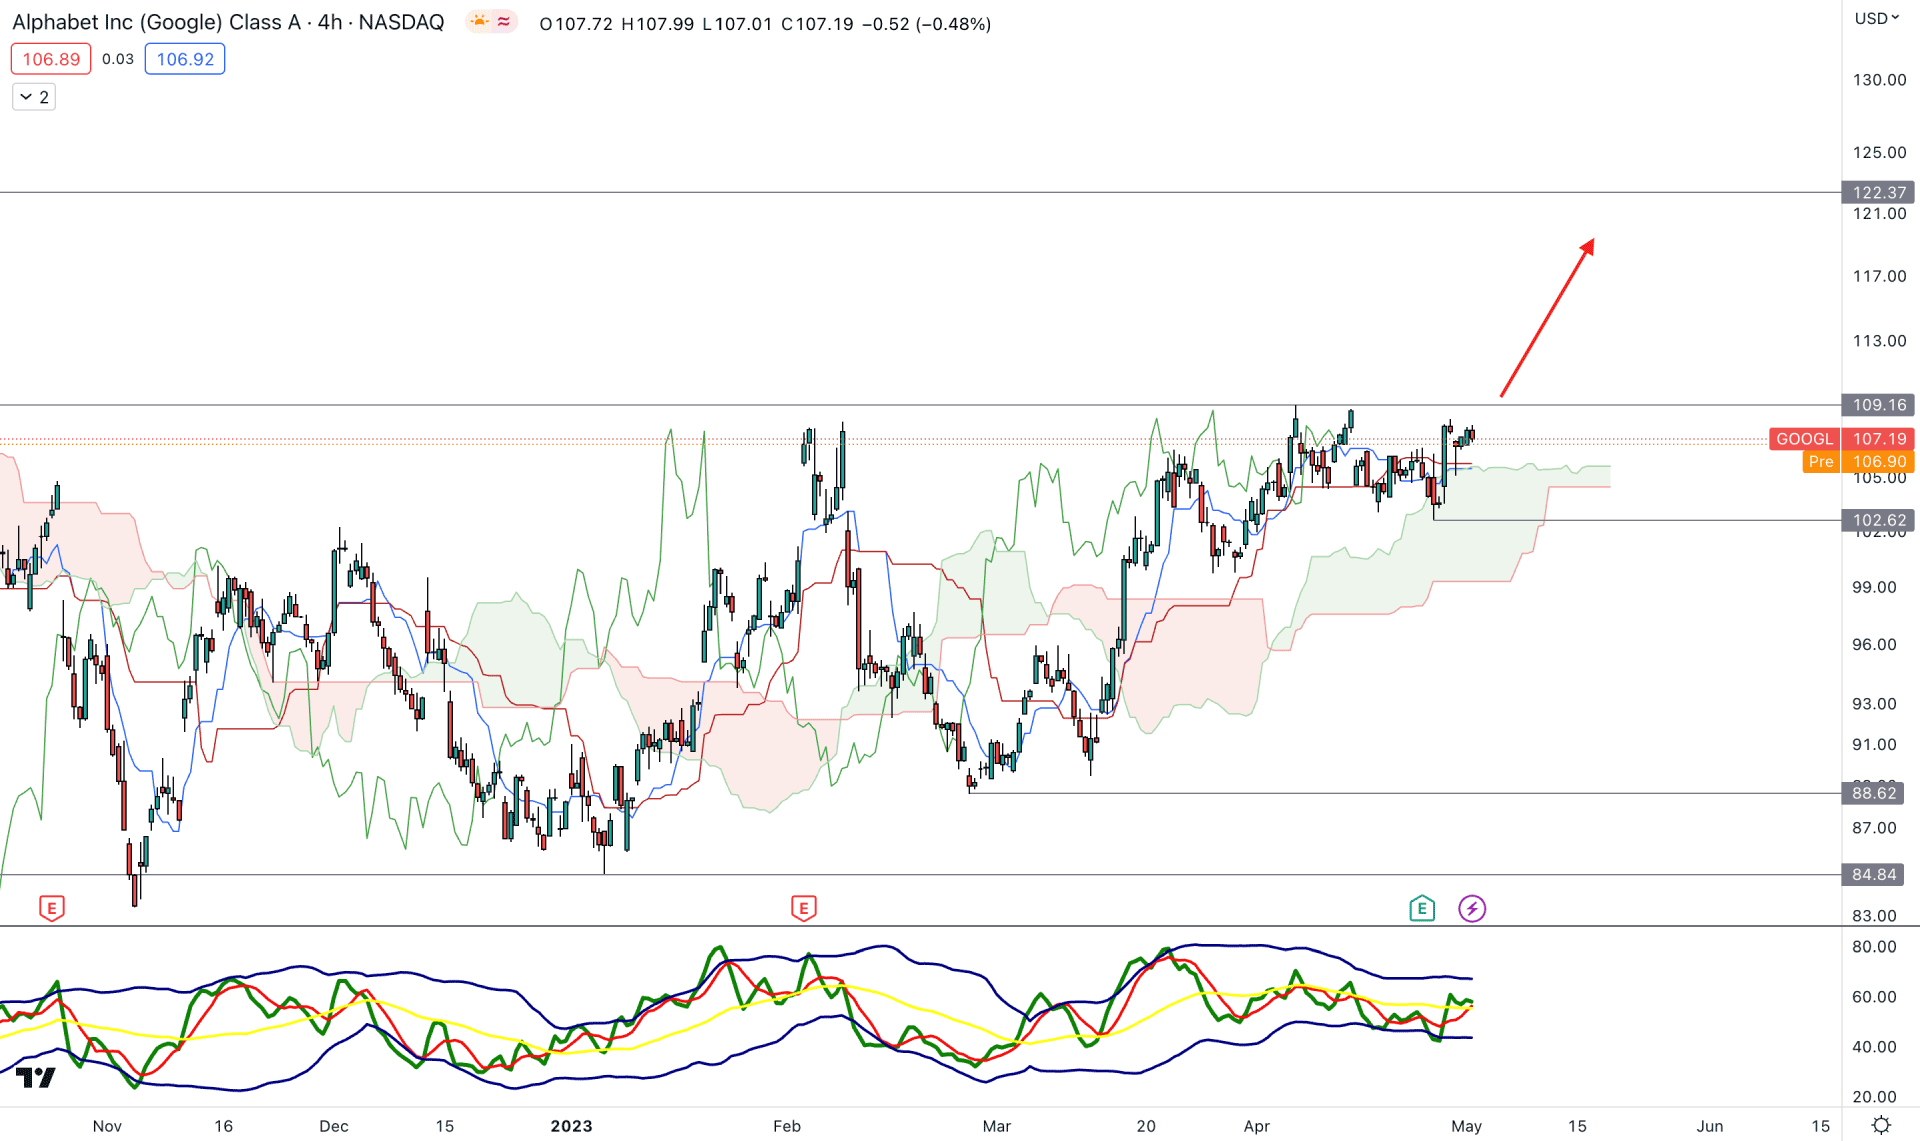
In the H4 chart, the current market structure is bullish as the recent price trades above the Ichimoku Kumo Cloud. After a strong bullish breakout on 16 March 2023, the price remains steady without any downside correction. It is a sign that bulls are strong in the market and any buying pressure from the near-term support level could be a long opportunity.
In the indicator window, the current TDI levels are above the 50.00 neutral line with a stable momentum. The current future cloud is also bullish, which is signaling buyers' presence in the market.
Based on the current H4 outlook, strong bullish pressure may come after breaching the 109.16 resistance level with a bullish H4 candle. However, a downside correction is possible but a bearish pressure below the 99.70 level might alter the structure and lower the price towards the 88.62 support level.
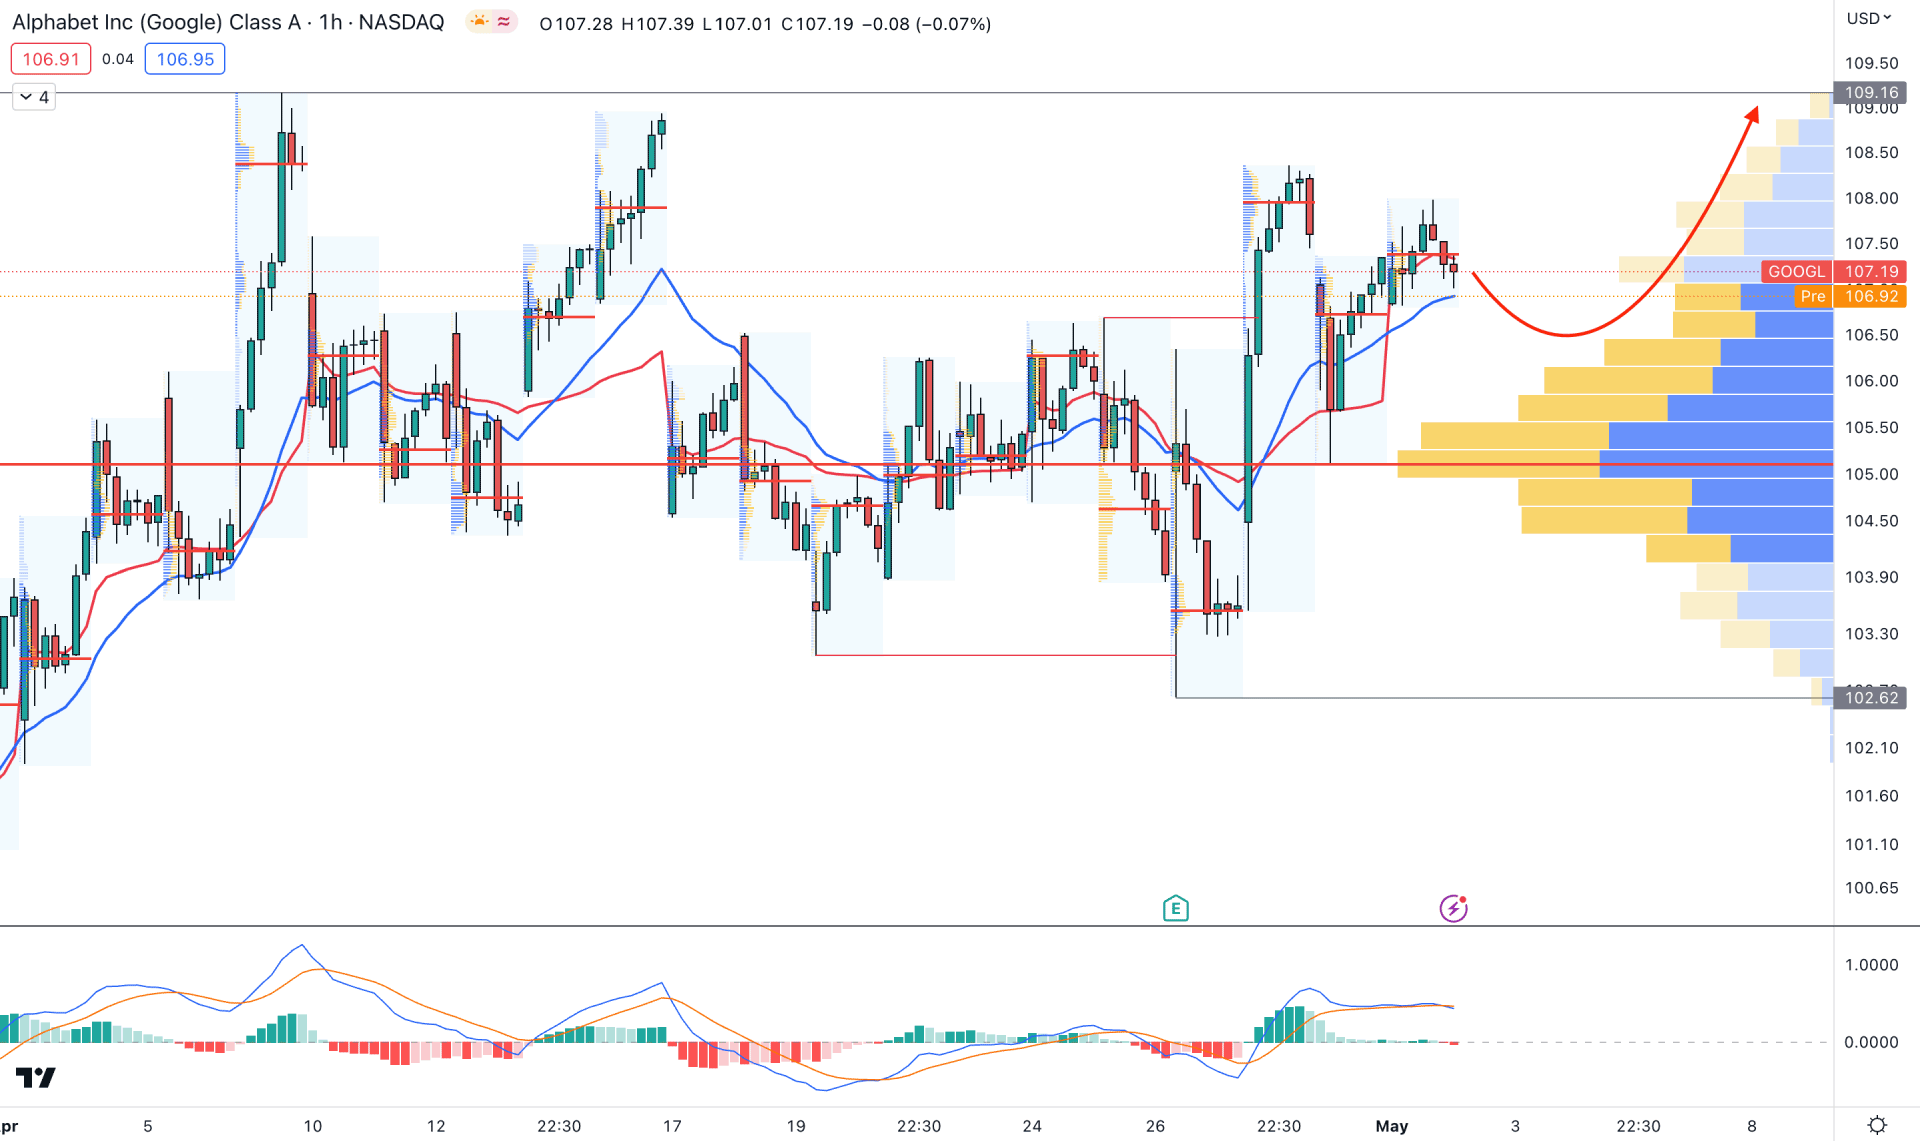
In the hourly chart, the current market structure is corrective, but bulls are more likely to win in this scenario. A bearish liquidity sweep is seen at the 103.07 level, which came with a valid bullish break of structure and a new swing high formation.
The visible range high volume level shows a stable momentum below the current price, while dynamic 20 EMA and weekly VWAP are working as immediate support.
In the indicator window, the current MACD Histogram is corrective at the neutral zone while the current MACD EMA’s are sideways.
Based on this structure, a bullish structure could extend the buying pressure as long as the price trades above the high volume 105.10 level. However, breaking below the 102.62 level could eliminate the bullish structure and lower the price to the 100.00 level in the coming hours.
Based on the current multi-timeframe analysis, GOOG is more likely to move up in the coming days. Investors should closely monitor the intraday price, where a valid Cup & Handle pattern breakout could open a long opportunity, targeting the 153.00 level.


