Published: July 19th, 2023
Alphabet's GOOGL is flexing its muscles to obtain an advantage over Microsoft MSFT in the competitive AI market. Google is expanding the availability of its own generative AI-powered chatbot, Bard, to Europe and Brazil to compete with Microsoft.
Google Bard was initially released in February, but compliance issues with EU privacy regulations caused a delay in its European distribution. However, the company responded to inquiries from regulators by enhancing user controls and transparency. Bard now supports over 40 languages, permits users to modify its tone and style, and enables image analysis.
Due to Bard's expanding global presence, Alphabet is well-positioned to capitalize on the flourishing chatbot and generative AI markets.
Between 2023 and 2032, the global chatbot market is projected to reach $4.9 billion at a CAGR of 19.3%, from Precedence Research. In addition, according to a report by Grand View Research, the market will reach $109.4 billion by 2030, expanding at a CAGR of 34.6% between 2022 and 2030.
In addition to chatbots, Alphabet's strong execution, adaptability to market trends, and increasing investments in AI have inspired investor confidence, as evidenced by the stock's 41.2% year-to-date increase.
Google has also introduced PaLM 2, a language model of the next generation with enhanced multilingual comprehension, reasoning, and coding capabilities. In addition, the company introduced NotebookLM, a notebook powered by AI designed to assist users in synthesizing information, generating insights, and making connections more quickly via language models and personalized content.
All of these endeavors are anticipated to contribute positively to Alphabet's future financial performance.
Let’s see the future price direction of Alphabet Inc (GOOGL) from the multi-timeframe analysis:
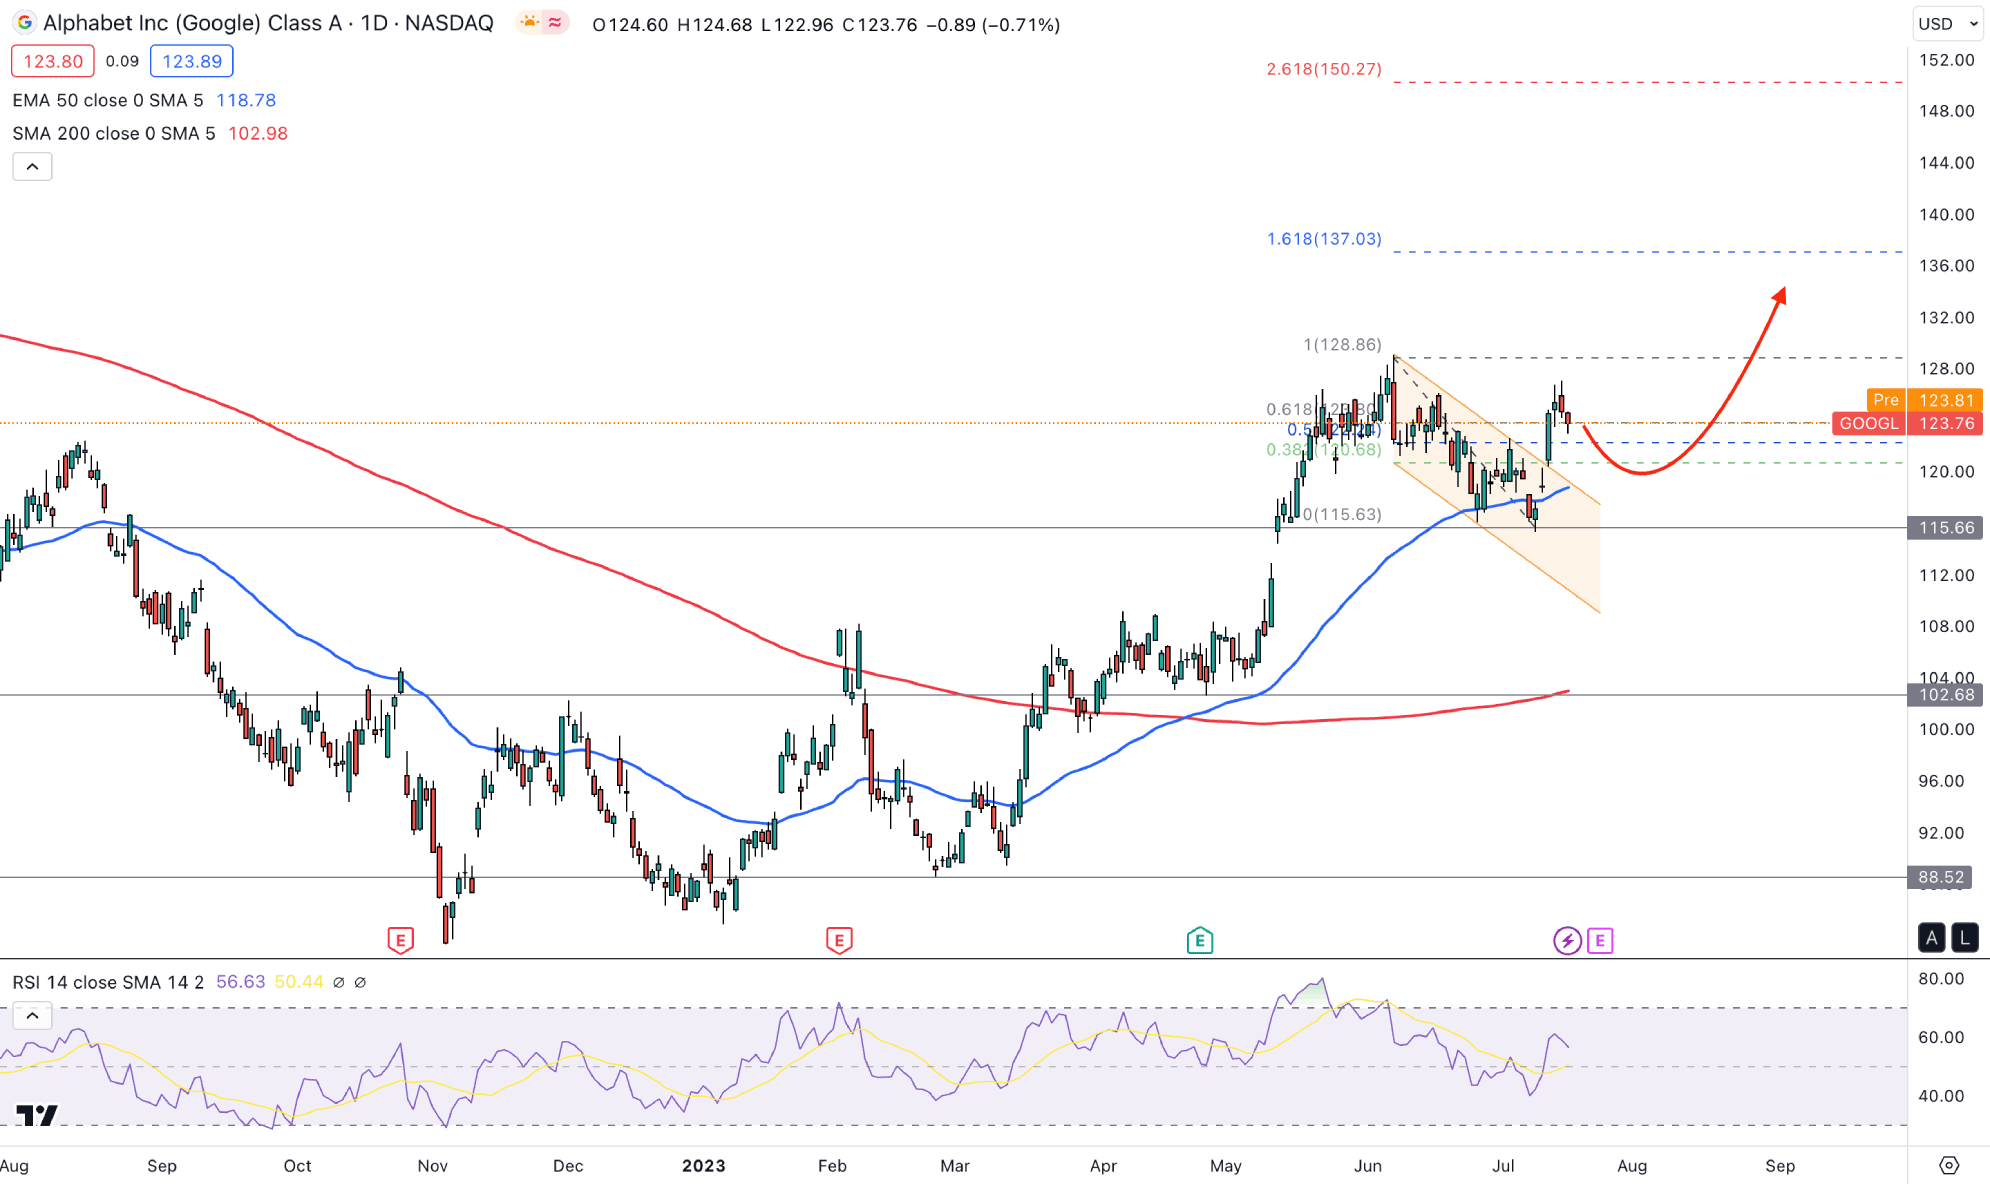
In the daily chart, the broader outlook is bullish, as the current price is supported by a Golden Cross pattern.
When the 50 EMA crosses above the 200 SMA, we may consider it as a golden cross, which indicates a potential bullish trend in the market. Also, there is a new higher high formation after the golden cross area, which opens the possibility of taking a bullish trend continuation strategy.
In the most recent chart, a considerable bearish correction was visible. Price went sideways after making a new high at the 128.86 level and moved to the 115.16 low. Later on, a strong bullish breakout came with impulsive pressure. Also, the buying pressure remained intact after the breakout, which indicates a trend continuation opportunity.
A recent buying pressure with a rebound from the 50-day EMA increases the possibility of testing the 137.03 level, which is the 161.8% Fibonacci Extension from the current swing.
In the secondary window, a bullish trend continuation opportunity is clear from the bullish Relative Strength Index. As per the current reading, the RSI shot higher above the 50.00 line, which indicates a possibility of reaching the 70.00 overbought level.
Based on the current daily outlook of GOOGL, a bullish trend continuation opportunity is present in the current price chart, where the main aim is to test the 137.00 level before reaching the 150.00 psychological level.
On the other hand, an attempt to make a new lower low below the 50-day EMA could signal sellers’ accumulation, which could extend the downside pressure toward the 110.00 support level.
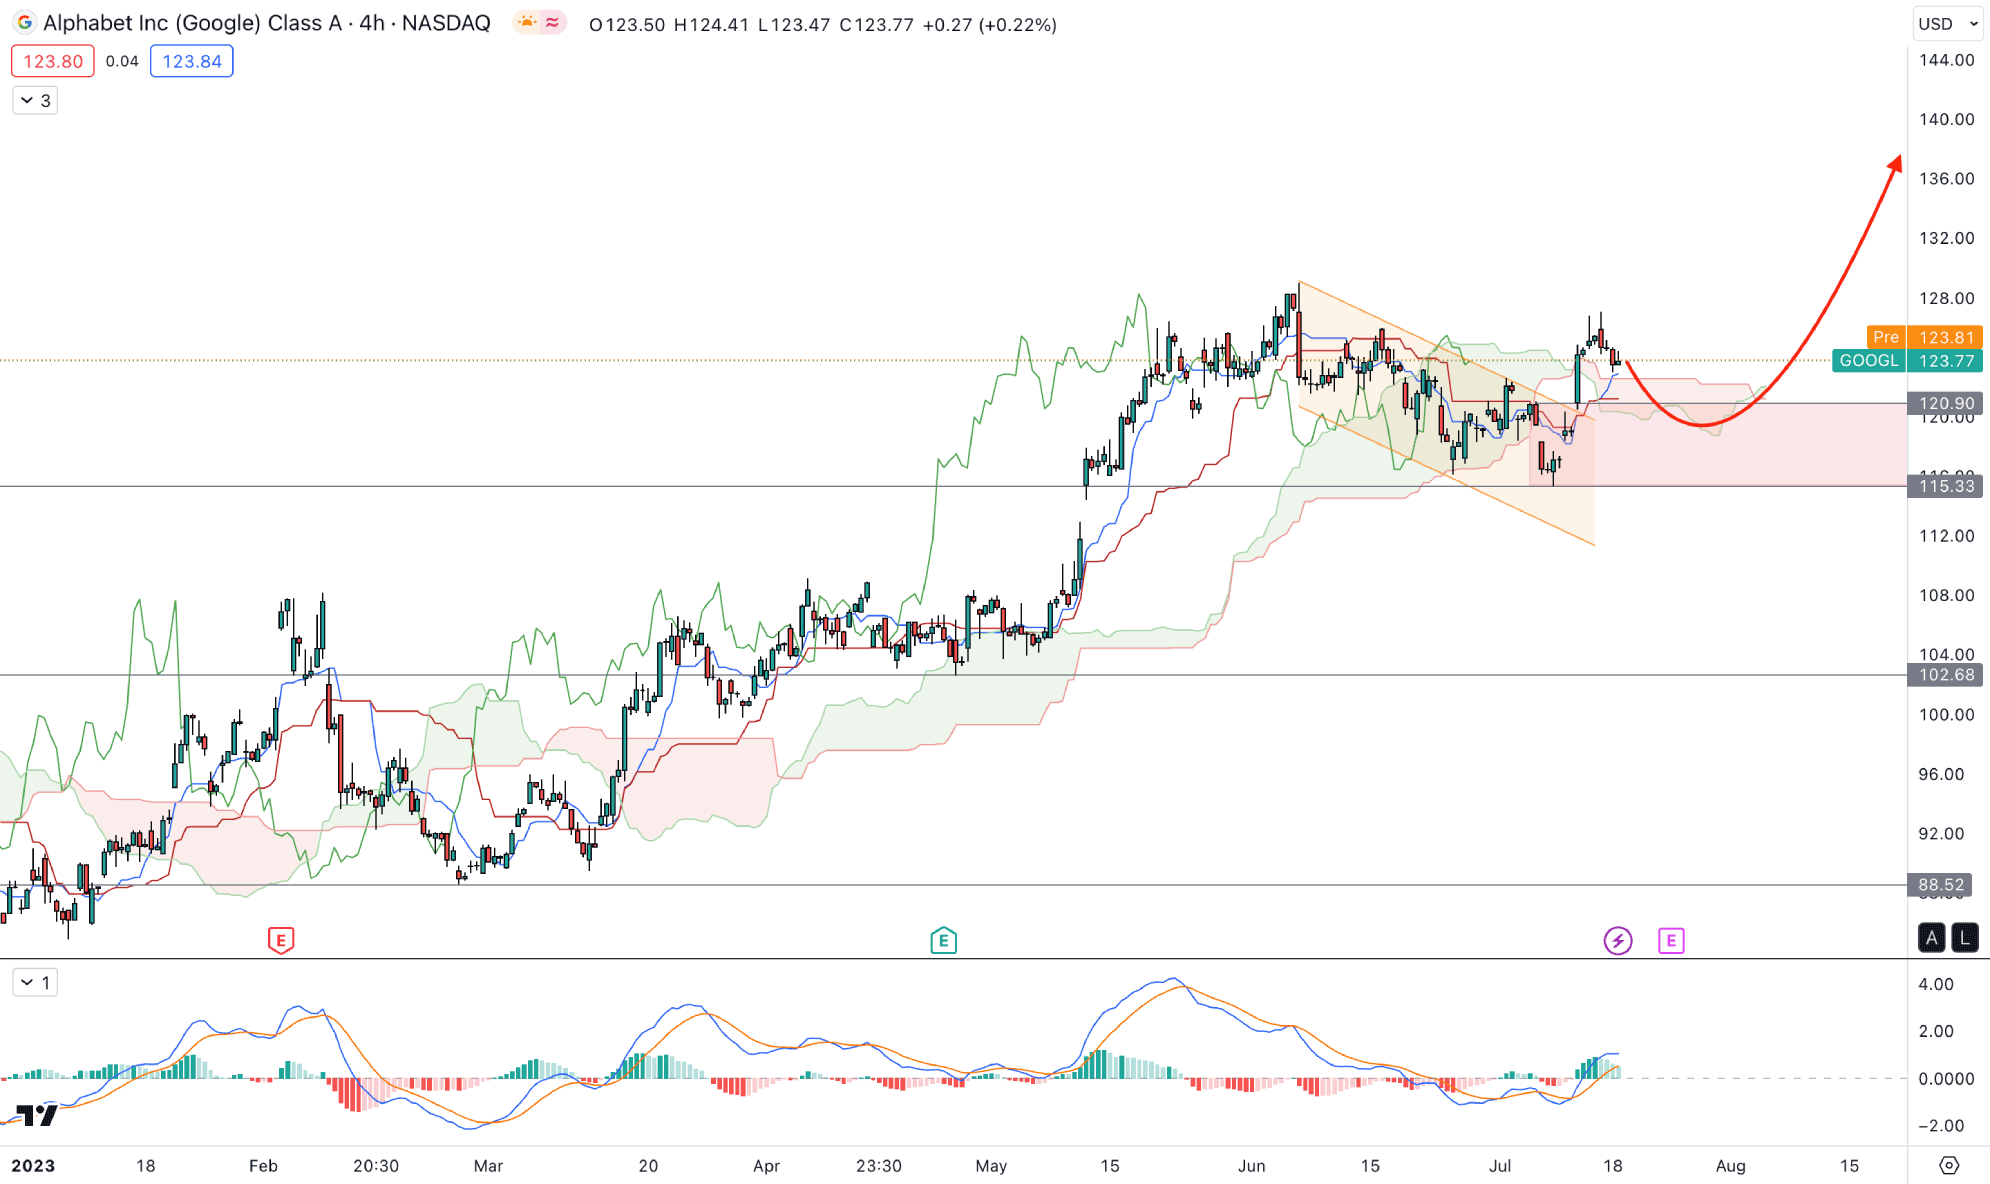
In the H4 timeframe, the bullish descending channel breakout is clear, while the current price remained steady above the Ichimoku Kumo Cloud. A bullish crossover is visible in the future cloud, where Senkou Span A is above B.
A bullish breakout is visible from the dynamic Kijun Sen support, while the current MACD Histogram is above the neutral 0.0 line.
Based on the current H4 outlook, a new swing high is more likely to happen in the GOOGL chart. Investors should monitor how the price reacts in the e 120.90 to 115.00 area. Any strong bullish rejection from this demand zone could offer a long opportunity, targeting the 150.00 level.
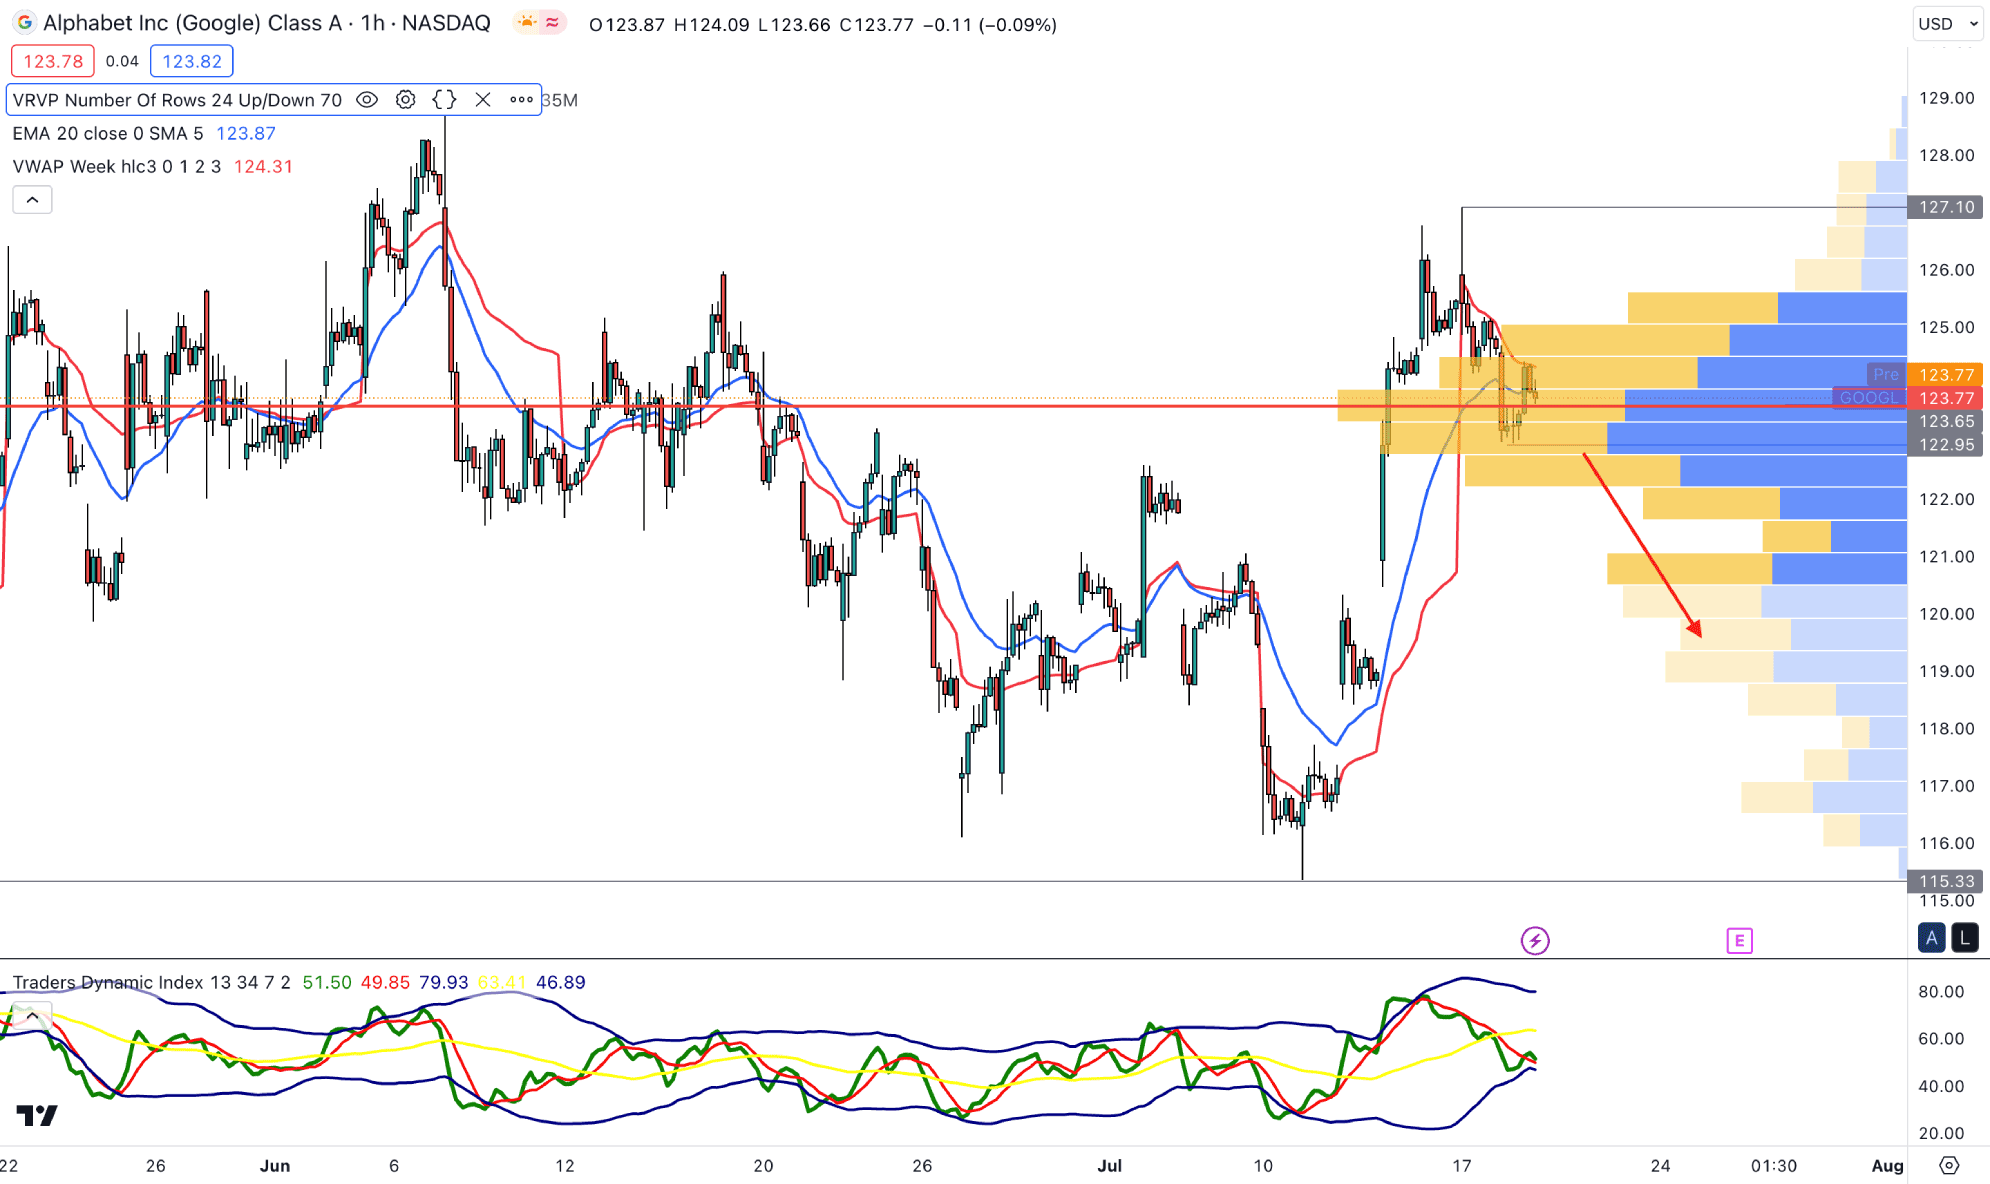
In the hourly time frame, the current price is trading within a bullish trend, while the current visible range high volume level is working as immediate support.
On the other hand, the upward pressure is limited as the price failed to make a new swing high from the 20 EMA support. As a result, the weaker buying pressure may extend the downside correction in the coming hours.
The current TDI level in the indicator window shows a corrective pressure as it remains at the 50.00 neutral line.
Based on the current H1 outlook, a downside correction is potent where a bearish H1 candle below the 122.95 high volume level could lower the price. However, a bullish rebound from the 122.00 to 119.00 area could open a long opportunity, targeting the 129.00 level.
Based on the current price outlook of GOOGL, the bullish possibility is potent, and investors might expect the price to create a new swing high above the 150.00 level. However, a considerable downside correction is pending after the channel breakout, and a solid recovery is needed before offering a long opportunity.


