
Published: August 26th, 2021
ALICE is the My Neighbor Alice’s native utility token that allows players to purchase new assets and skills in Alice’s marketplace.
My Neighbor Alice is a multiplayer game where players can build their virtual islands, meet new friends and build exciting monuments. This game was inspired by the popular, successful game Animal Crossing, where players can enjoy the gameplay and participate in collecting and trading Non-Fungible Tokens (NFTs).
Currently, the My Neighbor Alice has a trading volume of $708,774,653, with a -3.7% price change, in the last 24 hours. It has a live market cap of $445,915,639 with a circulating supply of 23,000,000 ALICE coins. The recent surge in the NFTs market made this coin interesting as it pushed higher from $4.00 to $20.00 in a month.
Let’s see the upcoming price direction from the ALICE/USDT technical analysis:
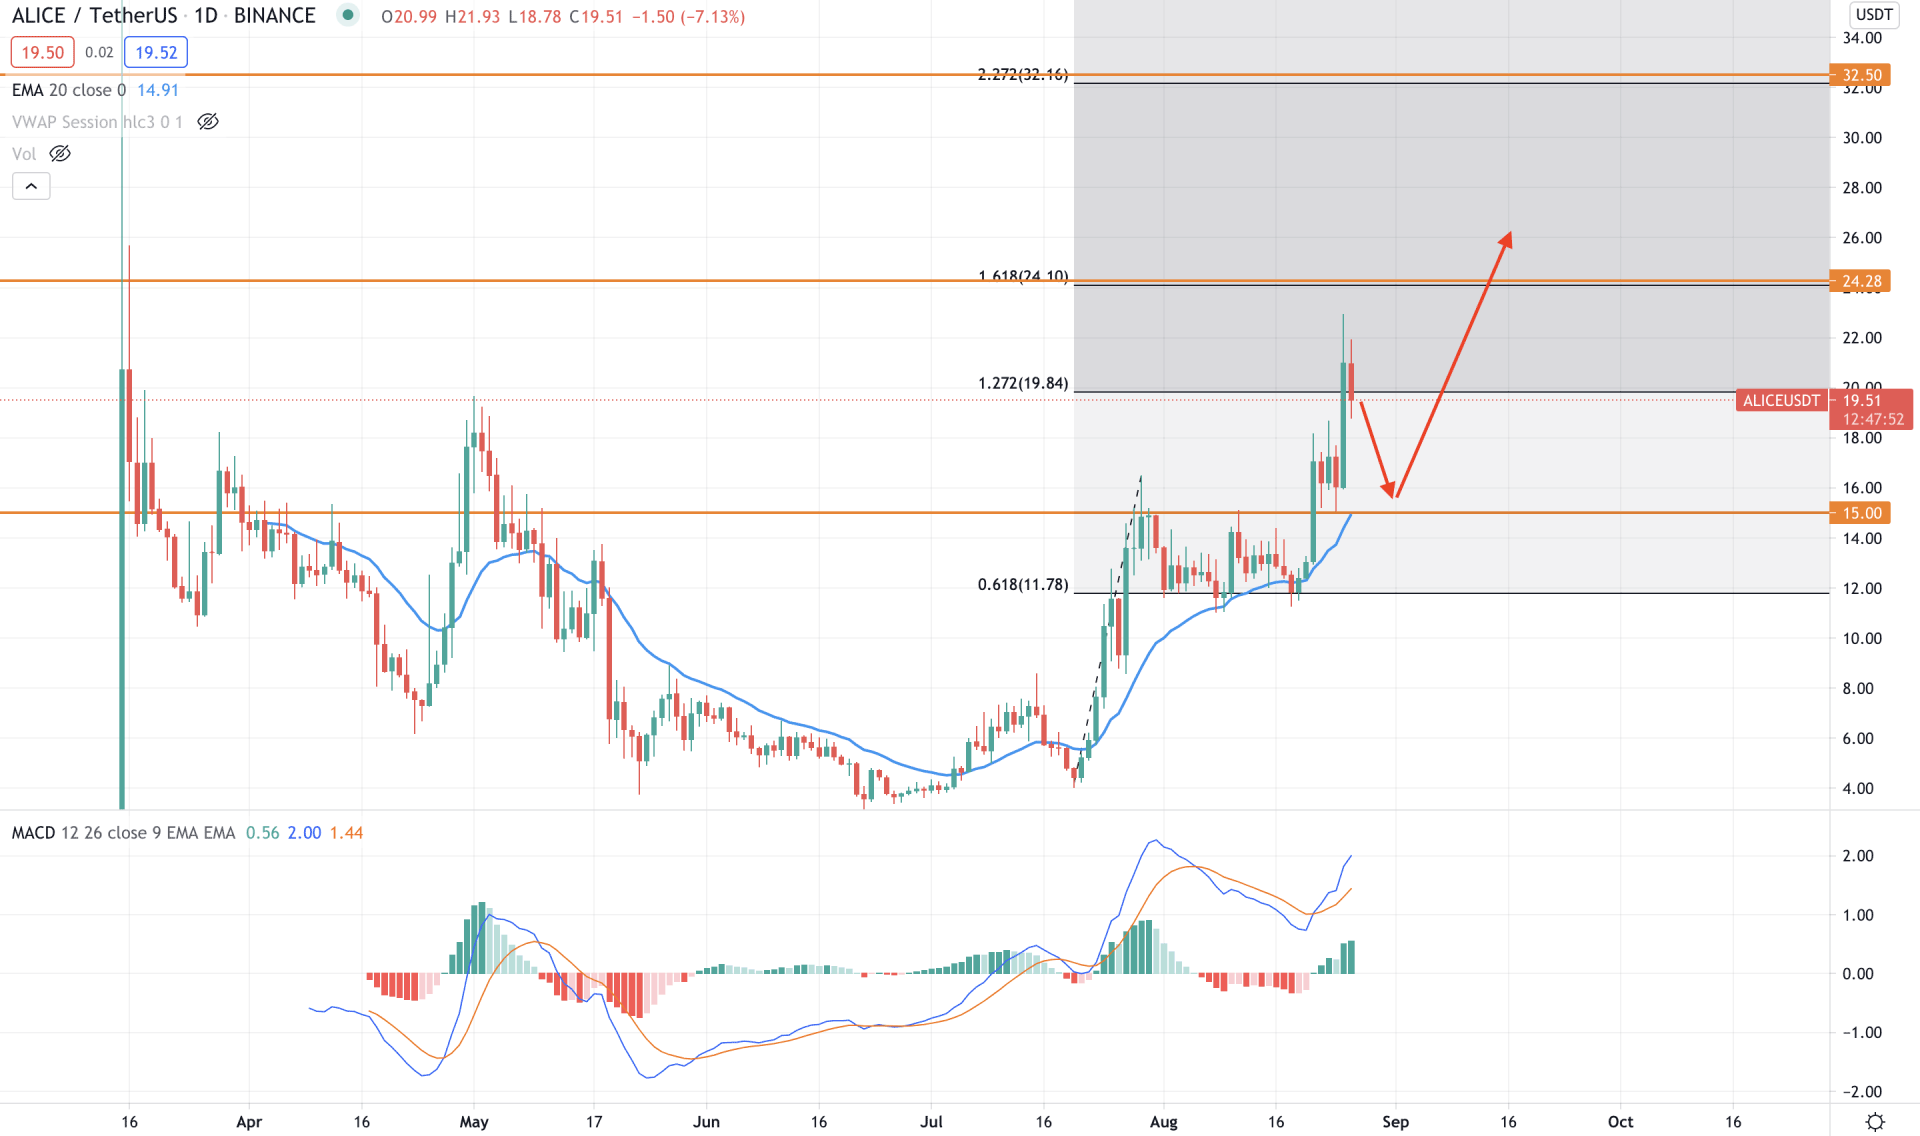
ALICE/USDT found the bottom from the broader crypto and NFTs crash in the first half of 2021. However, the price started to grow with the strong recovery in the NFTs market and made a first swing high at the 15.00 level. Later on, the price corrected lower and made another swing high at the 22.94 level. The consecutive higher highs with the support of the broader market recovery is a sign that the price is likely to extend the bullish pressure in the coming days.
If we draw a Fibonacci line from the 20 July low to 29 July high, we would see that the price retested the 68.1% Fibonacci retracement level at 11.96 level and made a stable position above the 15.00 resistance level. In that case, the price has a higher possibility of moving up above the 161.8% Fibonacci Extension level from the 20 July low to 29 July high.
In the indicator window, MACD Histogram turned bullish and made new highs, pointing out a buyer’s presence in the price. Moreover, MACD Line is above the histogram and making new highs, which signifies a possible bullish momentum. Moreover, the price is trading above the dynamic 20 EMA, where a short-term correction is pending.
In that case, a bearish correction towards the 15.00 level may increase the buying pressure, while a break below this level with a bearish daily close may alter the current market structure.
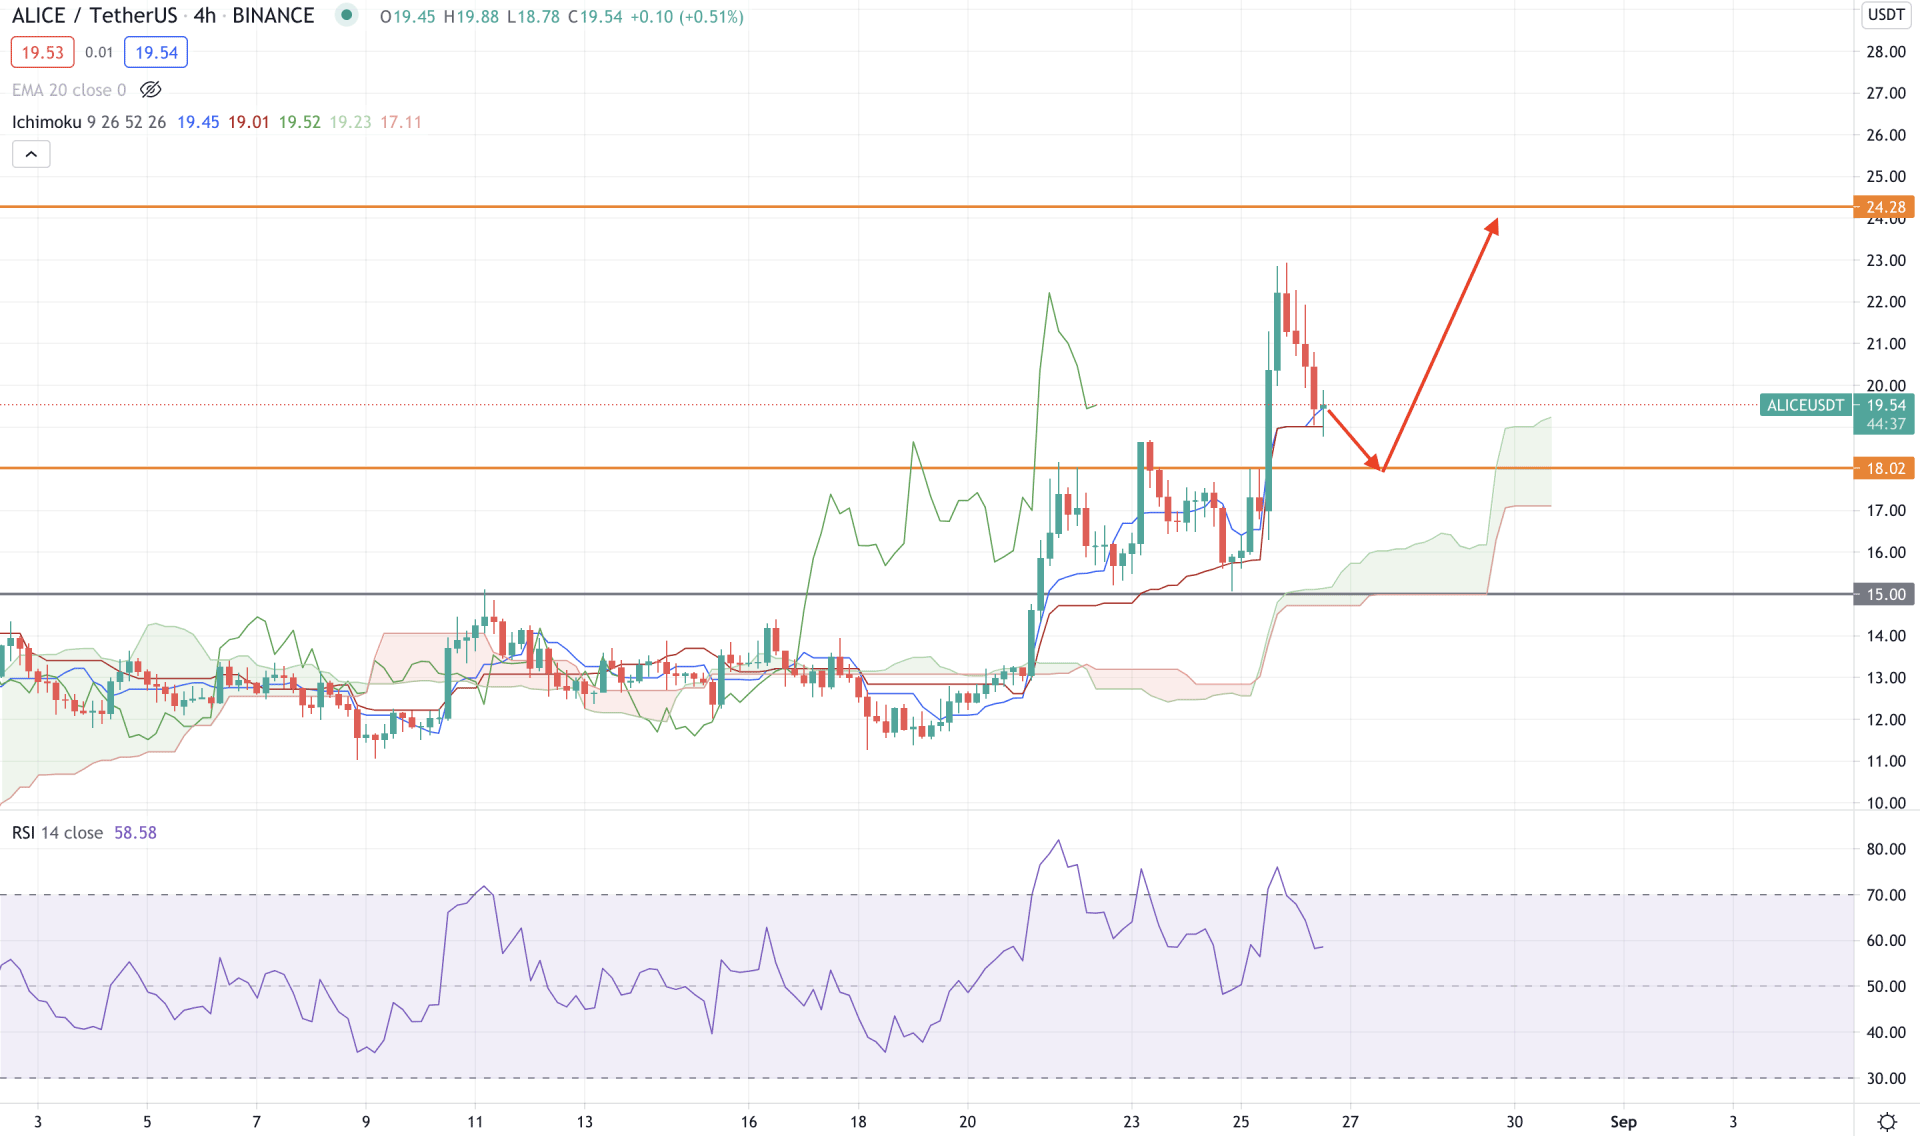
According to the Ichimoku Cloud, the overall market context is bullish. The price moved above the Kumo Cloud with strong bullish pressure and held its strong position for a considerable time. The Senkou Span A moved above the Senkou Span B and aimed higher in the future cloud while the Chikou Span was above the price. Therefore, the price is more likely to extend the bullish pressure above the near-term high of 22.94.
The above image shows that the ALICE/USDT price moved above the intraday static resistance of 18.02 level with strong bullish pressure and still holding a strong position above this level. In the meantime, Tenkan Sen and Kijun Sen are below the price and working as minor support.
In this context, the buying possibility is valid as long as the price is trading above the 18.02 support level, making another high towards the 24.28 level. However, a break below the 18.02 level with a bearish H4 close may initiate a broader correction to the price.
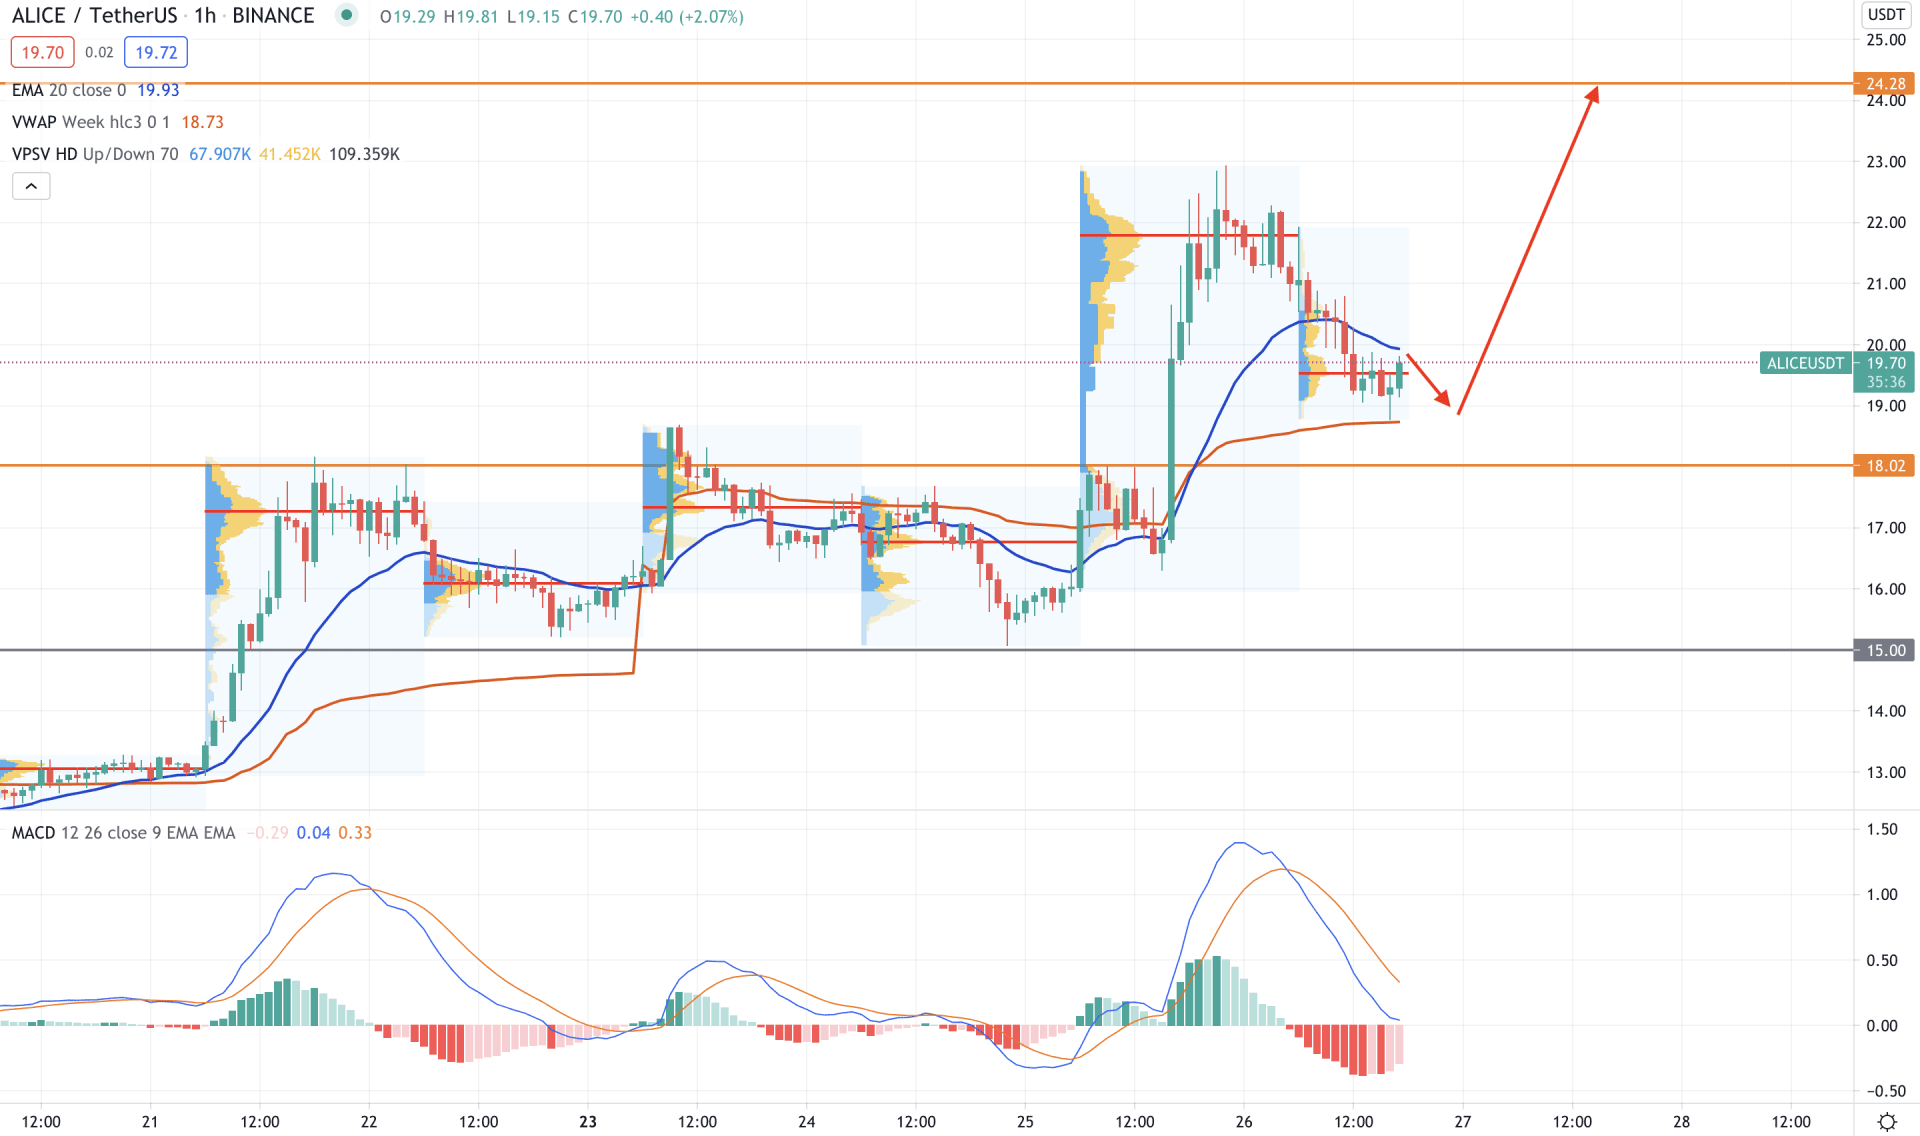
In the intraday chart, ALICE/USDT is trading with a strong bullish pressure where the price is trading at the most recent high volume level of 19.54. Moreover, the price is above the intraday of 18.02 event-level and facing minor support from the dynamic vwap.
The above image shows that the price broke above the 18.02 level with a strong bullish H1 candle and corrected lower. The current price is above the dynamic vwap level while the bearish MACD Histograms are squeezing up.
In this context, a bullish H1 close above the dynamic 20 EMA with a bullish MACD Histogram may increase the price towards the 24.28 level. Moreover, the bullish possibility may regain momentum until the price is breaking below the 15.00 support level.
As of the above observation, ALICE/USDT is more likely to extend the current bullish pressure as long as the price is trading above the 15.00 support level. Moreover, any intraday bullish pressure above the dynamic Kijun Sen in the H4 chart may boost the buying pressure.
On the other hand, a bearish daily close below the 15.00 level may alter the current market structure and lower the price towards the 11.00 level.


