![Alibaba Stock [BABA] Shooted Higher with a Strong Volume – Is It a Buy?](https://d3kvcd8uuqwmxt.cloudfront.net/filecache/articles_img/tech-analysis-main-page.jpg_804_61686d9cc78a59.19030334.jpeg)
Published: October 14th, 2021
Alibaba Company released the quarterly earnings report on 3 August, where the revenue was boosted by 46% to $31.9 billion. The number of active customers was around 1.18 billion during the year ended June 2021, representing 45 million new customers than the previous quarter. Among them, 939 million were active mobile users. The increase in revenue and number of new customers allowed the company to raise the share buyback program to $15 billion. The better-than-expected quarterly earnings came after the negative response in May where the company missed the Q4 earnings expectation. However, the revenue growth remained stable for the fourth consecutive quarter, soaring 77% to $28.6 billion.
It is often hard to find a company like Alibaba with an impressive track record. However, in the last five years, annual growth remained at 29%, which is a solid reason to consider the stock a buy. Moreover, the Annual Singles day shopping event is appearing in November, where the company may experience huge sales with a stock price appreciation.
Let’s see the upcoming price direction from the Alibaba Stock [BABA] technical analysis:
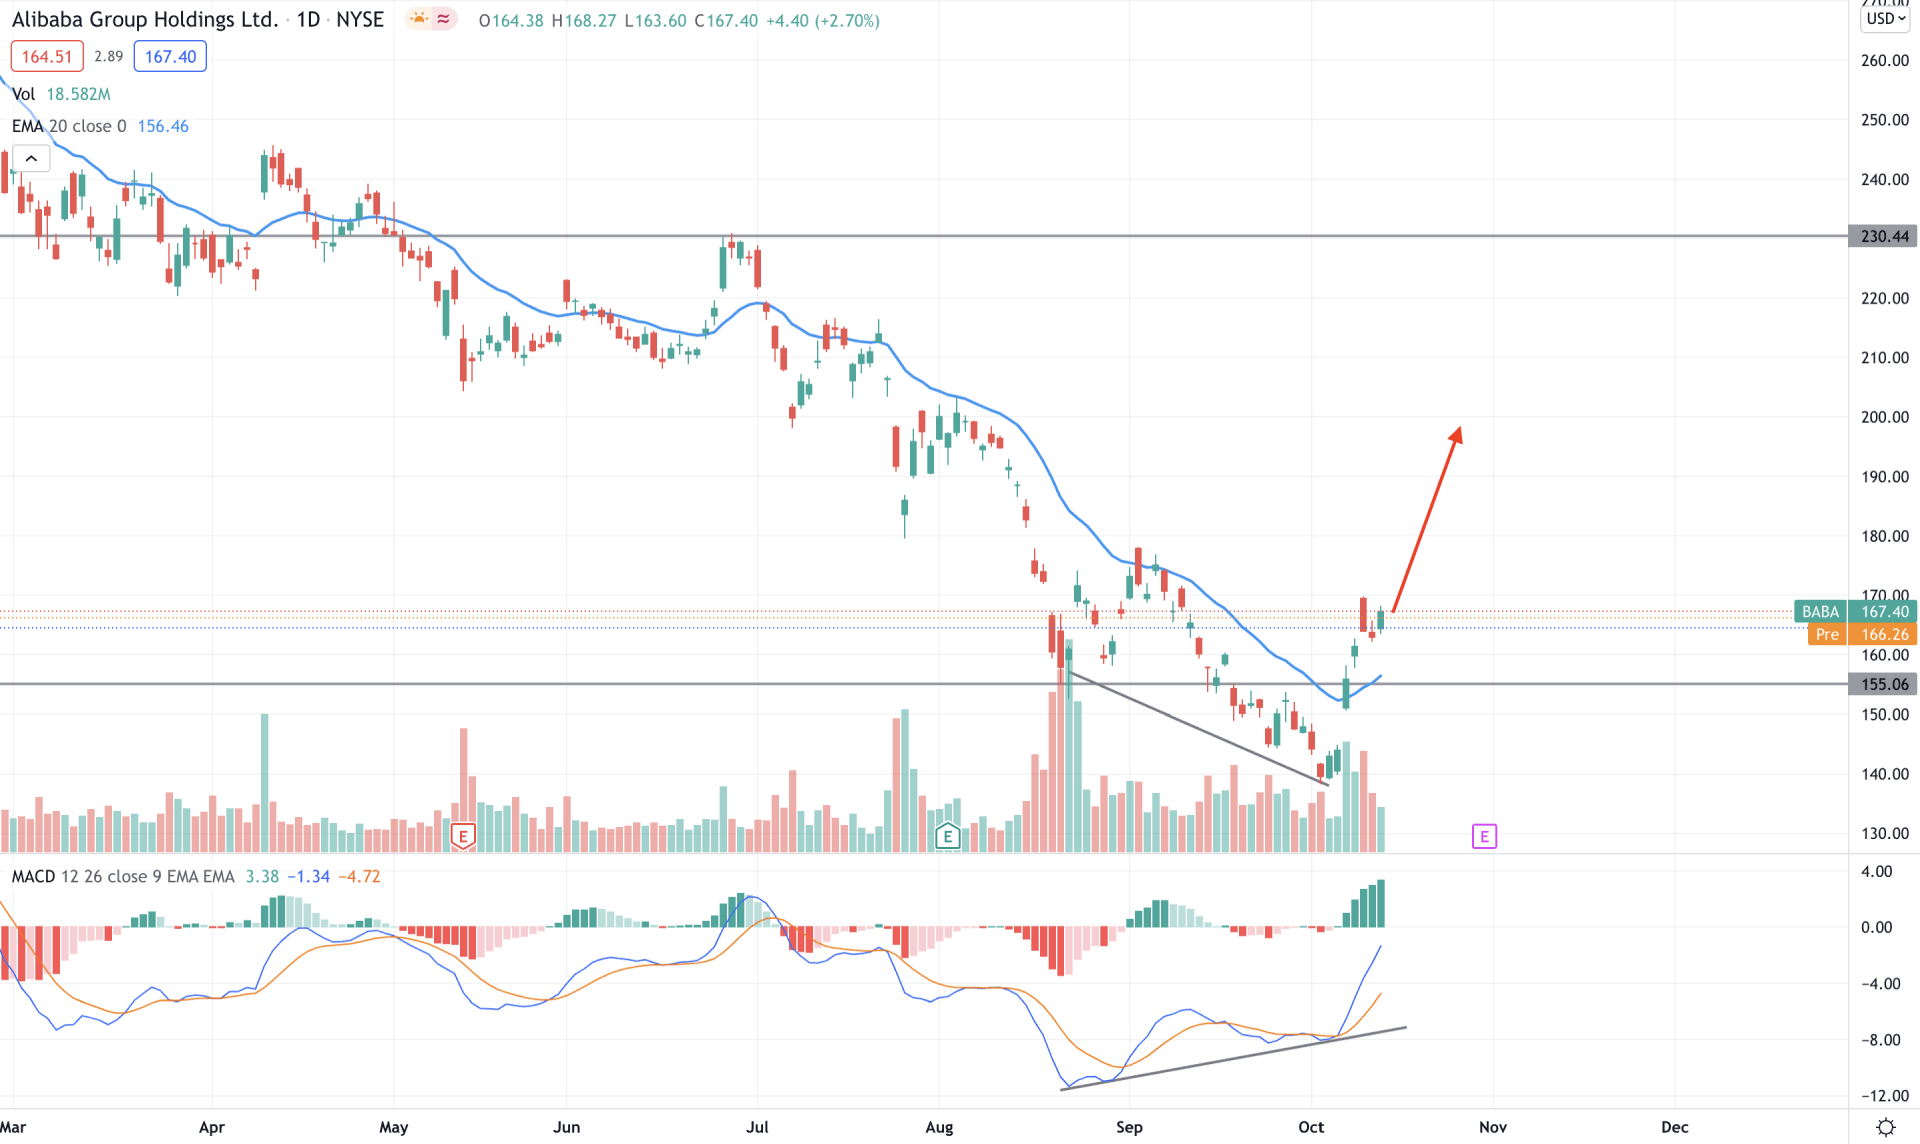
Alibaba stock [BABA] remained within a bearish pressure after breaking below the 230.44 event level with an impressive bearish pressure. As a result, the price started to move lower by creating new swings. Meanwhile, the dynamic 20 EMA worked as strong resistance from where the price has faced several rejections. However, the situation has changed in the most recent chart, where the price moved above the dynamic 20 EMA for the first time in the last three months.
The above image shows how the price moved above the dynamic level with a massive gap. Meanwhile, the trading volume increased during the breakout while the MACD Histogram showed a regular divergence. Therefore, we can consider the bullish pressure as stable as long as the price holds the 155.06 level.
Based on the daily context, any bullish rejection from 167.00 to 155.06 may stabilize the current bullish trend. On the other hand, bears should find the price below the 155.06 level to consider the current momentum invalid.
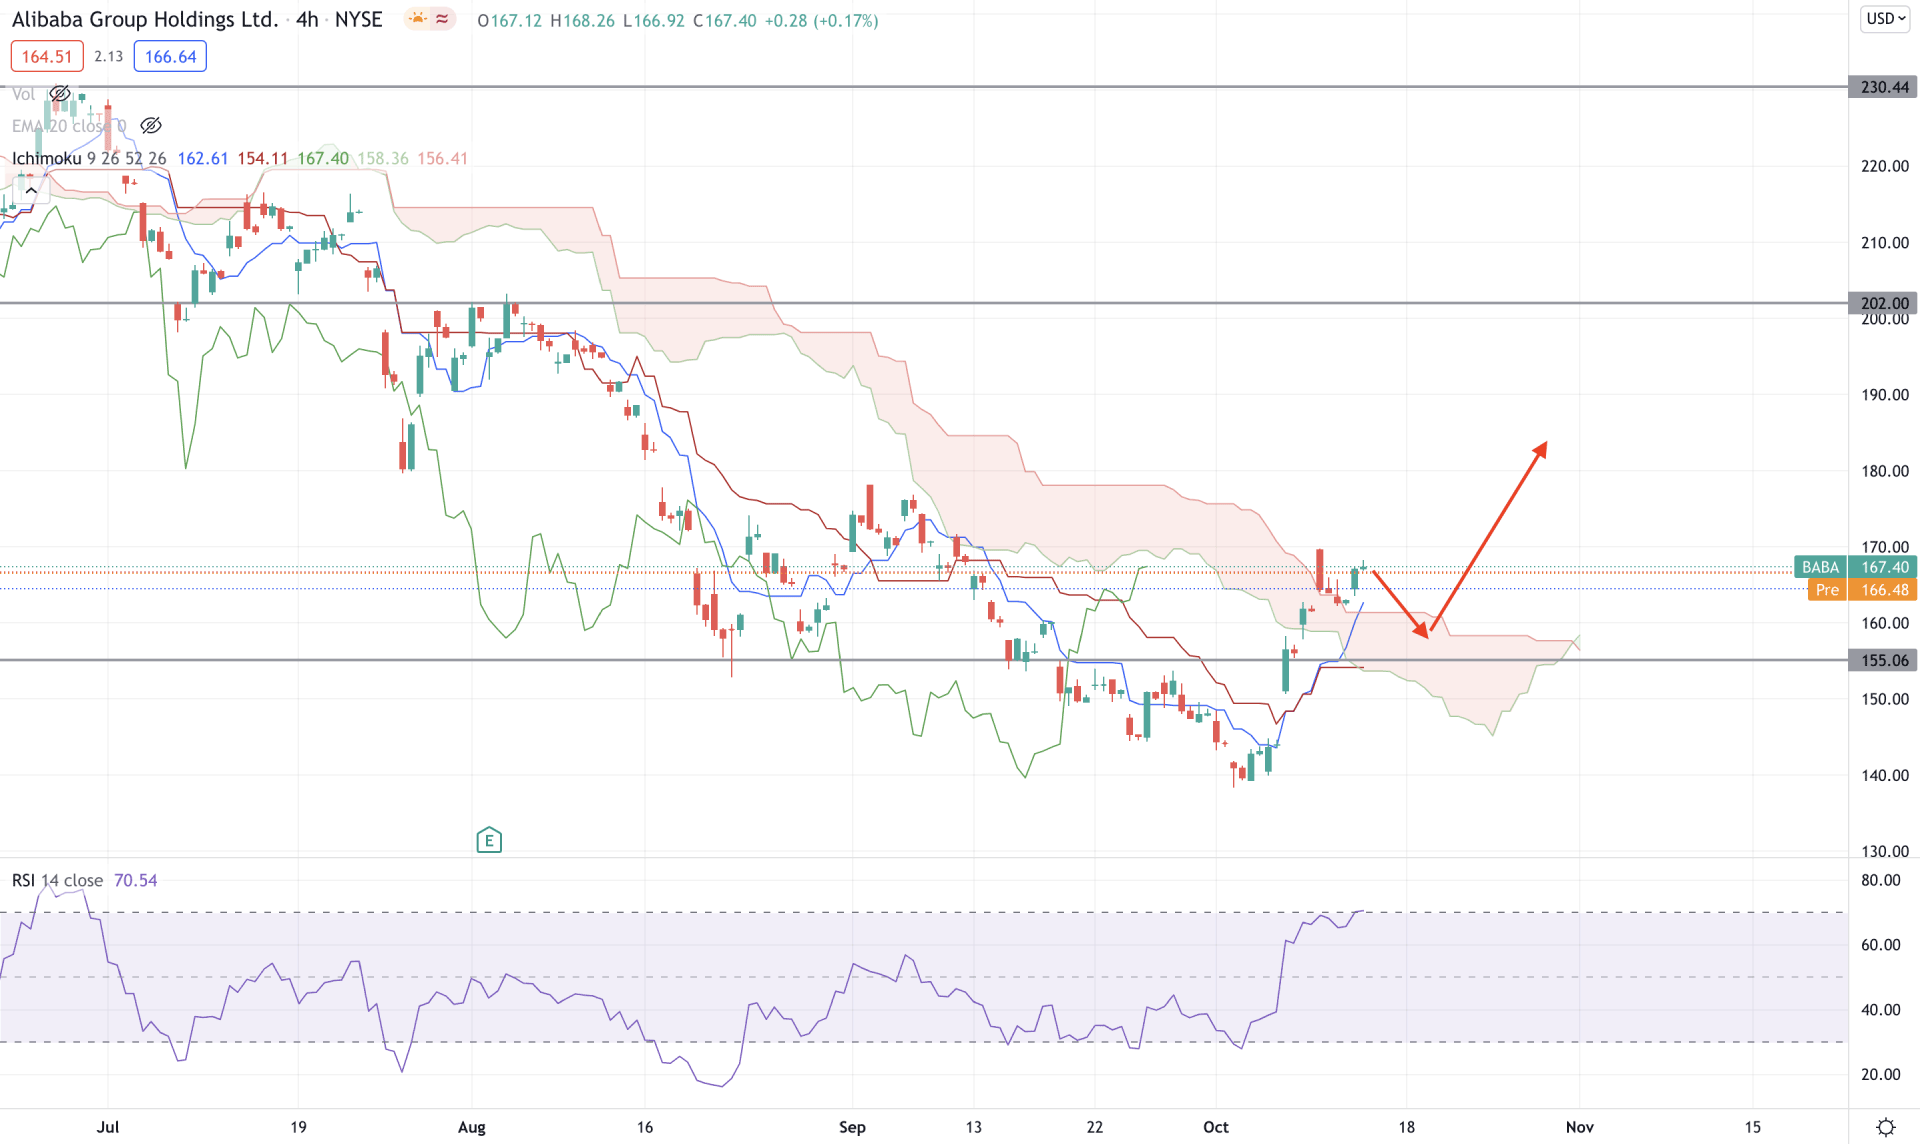
According to the Ichimoku Kinko Hyo, Alibaba Stock shifted its direction from bearish to bullish as the price moved above the Kumo Cloud after a long bearish trend. Moreover, the Future Cloud changed its direction where the Senkou Span A moved above the Senkou Span B with a bullish indication of the Chikou Span.
The above image shows how the price moved above the 155.06 static event-level while the Tenkan Sen moved above the Kijun Sen with strong bullish pressure. In the indicator window, we can see that the RSI moved at the potential 70 levels, a solid overbought zone that may increase the corrective momentum in the price.
Based on the H4 context, any bullish rejection from 167.00 to 155.06 would increase the buying pressure towards the 202.00 swing high. On the other hand, any break below the 155.06 level needs H4 close below the Kumo Cloud to consider the upcoming trend as bearish.
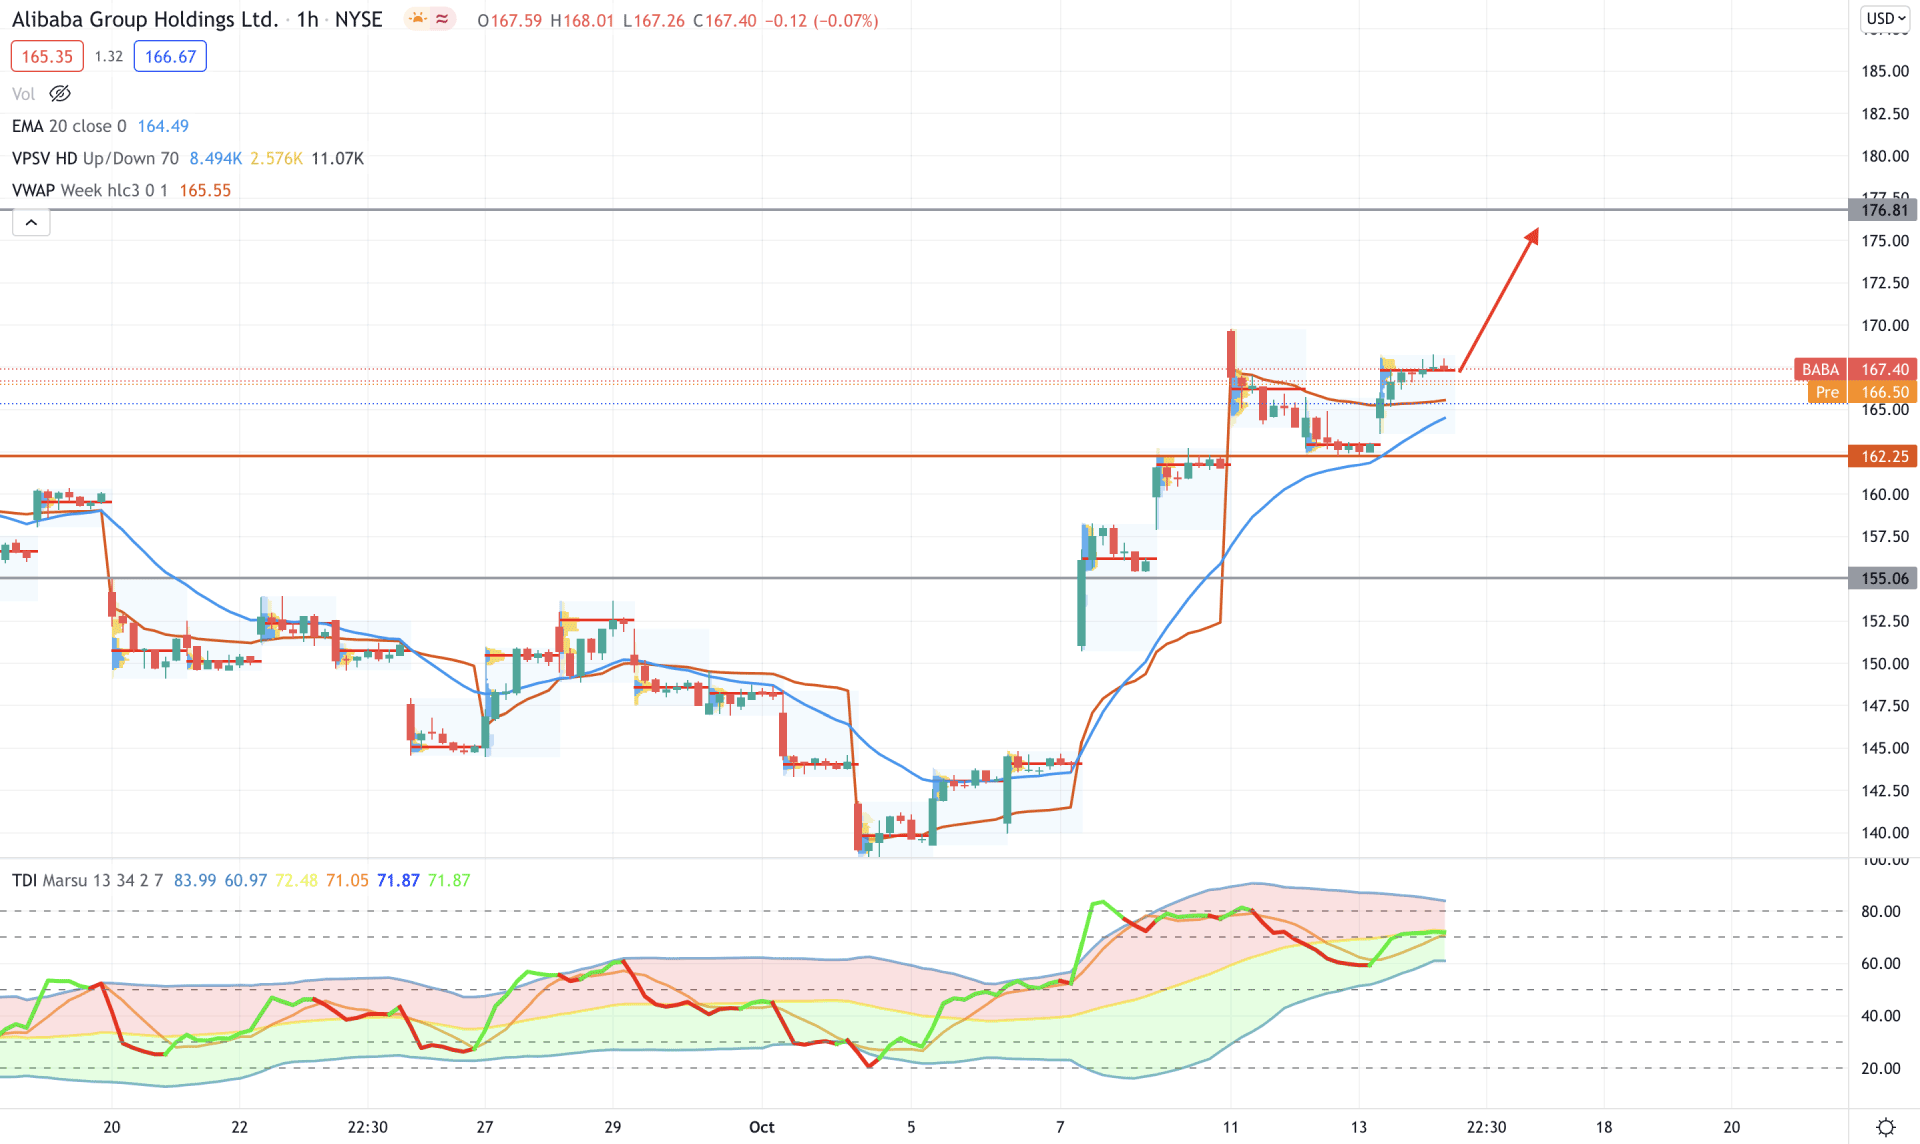
In the intraday chart, Alibaba Stock is moving up with a solid bullish pressure where investors have seen intraday high volume levels to make higher highs. Moreover, the current price is above the most recent intraday event level 162.25 level, where the last trading day closed at the most recent high volume level at 167.40. Therefore, as long as bulls hold the price above the 162.25 level, it is more likely to extend the momentum towards the 176.81 level.
The above image shows how the Traders Dynamic Index moves in the indicator window, where the RSI line is above the middle point. Therefore, we can expect the bullish pressure to extend as long as the RSI line remains green and above the lower band. Moreover, the price is above the dynamic 20 EMA and weekly VWAP and facing support from them.
Based on the H1 context, the overall market structure is bullish, and it may extend higher towards the 176.81 level. On the other hand, a bearish H1 close below the dynamic 20 EMA may start a broader correction in the price.
As per the current market condition, Alibaba Stock [BABA] has a higher possibility of extending the bullish pressure in the coming days. Moreover, the upcoming quarterly earnings report on 29 October and Annual Single Day Shopping would be key events to watch, where the current projection is bullish for the Alibaba Stock.
However, investors should closely monitor how the price reacts on the 155.06 level, where any break below this level with a bearish H4 close may initiate a bearish correction in the price.


