
Published: February 13th, 2025
According to Alibaba chairman Joe Tsai, the company is collaborating with Apple to introduce AI capabilities for iPhones in China.
Tsai made her remarks the day after it was reported that Apple had recently applied for certification from China's cyberspace authority for Apple Intelligence features that were created in collaboration with Alibaba.
Alibaba's stock increased 8.5% on Wednesday due to the news. Shares increased further on Thursday afternoon, reaching a total of 3.3%.
Tsai clarified that because of regulatory concerns, Apple must collaborate with Chinese businesses on AI features. Last year, Apple introduced Apple Intelligence, a new artificial intelligence tool that offers a range of text-generation and photo-editing features in addition to an enhanced Siri voice assistant.
According to CEO Tim Cook, the lack of Apple Intelligence in China was one factor in the 11% drop in the U.S. technology giant's Greater China sales in the quarter that ended in December.
Apple or Alibaba did not immediately answer requests for comment. Next Thursday is when the corporation is expected to release its earnings.
Can Alibaba extend the gain after next week's earnings report? Let's look at the BABA technical analysis:
In Alibaba stock's daily chart, a recent bullish recovery came with counter-impulsive momentum, opening the room for extended bullish pressure. Investors should closely monitor how the price trades above the 7 October 2024 high. A consolidation above this line could primarily signal more buying pressure in the coming days.
Looking at the higher timeframe, a bullish Cup & Handles breakout is clearly divisible in the monthly chart. In that case, a positive monthly close in February 2025 would be a good signal of a long-term bullish opportunity in this stock. Following the major selling pressure from the 2020 high, the price is still trading at the discounted zone, which might attract long-term investors and HODLers.
In the volume structure, a moderate downside correction is pending as the high volume line since April 2024 is 31% below the current price. However, a bullish rebound is highly possible until a new high level forms above October 2024 high.
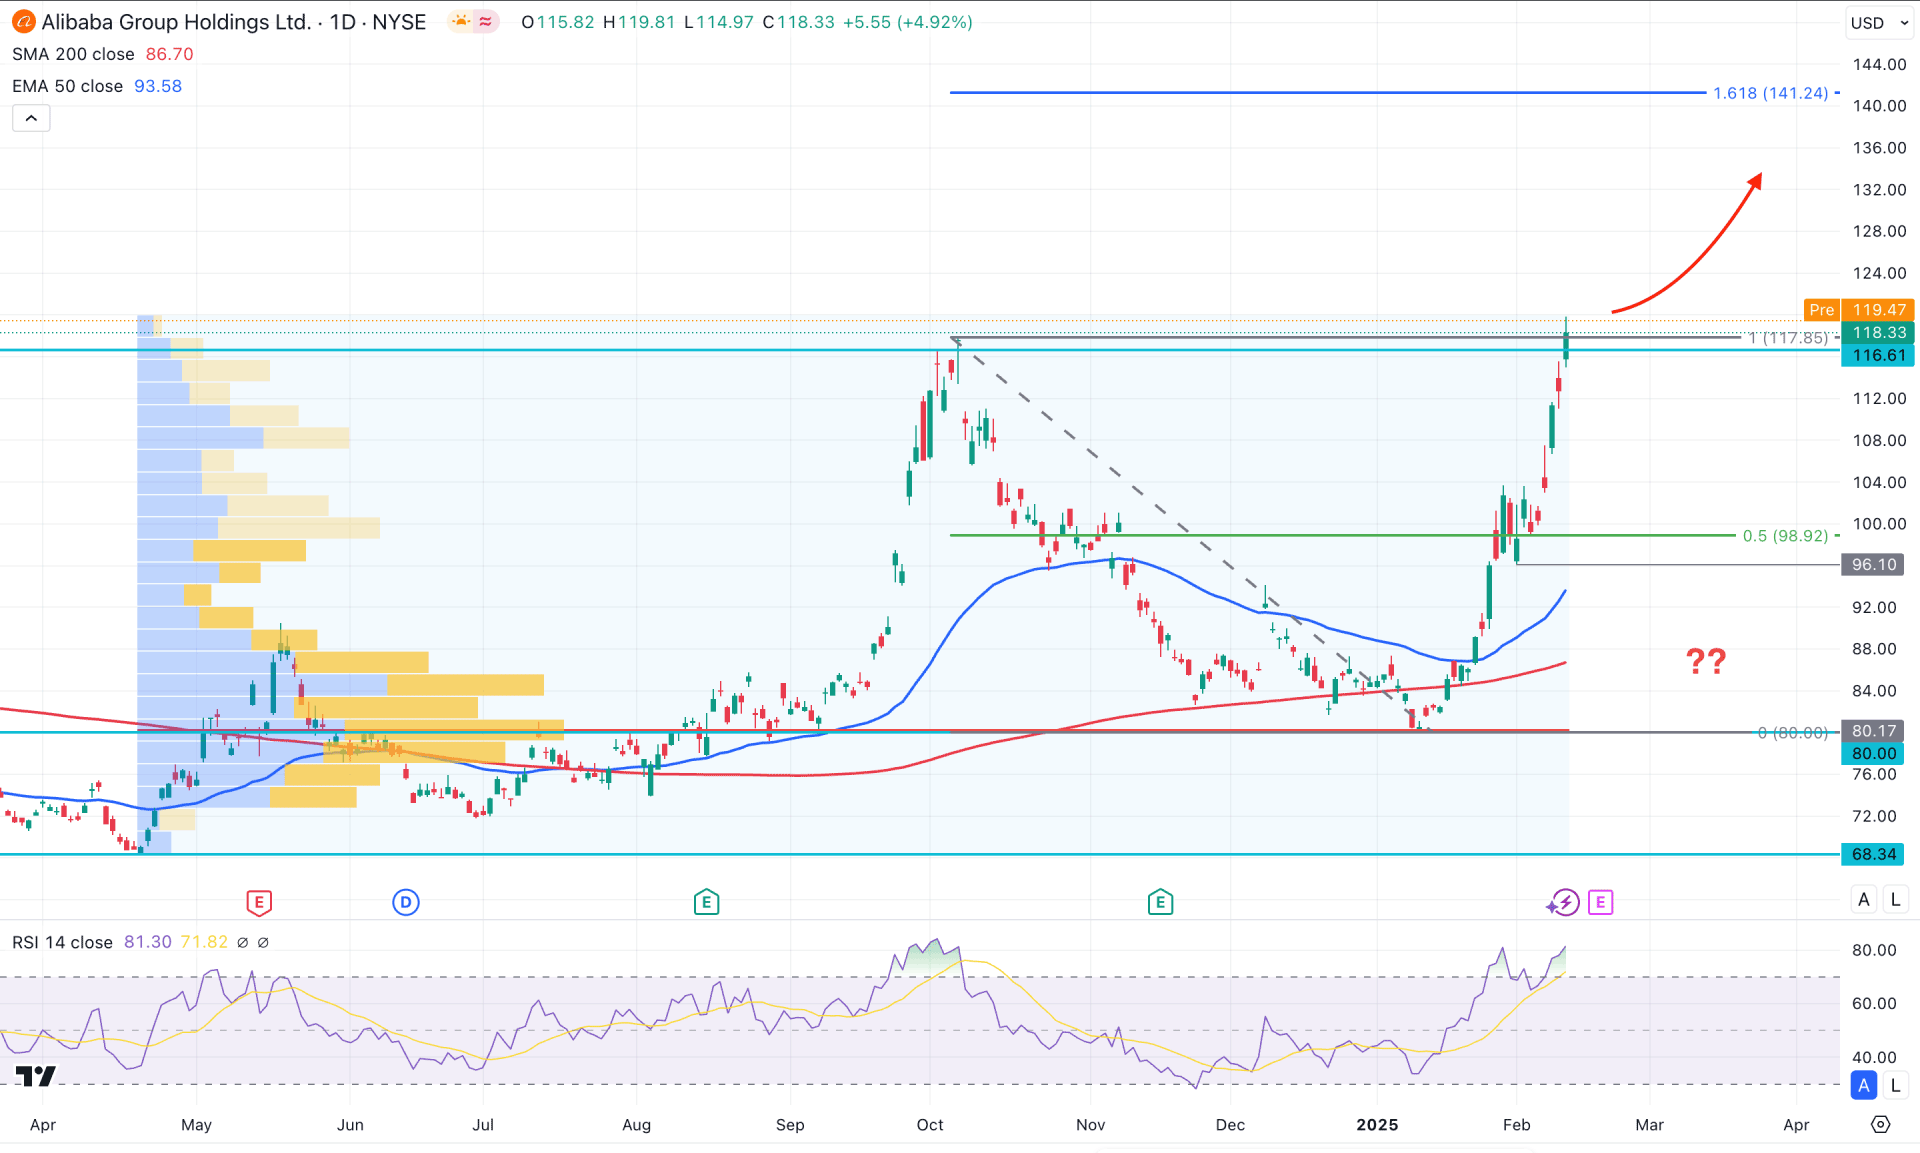
In the main chart, the broader market momentum is bullish, followed by a false break below the 200-day Simple Moving Average. Price grabbed enough liquidity from the November and December 2024 low before forming a bullish V-shape reversal. Following the current context, a bullish recovery is possible, where the 50% Fibonacci Retracement level from October 2024 to January 2025 peak could be an area to look at.
As the price has moved above the crucial swing high, a sufficient downside correction is pending. The overextended price above the 50-day exponential moving average also signals download pressure but as a correction.
In the secondary indicator window, the Relative Strength Index (RSI) maintained its bullish position for more than a month and reached its highest level in a year. This is a sign of an overbought condition, from where a decent downside recovery is pending.
Based on the current market outlook, the price is likely to grab buy-side liquidity from the October 2024 high and form a downward recovery. In that case, the 116.00 to 100.00 area would be a crucial price level to look at. Any rebound from this price area could increase the bullish possibility, aiming for the 141.24 Fibonacci Extension level.
On the other hand, a bullish exhaustion from the 118.00 to 130.00 area could increase a short opportunity, aiming for the 98.92 support level. However, the bullish momentum remains active as long as the 200-day Simple Moving Average remains below the current price. Extended selling pressure at the 90.00 level could invalidate the bullish opportunity and open the room for reaching that 68.34 swing low.
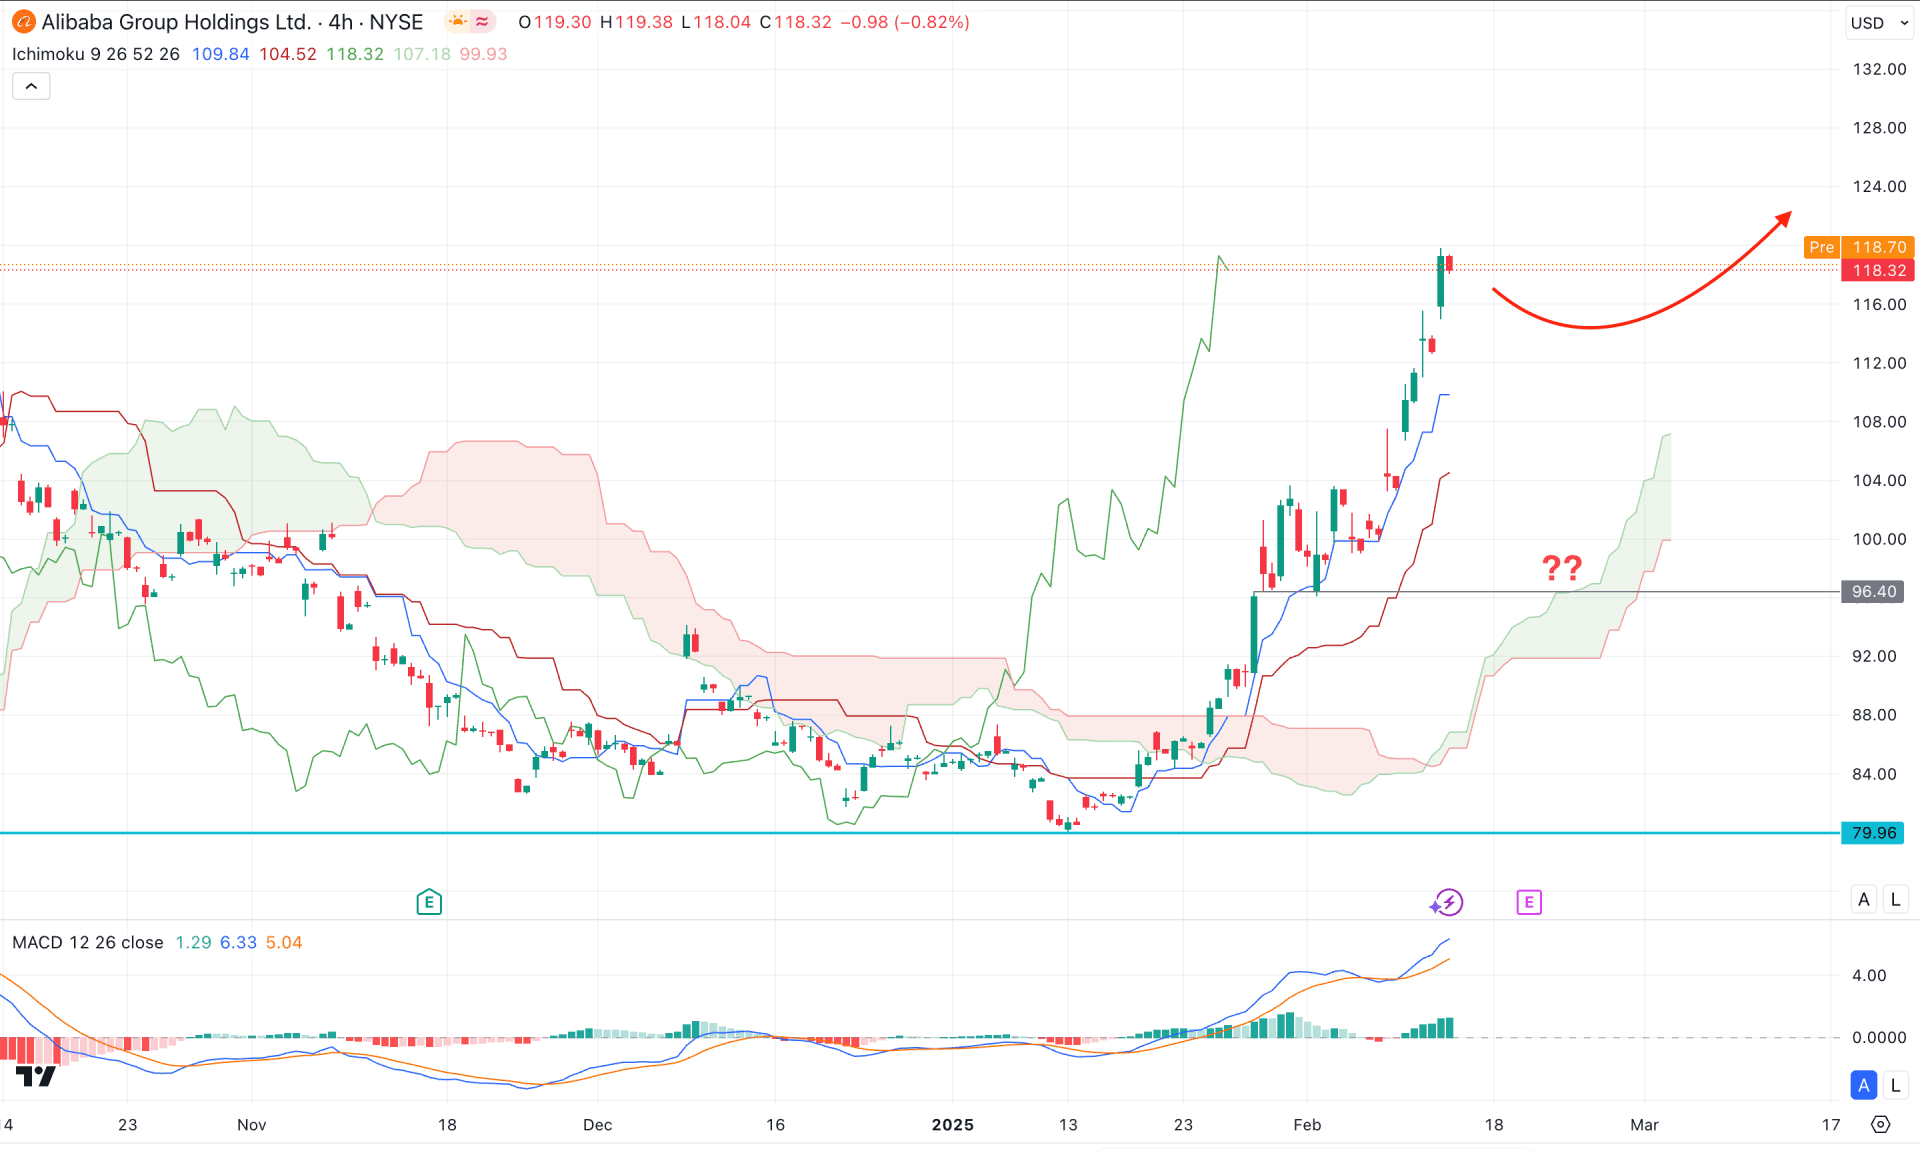
In the H4 timeframe, the sBABA is trading within a bullish trend, followed by a bullish breakout above the Ichimoku Cloud zone. Moreover, the Future Cloud looks positive, with the Senkou Span A and Senkou Span B aiming higher.
On the other hand, the bullish slope in the dynamic Tenkan Sen and Kijun Sen signals ongoing upward pressure, from which a decent downside recovery is pending.
In the indicator window, a bullish extension is visible as the MACD Signal line is hovering at the highest level in a month. Moreover, the Histogram remained bullish with a PNP formation, signaling a confluence of bullish pressure.
Based on the H4 outlook, any downside recovery could be a bullish continuation signal, aiming for the 130.00 area. However, a bullish recovery is possible as long as the Cloud zone is below the current price. A prolonged selling pressure below the 98.40 level might lower the price towards the 79.95 level in the coming session.
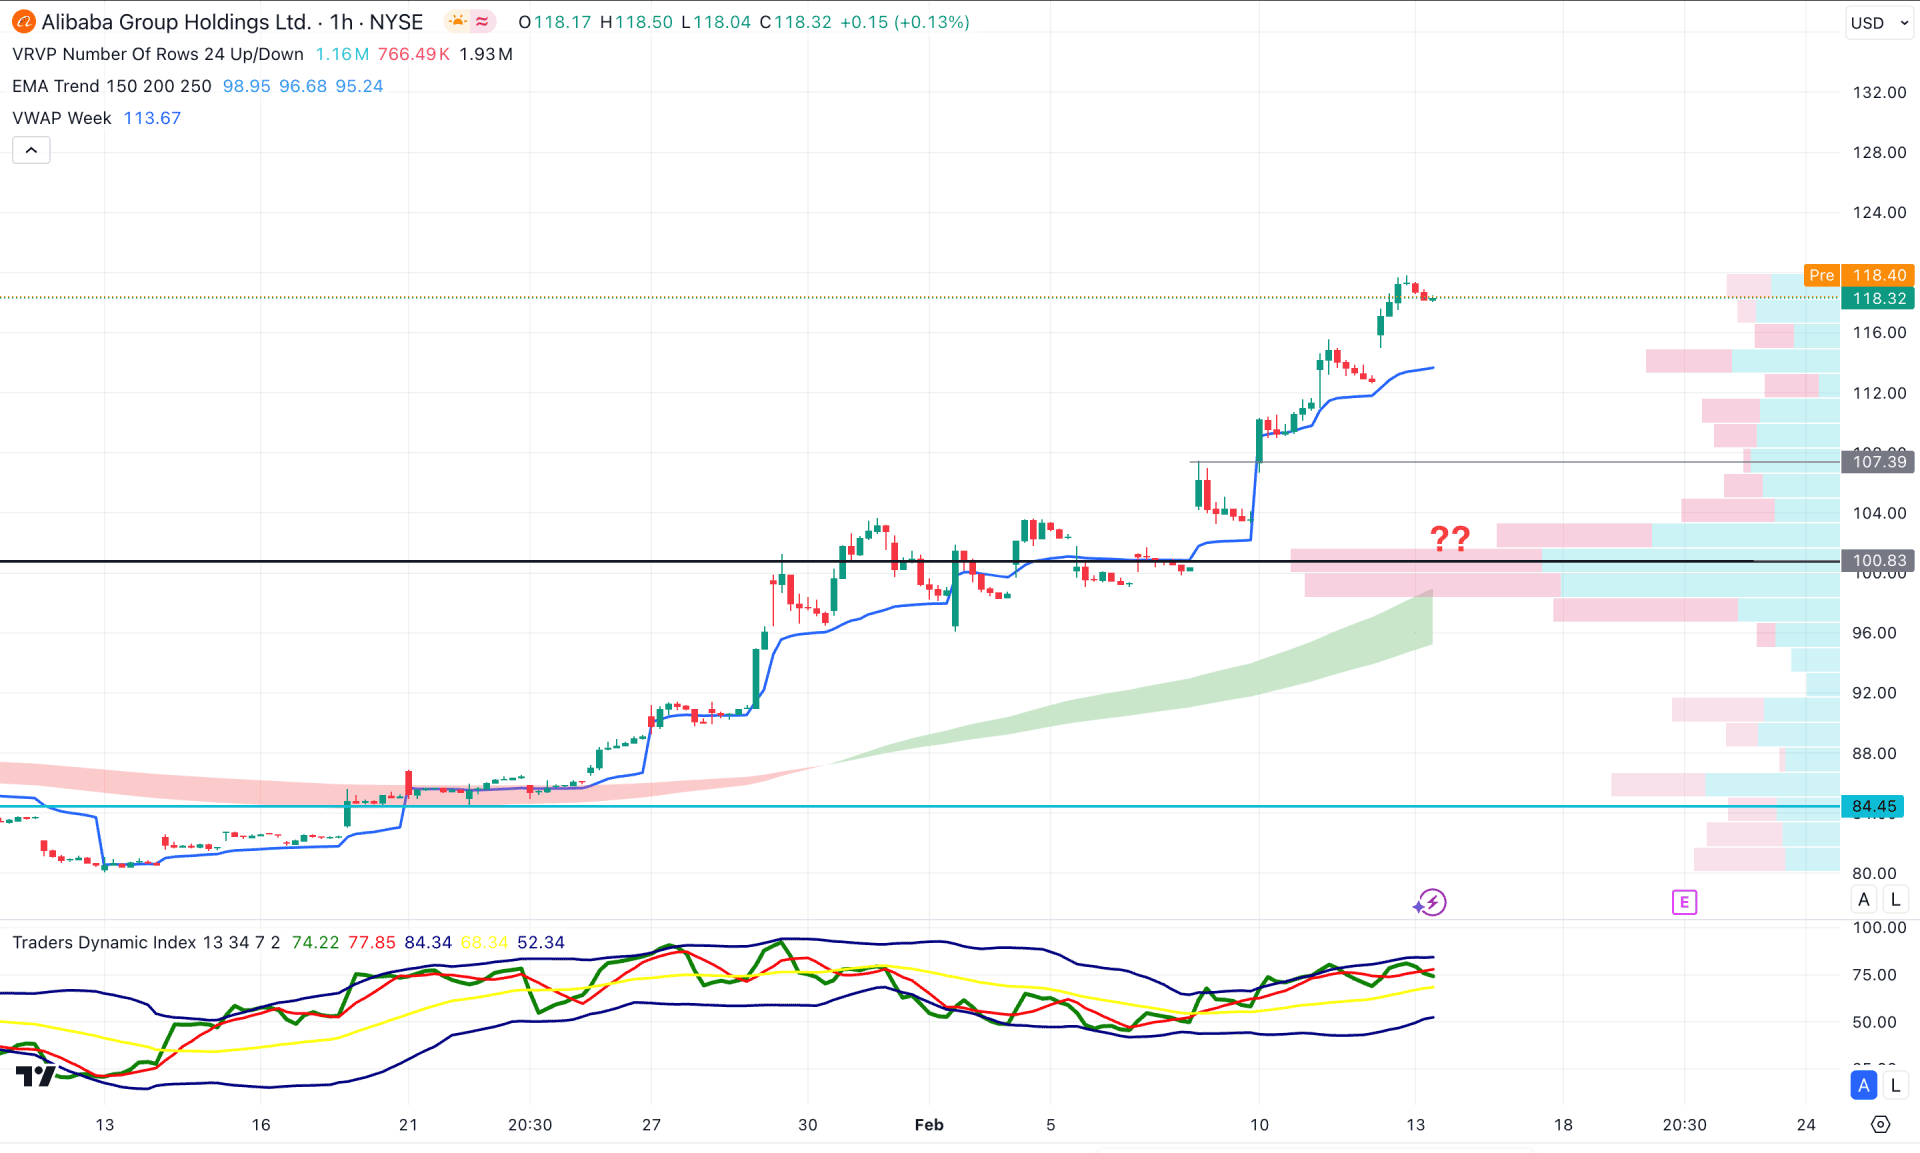
In the H1 timeframe, the bullish trend is clear as the price is aimed higher than the intraday high volume line. Moreover, the moving average wave and the dynamic weekly VWAP are below the current price and are working as major support.
In the indicator window, the Traders Dynamic Index (TDI) reached a bullish peak, suggesting an overbought market. In that case, a downside recovery is possible where the 110.00 to 100.00 area would be a crucial bullish rebound point.
On the other hand, any bearish H1 candle below the 100.00 high-volume area could be an alarming sign to bulls as it might lower the price towards the 84.45 level.
Based on the above findings, Alibaba Stock (BABA) is more likely to increase its upward pressure and create a new multi-year high. However, the recent bullish recovery needs proper validation from the 2024 high before approaching a long signal.


