Published: January 16th, 2025
The Algorand (ALGO) price showed a remarkable gain this week, supported by the existing bullish wave. According to research, the expansion of asset tokenization on Lofty was the main factor behind the 34.6% rise. As a result, the Total Value Locked (TVL) in the Real World Asset (RWA) increased from $57 million to $77 million in the latter half of last year.
Furthermore, Algorand had a particularly successful year on social media at the end of 2024. In Q4, participation rates increased to 7.2%, a substantial increase over Q1–Q3's average of 4.3%. Most remarkably, Q4 saw 13,196 fresh followers join the community, accounting for 64.5% of X's total increase in followers for the year, as opposed to 7,251 during the first three periods combined.
The bullish prognosis is further strengthened by examining ALGO's Open Interest (OI). According to Coinglass statistics, the OI in ALGO contracts at exchanges increased to $156.46 million on Friday from $95.10 million on Tuesday, the biggest amount since December 9. A climbing OI indicates fresh buying and fresh cash entering the market, which points to an impending price surge for Algorand.
With a reading of 1.05, the greatest percentage in more than a month, Coinglass's ALGO long-to-short proportion is another positive indicator. The markets are positive because more traders are placing bets on the ALGO price rising, as indicated by this ratio over one.
Let's see the current price outlook of this coin from the ALGO/USDT technical analysis:

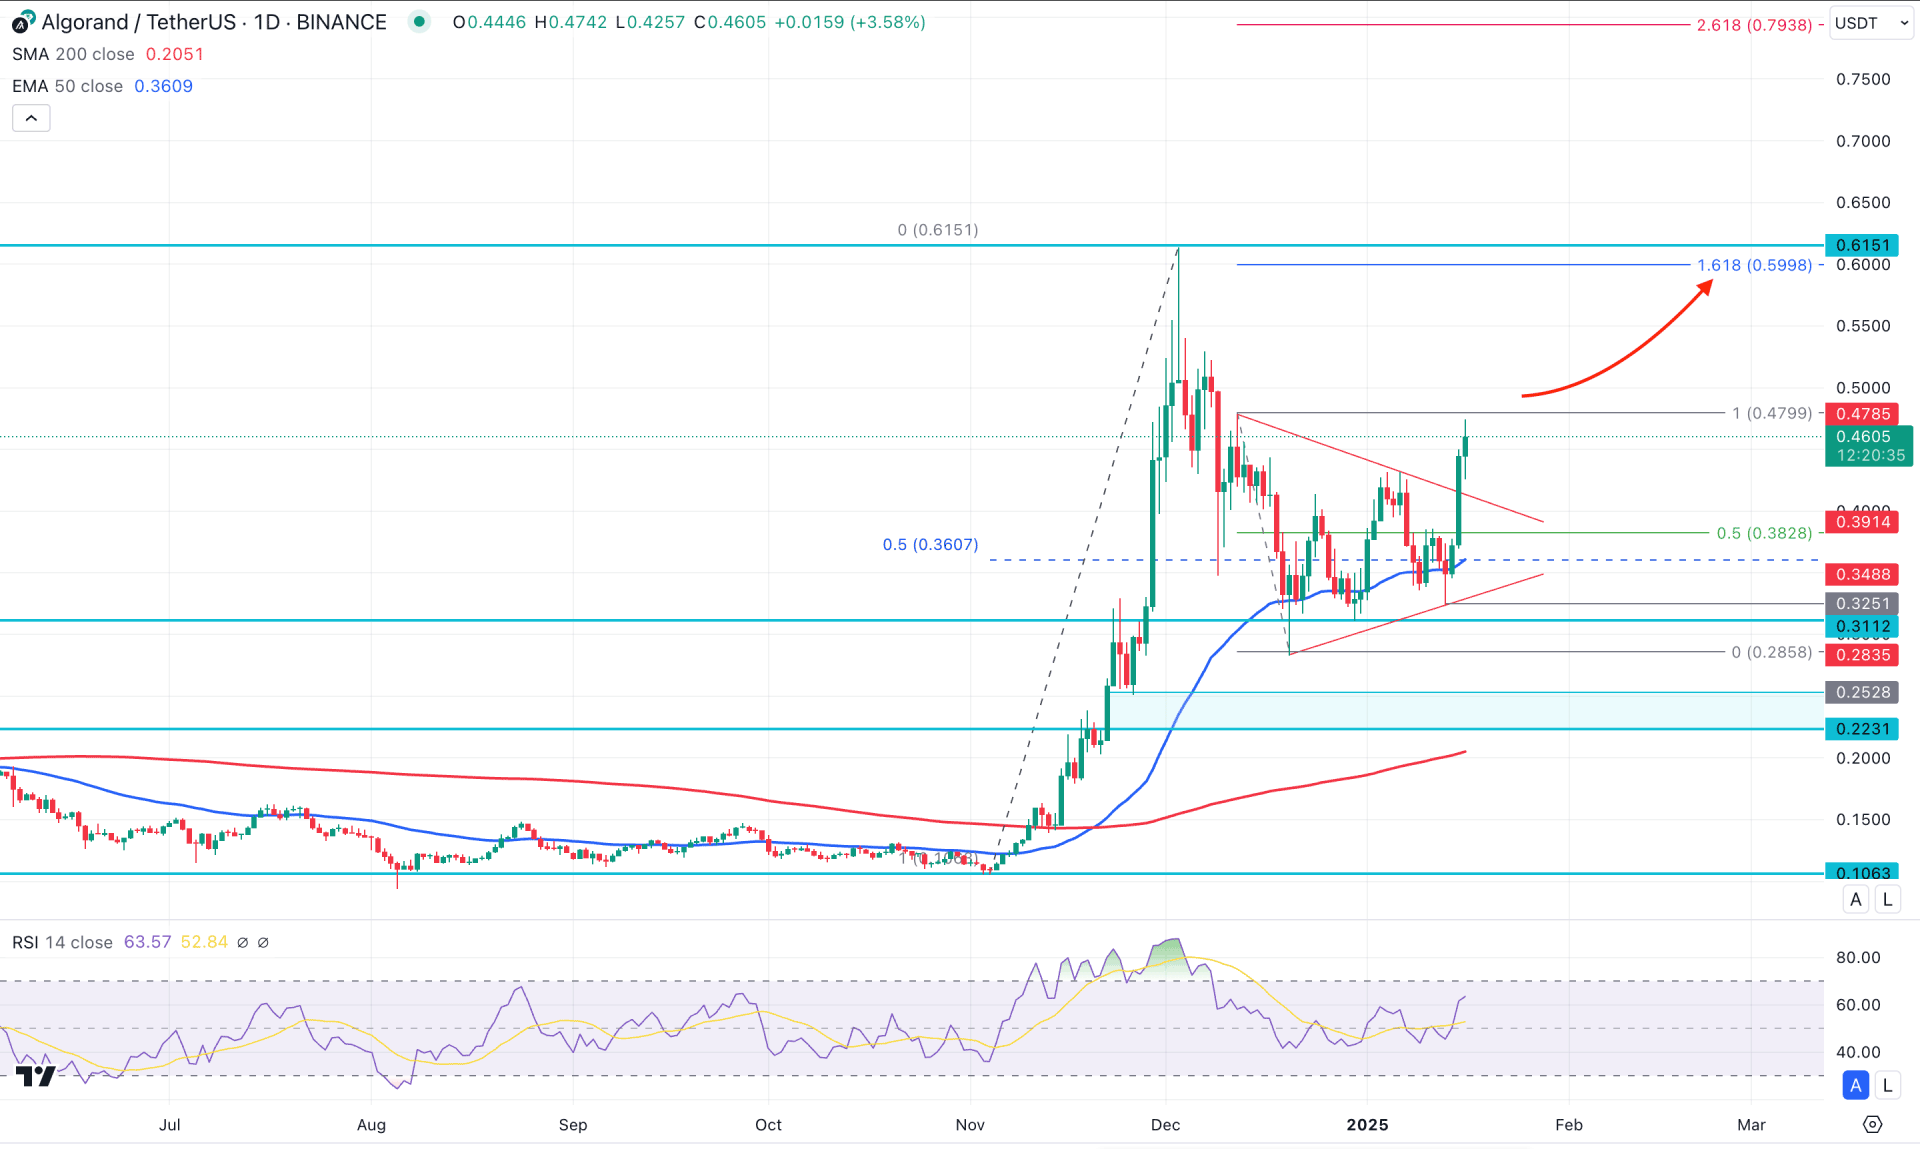
In the daily chart, the ALGO/USD kept moving higher since the November 2024 bottom, where a continuation is possible from the most recent re-accumulation phase. In the tradable range, the bottom is at the 0.1063, and the top is at the 0.6151 level. The most recent price showed a rebound and revisited the discounted zone of this range. As a sufficient bullish rejection is visible from the discounted zone with a valid triangle breakout, we may expect the bullish market to continue.
In the higher timeframe, November 2024 came as a blessing to this coin as the price broke the multi-year range and closed the month with a 314% gain. Later on, a bearish month appears but closes as an inside bar. Currently, the price is hovering above the November 2024 high, from where an inside bar continuation is likely to extend.
In the major structure, the 200 day Simple Moving Average is below the current price and working as a major support. Moreover, the 50 day Exponential Moving Average is carrying the price, suggesting a bullish breakout possibility.
In the secondary indicator window, the 14-day Relative Strength Index (RSI) showed a range breakout and aimed above the 50.00 line. However, the RSI line is yet to reach the 70.00 overbought level, suggesting pending upward momentum in the main chart.
Based on the daily market outlook, the latest bullish breakout from the symmetrical triangle breakout signalled a bullish continuation possibility. In that case, the price has a higher possibility of rising and testing the immediate resistance of the 0.6000 psychological level. The 161.8% Fibonacci Extension level from the immediate swing is at the 0.5998 level, which is closer to the above-mentioned high volume line.
On the bearish side, the swing high of 0.4799 is an immediate level to consider, as a failure to overcome this line could initiate a range bound market.
However, the bearish extension with a daily candle below the 0.3828 level could offer a short opportunity, aiming for the 0.2528 to 0.2231 imbalance zone.

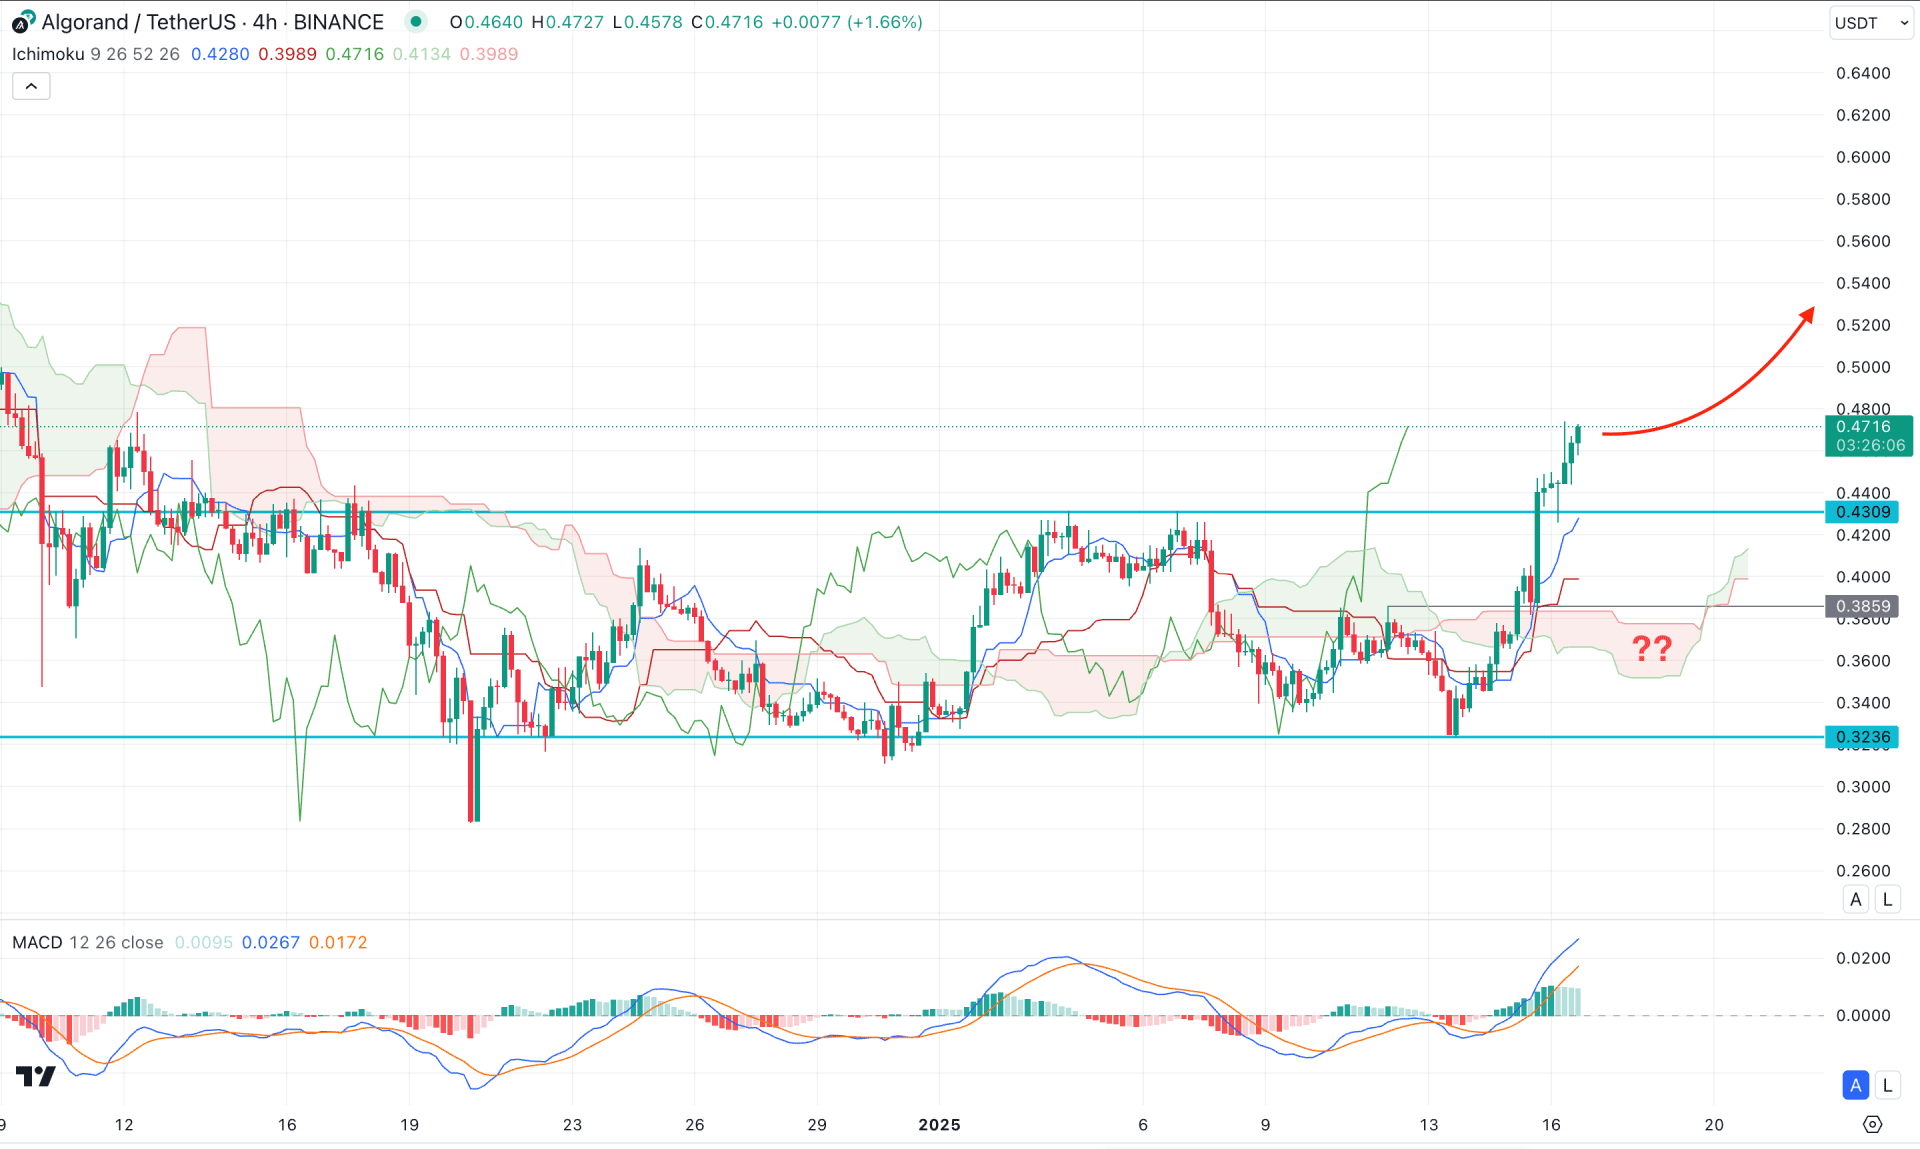
In the H4 timeframe, the ALGO/USDT has formed a bullish breakout from the range-bound market, suggesting a primary bullish momentum. Moreover, the Futures Cloud looks positive as the Senkou Span A aimed higher above the Senkou Span B.
In the indicator window, the MACD Histogram remains above the neutral zone, while the signal line remains at the overbought level.
Based on this outlook, a minor selling pressure is expected to validate the range breakout. However, the upward pressure is likely to extend as long as the range-low is protected.
On the bullish side, the upward continuation is more likely to extend and reach the 0.6000 psychological line.
On the bearish side, any immediate selling pressure below the 0.4309 static level could lower the price towards the 0.3238 level. An extended selling pressure below this line could extend the loss and find support from the 0.2600 level.

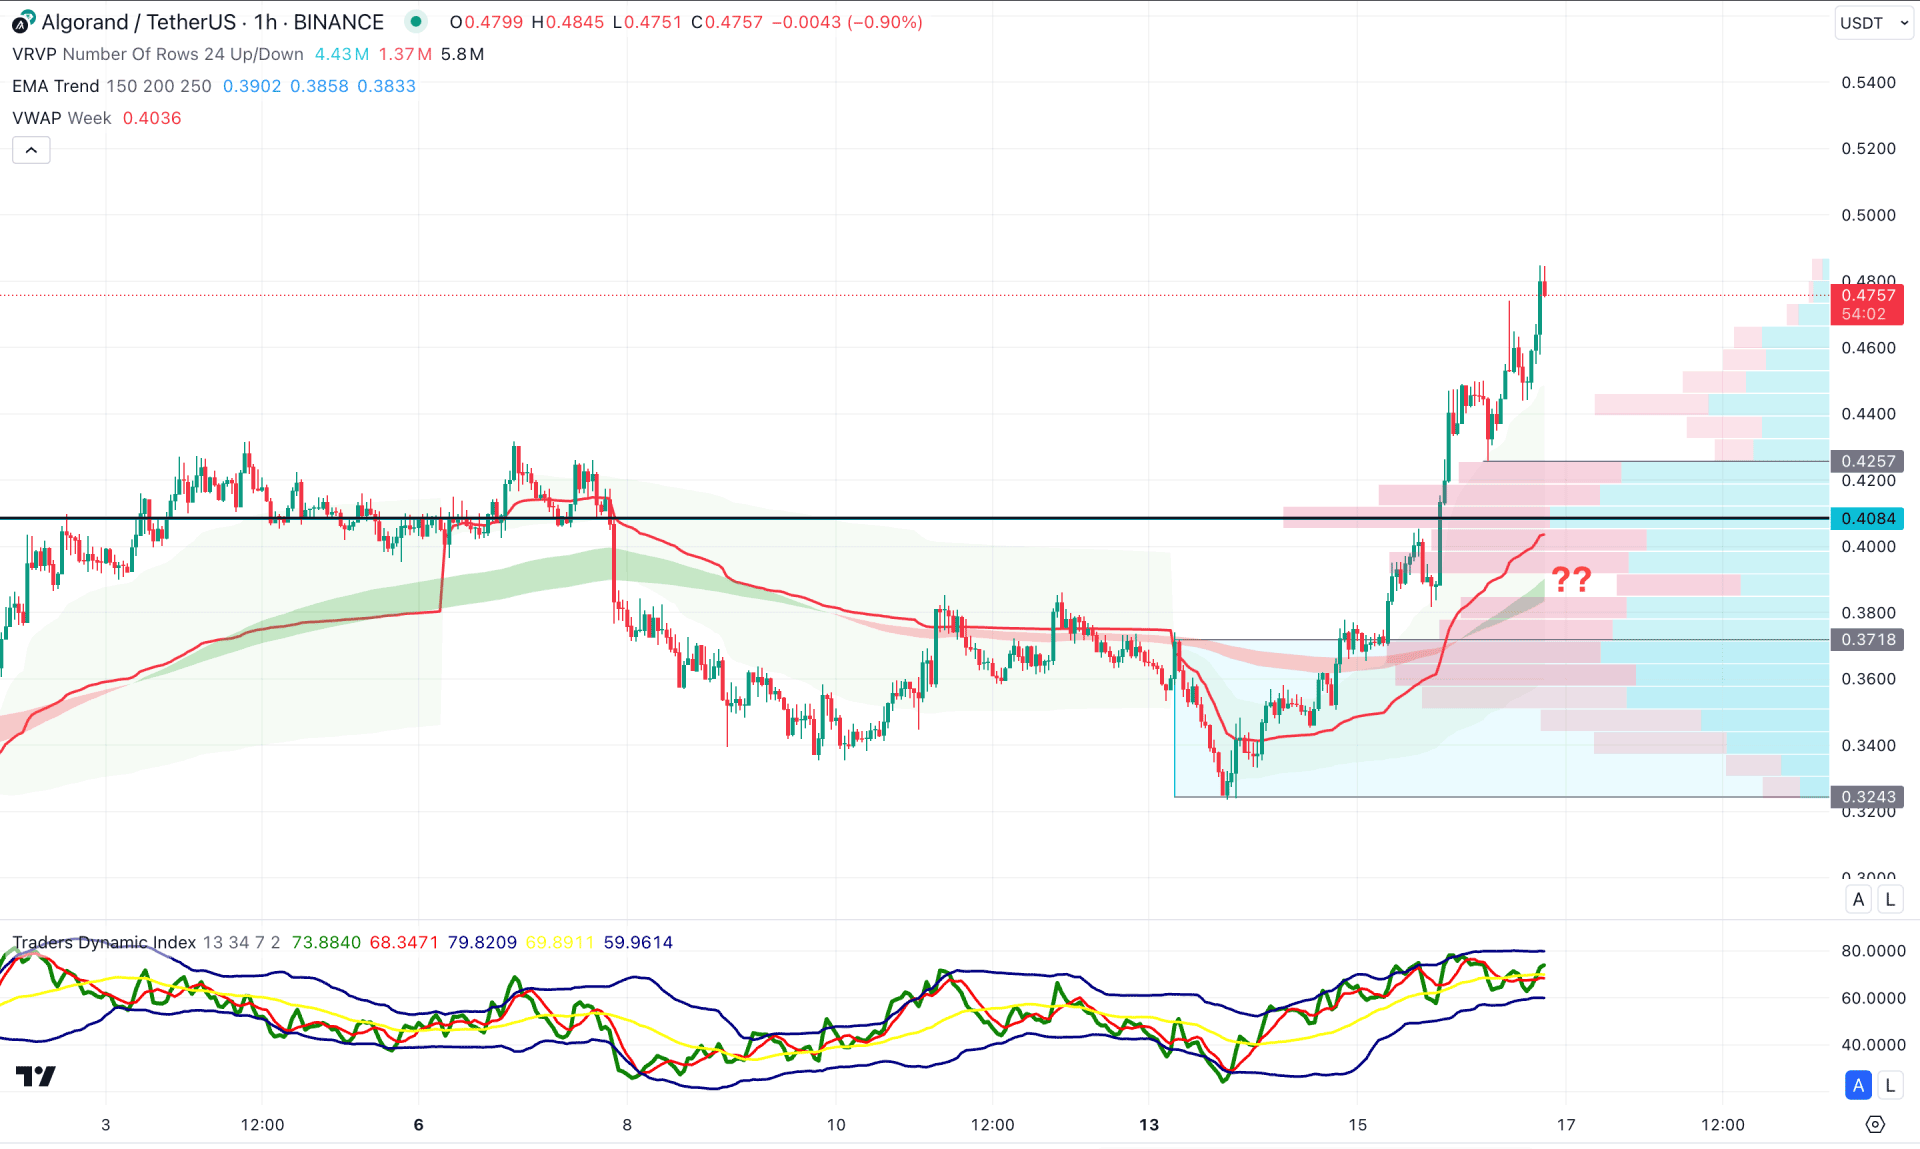
In the hourly time frame, the last selling pressure below the bullish breakout signalled a valid demand zone, which will be a crucial bottom from the buying pressure.
Moreover, the visible range high volume line is hovering below the current price, working as a support. Moreover, the weekly VWAP line showed a bullish slope from the Moving Average wave, suggesting a confluence buying pressure.
Based on this outlook, the current price is overextended from the visible range high volume line suggesting an intraday buying pressure. As the current price is hovering at the new weekly high, further bullish pressure might come once the downside correction is over.
On the bearish side, the 0.4257 level is an immediate level to look at, as a bearish hourly candle below this line could lower the price towards the 0.3600 level. Moreover, an extended bearish pressure below the 0.3600 line might extend the selling pressure below the 0.3000 psychological line.
Based on this outlook, ALGO/USDT has a higher possibility of aiming higher, from the latest bullish breakout. However, the intraday price is trading at the peak from where a decent bearish correction could offer a trend trading opportunity as a valid trend continuation.