Published: August 21st, 2024
Over the past five months, open interest — active holdings in a derivative market — has decreased for the Algorand coin (ALGO). This frequently happens in bearish markets, suggesting that there isn't much new cash stepping into the market and that it may remain bearish.
Subtle and uncomplicated, the Algorand Foundation persists in displaying its intensely competitive nature. This crypto project is a subtle but effective commercial that highlights its numerous positive achievements and features.
In addition, the Algorand Foundation released a new, witty commercial that positioned the blockchain project as superior to other leading players in the industry. The post below demonstrates how the advertisement did not hold back and instead tactfully emphasized the advantages of its blockchain ecological systems.
In fact, the ad above clearly illustrates what Algorand's rivals must contend with when Algorand customers have access to a far more enjoyable and fulfilling journey through the blockchain network, like Solana (SOL), Ethereum (ETH), and Bitcoin (BTC).
Let's see the further aspect of this coin from the ALGO/USDT technical analysis:

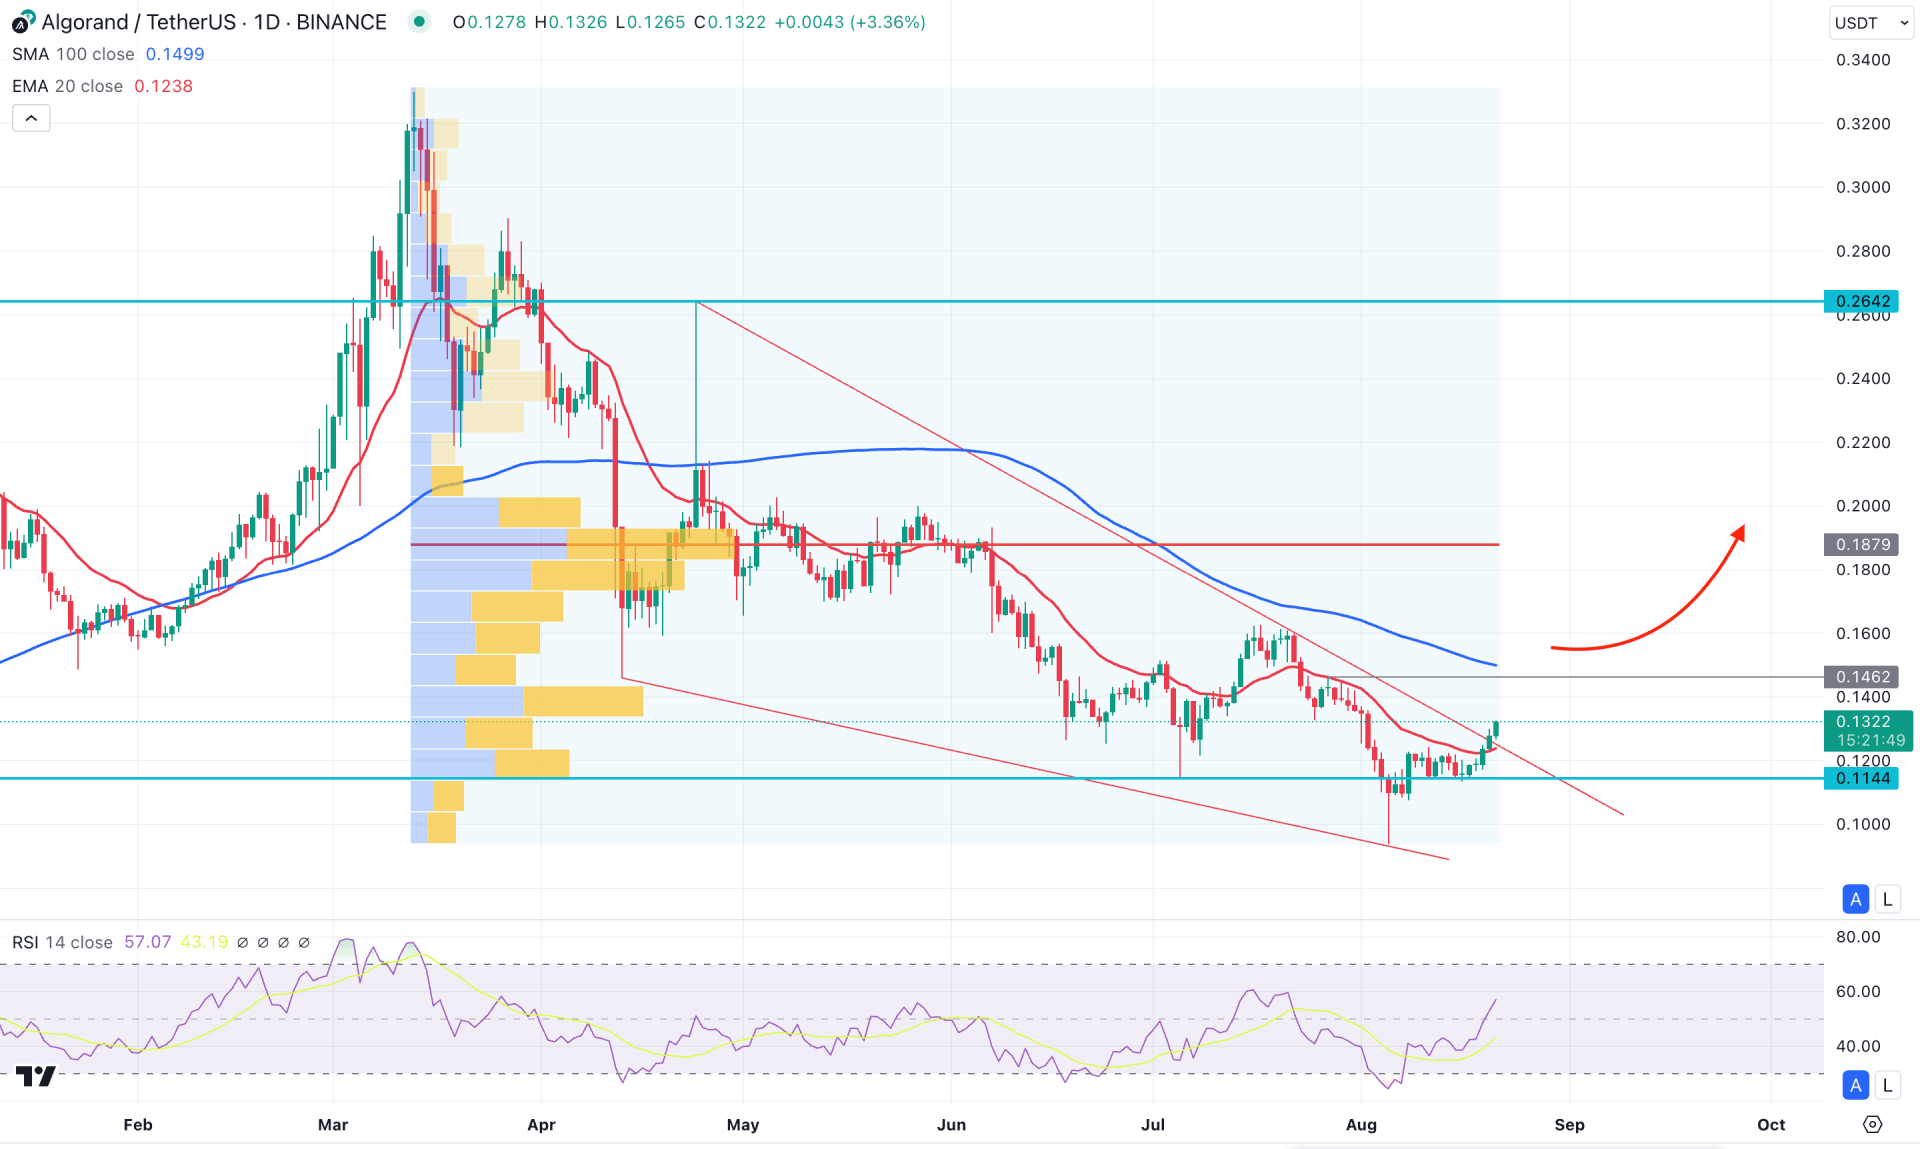
In the daily chart of ALGO/USDT, the ongoing market momentum is corrective. The recent price shows a decent sell-side liquidity sweep with an immediate bullish reversal. In this context, investors should closely monitor how the price trades as valid bottom formation could validate the bullish reversal.
In the higher timeframe, an extreme corrective structure is visible, where the most recent monthly candle remains sideways with a doji formation. However, the July 2024 low is taken out with an immediate recovery. A clearer picture is visible in the weekly timeframe, from where a bullish pressure is present from a valid candlestick formation.
The current buying pressure needs more confirmation in the volume structure as the current high volume level since March 2024 is at 0.1879 level, which is above the current price. In that case, a bullish recovery with a valid candle close above this line could increase the bullish possibility in this pair.
In the main chart, the corrective downside pressure remained sideways before moving above the trendline resistance. As a result, a falling wedge breakout formed, creating a primary bullish reversal opportunity. Moreover, the price exceeded the 20-day Exponential Moving Average, creating an additional buy signal.
In the indicator window, the Relative Strength Index (RSI) moved above the 50.00 level before reaching the 30.00 bottom.
Based on the daily market outlook of ALGO/USDT, there is a bullish recovery with a stable market above the 100-day Simple Moving Average. In that case, the buying pressure could extend and find resistance at the 0.2642 level. On the other hand, the high volume level is still above the current price. In that case, a bearish reversal from the 0.1600 to 0.1879 zone with a daily close below the 20-day EMA could lower the price toward the 0.1000 psychological level.

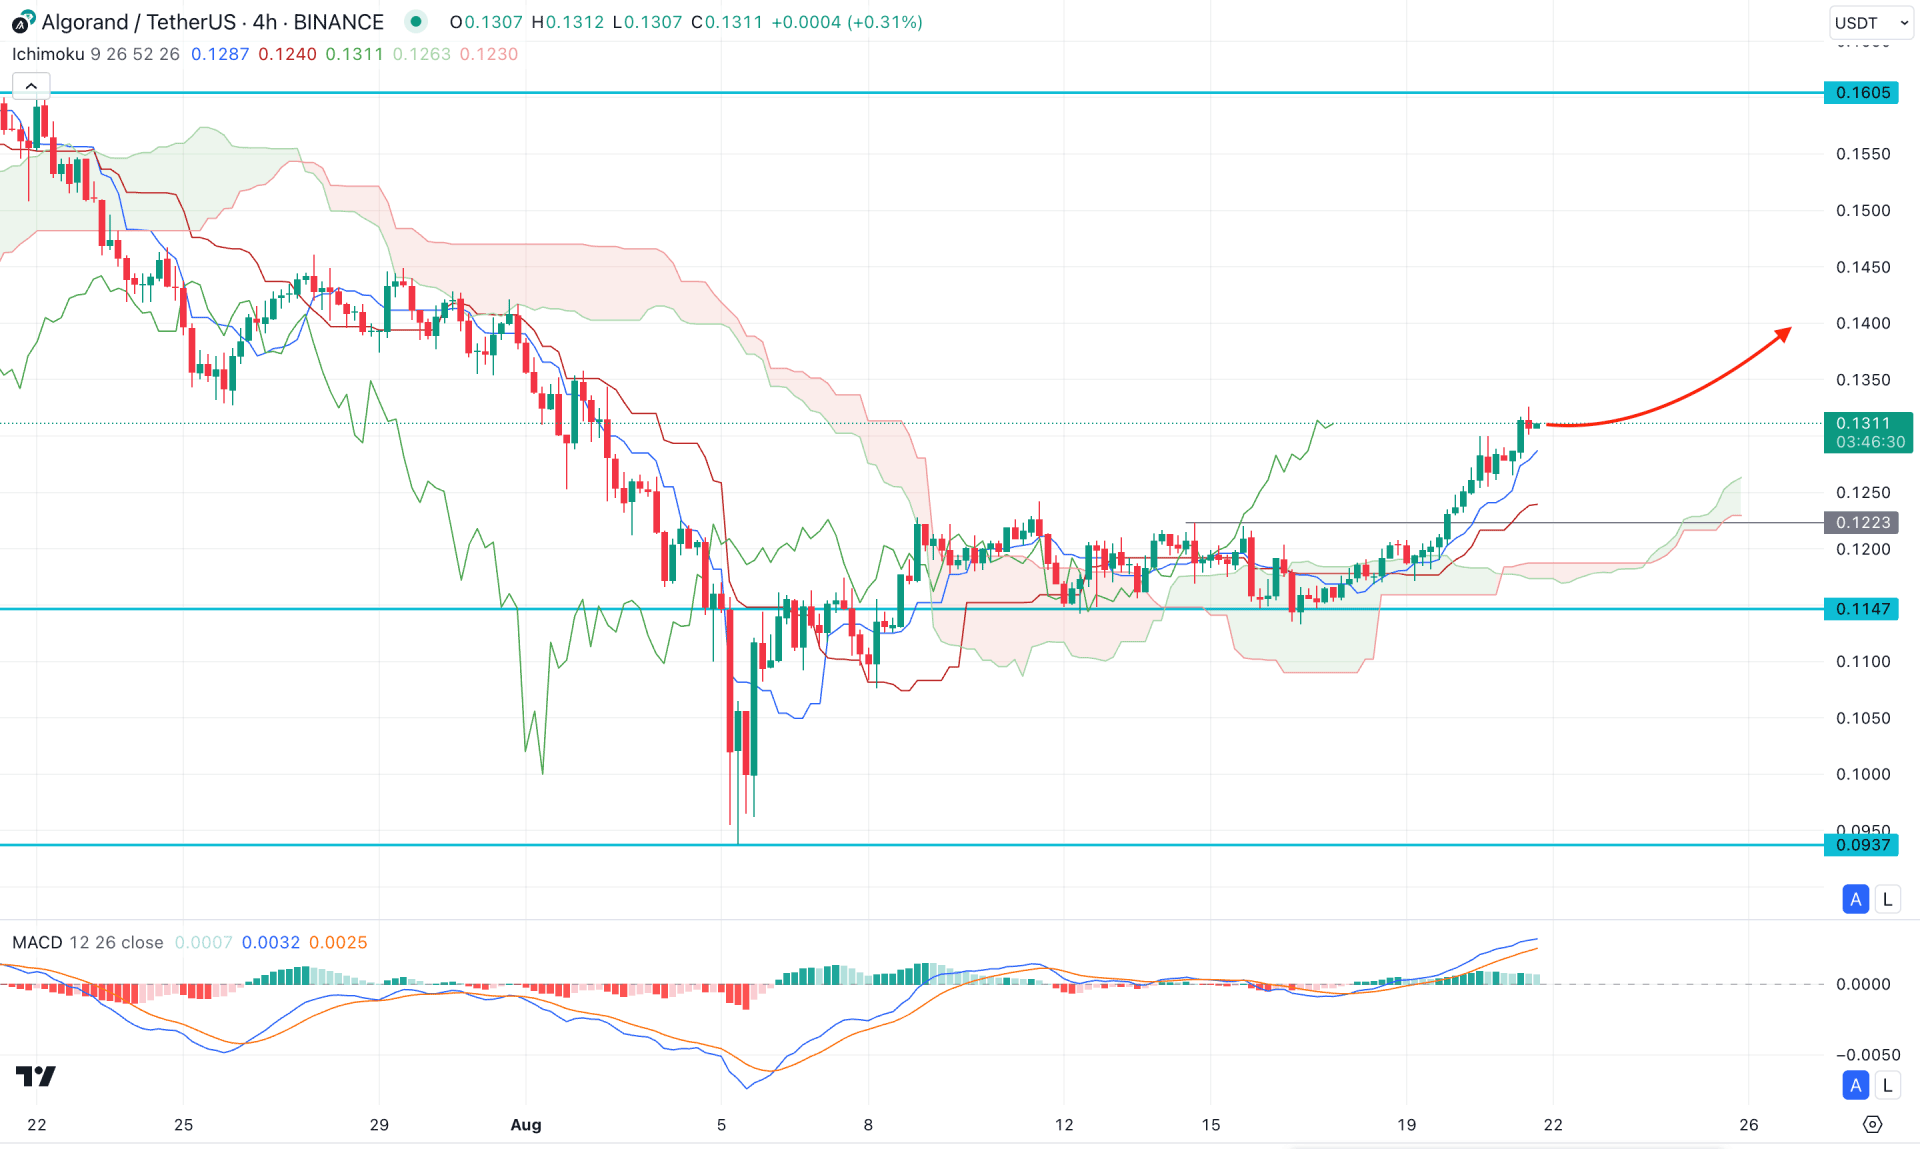
In the H4 timeframe, a valid bullish recovery is present above the cloud zone, while the current price remains within the discounted area. In that case, bulls have a higher possibility of taking the price on their side but it needs a valid confirmation from the candlestick formation.
The indicator window shows a different story, where the MACD Signal line peaked at the highest level in a month. Also, the Histogram became weaker and moved to the neutral point, suggesting a profit taking.
Based on the H4 structure, the price consolidates before forming a cloud breakout, which might signal as a strong continuation opportunity. However, no sufficient downside correction is seen from the Kijun Sen breakout, suggesting a pending correction.
In this context, investors might expect a bullish continuation once the profit taking is over. In that case, a bullish reversal from the near-term Kijun Sen support or a range breakout could open the possibility of reaching the 0.1605 resistance level.

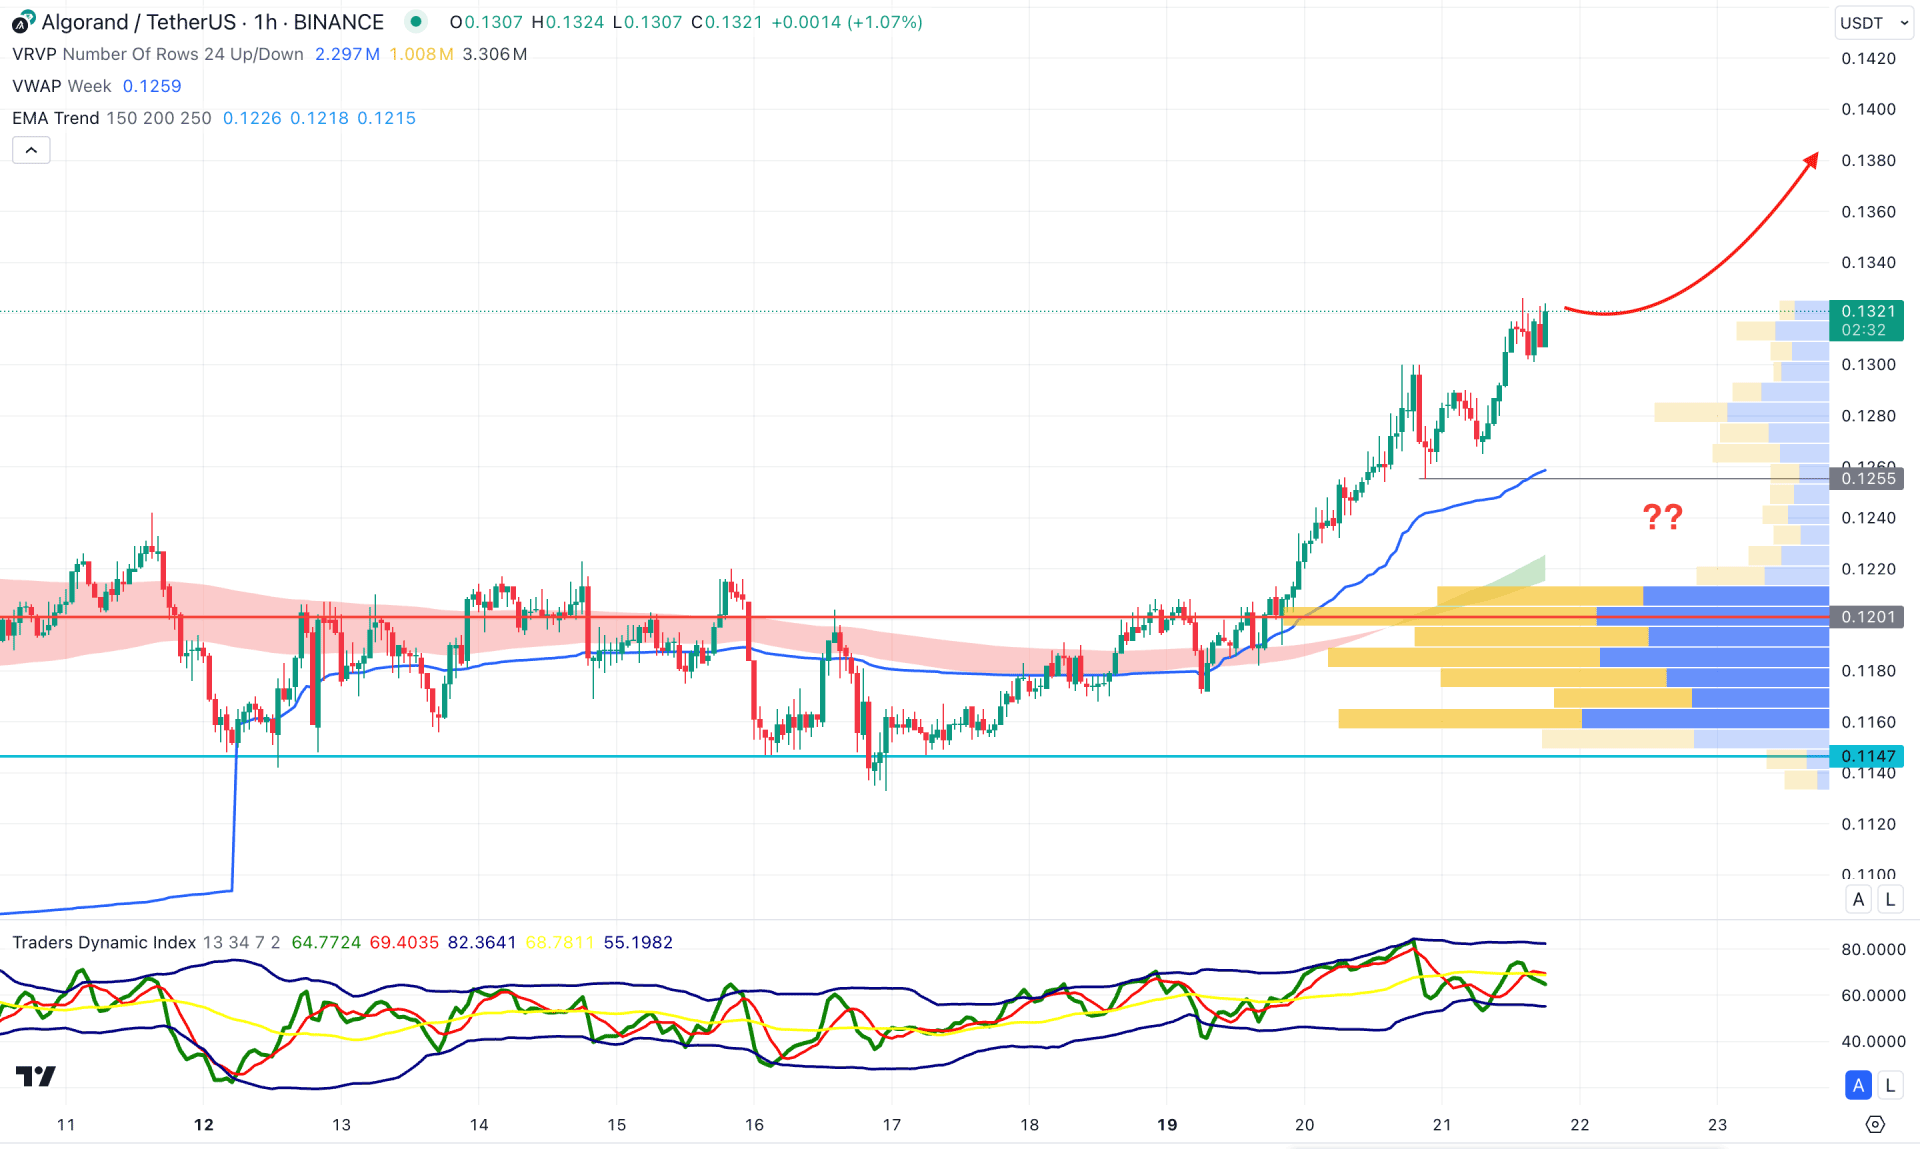
In the H1 timeframe, the recent price showed a valid bullish range breakout, suggesting a continuation opportunity. The dynamic EMA cloud consists of MA 150 to 250 is below the current price with an upward slope. Also the weekly VWAP remains steady, with a bullish break at the 0.1255 support level.
On the other hand, the Traders Dynamic Index (TDI) remains sideways below at the 50.00 area, suggesting a corrective momentum in the main chart.
Based on the hourly structure, the bullish possibility is valid as long as the high volume level remains below the current price. In that case, any bearish recovery could be a trend continuation signal. However, the current price is way above the weekly VWAP level from where a downside correction is pending towards the 0.1255 level. Overall, a valid bullish reversal from the 0.1270 to 0.1200 zone could be a bullish opportunity, where a break below the 0.1200 level could enter the sell zone.
Based on the current market context, ALGO/USDT is more likely to extend the buying pressure from the falling wedge breakout. However, investors should monitor how the price reacts above the wedge support as a proper bullish recovery is needed to anticipate the long move.