

Published: August 25th, 2026
The Algorand ecosystem is currently undergoing a convergence of revolutionary advancements that will firmly establish it as a pioneer in the next generation of blockchain infrastructure. The most important of these is the successful activation of the Algorand v5.0.0 mainnet upgrade, a huge technological accomplishment that went live on August 22, 2026.
This crucial component safeguards the network against the impending threat of quantum computing, helping ensure the security of digital data and transactions for years to come. Additionally, the upgrade adds a resource-based pricing approach and more than doubles smart contract size restrictions, greatly increasing the network's ability to run complex decentralized apps.
Algorand's ambitious objective to achieve broad quantum resilience by 2027 has been mentioned in public conversations. Although Algorand's mainnet is not used for this particular pilot, the public connection places it in the same discussion about quantum readiness, which is very appealing to institutional partners.
Beyond quantum safety, Algorand is becoming known as a major player in government blockchain initiatives. This is because it promotes sustainable, non-speculative network utilization and supports the long-term thesis.
Let's see the full price action from the ALGO/USDT technical analysis:
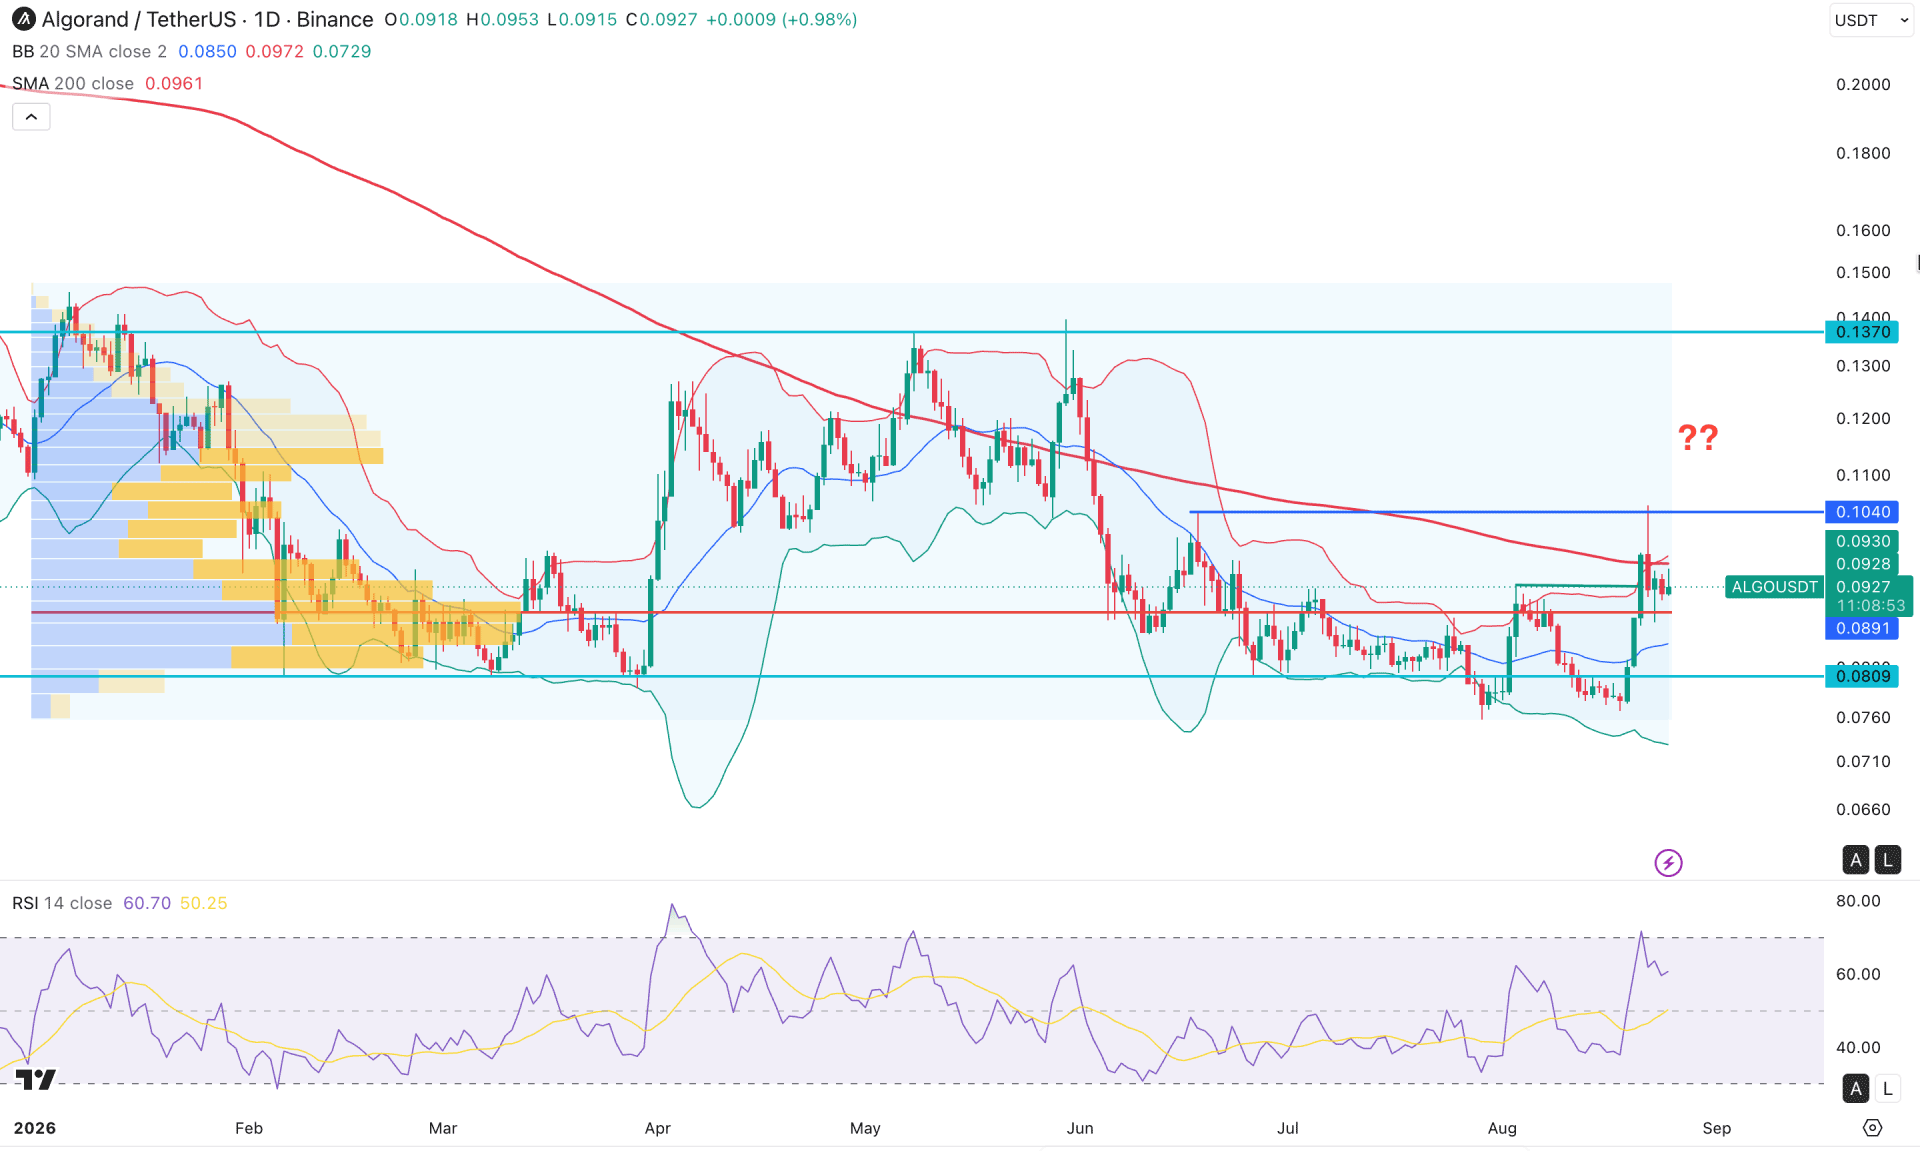
On the daily chart, ALGO/USDT has recently shown a bullish rebound following strong bearish pressure, indicating a potential trend-reversal opportunity. However, the latest price action is testing near-term resistance following a buy-side liquidity sweep. This may indicate bullish exhaustion near the top and increasing selling pressure against buyers.
From the higher-timeframe perspective, price is still trading near the all-time-low region. The current monthly candle is hovering above the previous monthly high, but the overall structure remains within an inside-bar formation.
Therefore, despite the relatively low price near the all-time-low area, the monthly chart does not yet provide sufficient confirmation for a bullish outlook. The weekly timeframe is showing some bullish reaction, but further confirmation is needed before anticipating a trend reversal.
In terms of volume, the most active level since January 2026 is around 0.0891, which is slightly below the current price. However, recent price action has been highly volatile above this high-volume support level, signaling a possible downside correction.
On the main price chart, bullish exhaustion is visible as price moved beyond the upper Bollinger Band resistance and failed to sustain momentum. As a result, bearish exhaustion has formed around the 0.1040 level, followed by an immediate bearish recovery below the upper band.
On the other hand, the 200-day Simple Moving Average has been tested, followed by a valid bearish reaction from this crucial resistance line, signaling possible selling pressure in the market.
The Relative Strength Index remains above the 50.00 neutral level after testing the 70.00 overbought area. Trend strength remains solid, as the Average Directional Index is currently at 25.72 and has rebounded from its mid-July low.
Based on the overall market structure, the recent bullish attempt is losing momentum near the top as price has failed to break above the crucial 0.1040 resistance level. Since multiple bearish signals are visible from this resistance area, close attention is needed around the 0.0891 support level. A failure to hold above this level, confirmed by a daily candle close below 0.0891, could offer a bearish opportunity targeting the 0.0740 area.
On the other hand, a rebound from the near-term support area, followed by a recovery above the 0.1040 level, could increase the possibility of a bullish continuation toward the 0.1370 resistance level.
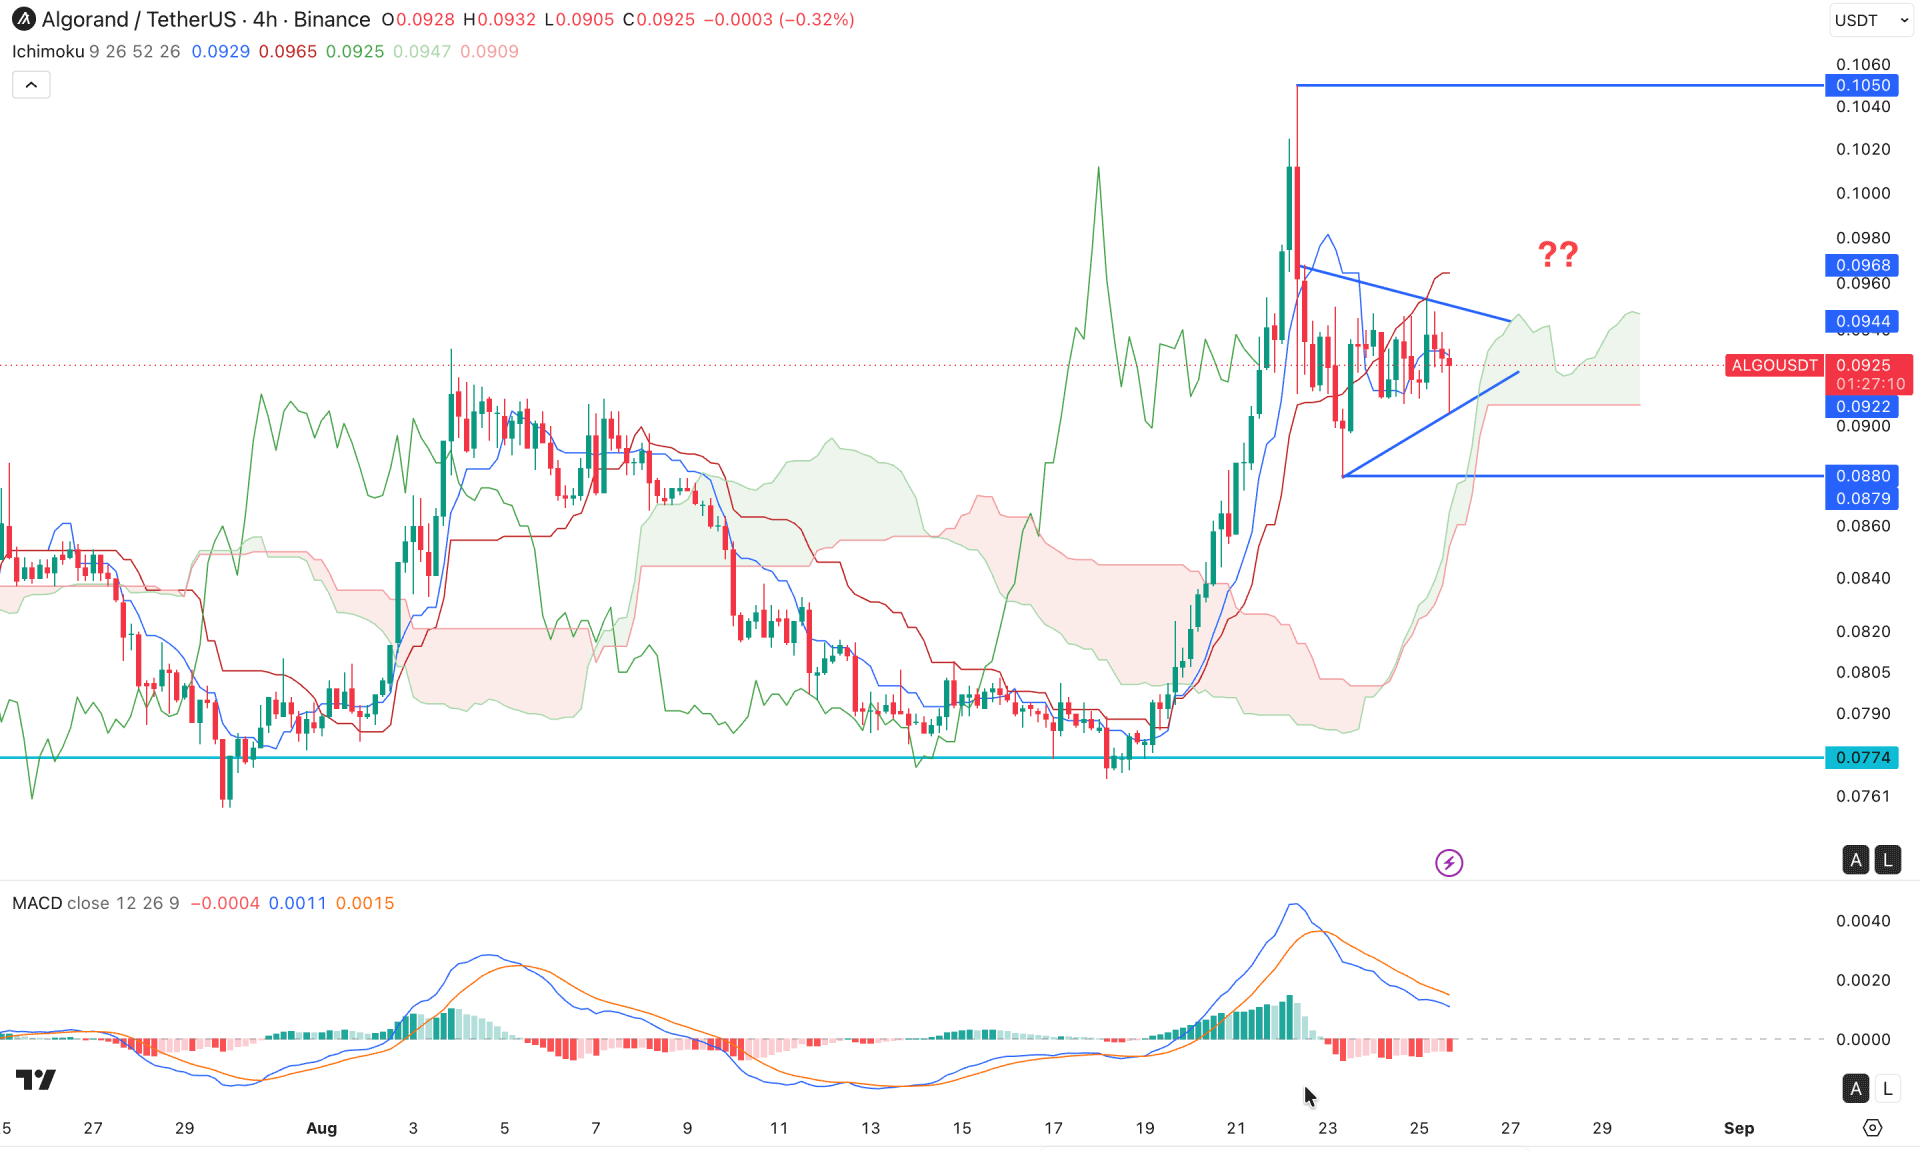
On the four-hour timeframe, the overall price action remains bullish, although the recent price is moving sideways after creating a new swing high above the previous high. However, after forming a top near the 0.1050 level, immediate bearish pressure has appeared around the 50% retracement level.
The current price is still holding above cloud support, while the future cloud remains positive on the right side. Moreover, recent price action is moving sideways within a symmetrical triangle pattern, signaling extended corrective momentum.
The indicator window shows a different scenario. A bearish reversal is visible through an EMA crossover near the top, with multiple red histogram bars below the neutral line.
Based on this outlook, corrective price action after sweeping liquidity from the recent high could lead to a bearish trend continuation. As price is currently trading within a symmetrical triangle pattern, a valid bearish breakout below the 0.0880 swing low could increase the possibility of testing the 0.0774 area.
On the other hand, sufficient buy-side liquidity is present below the triangle support. In that case, a rebound from the 0.0922–0.0850 support area could increase the possibility of creating a new swing high above the 0.1050 level.
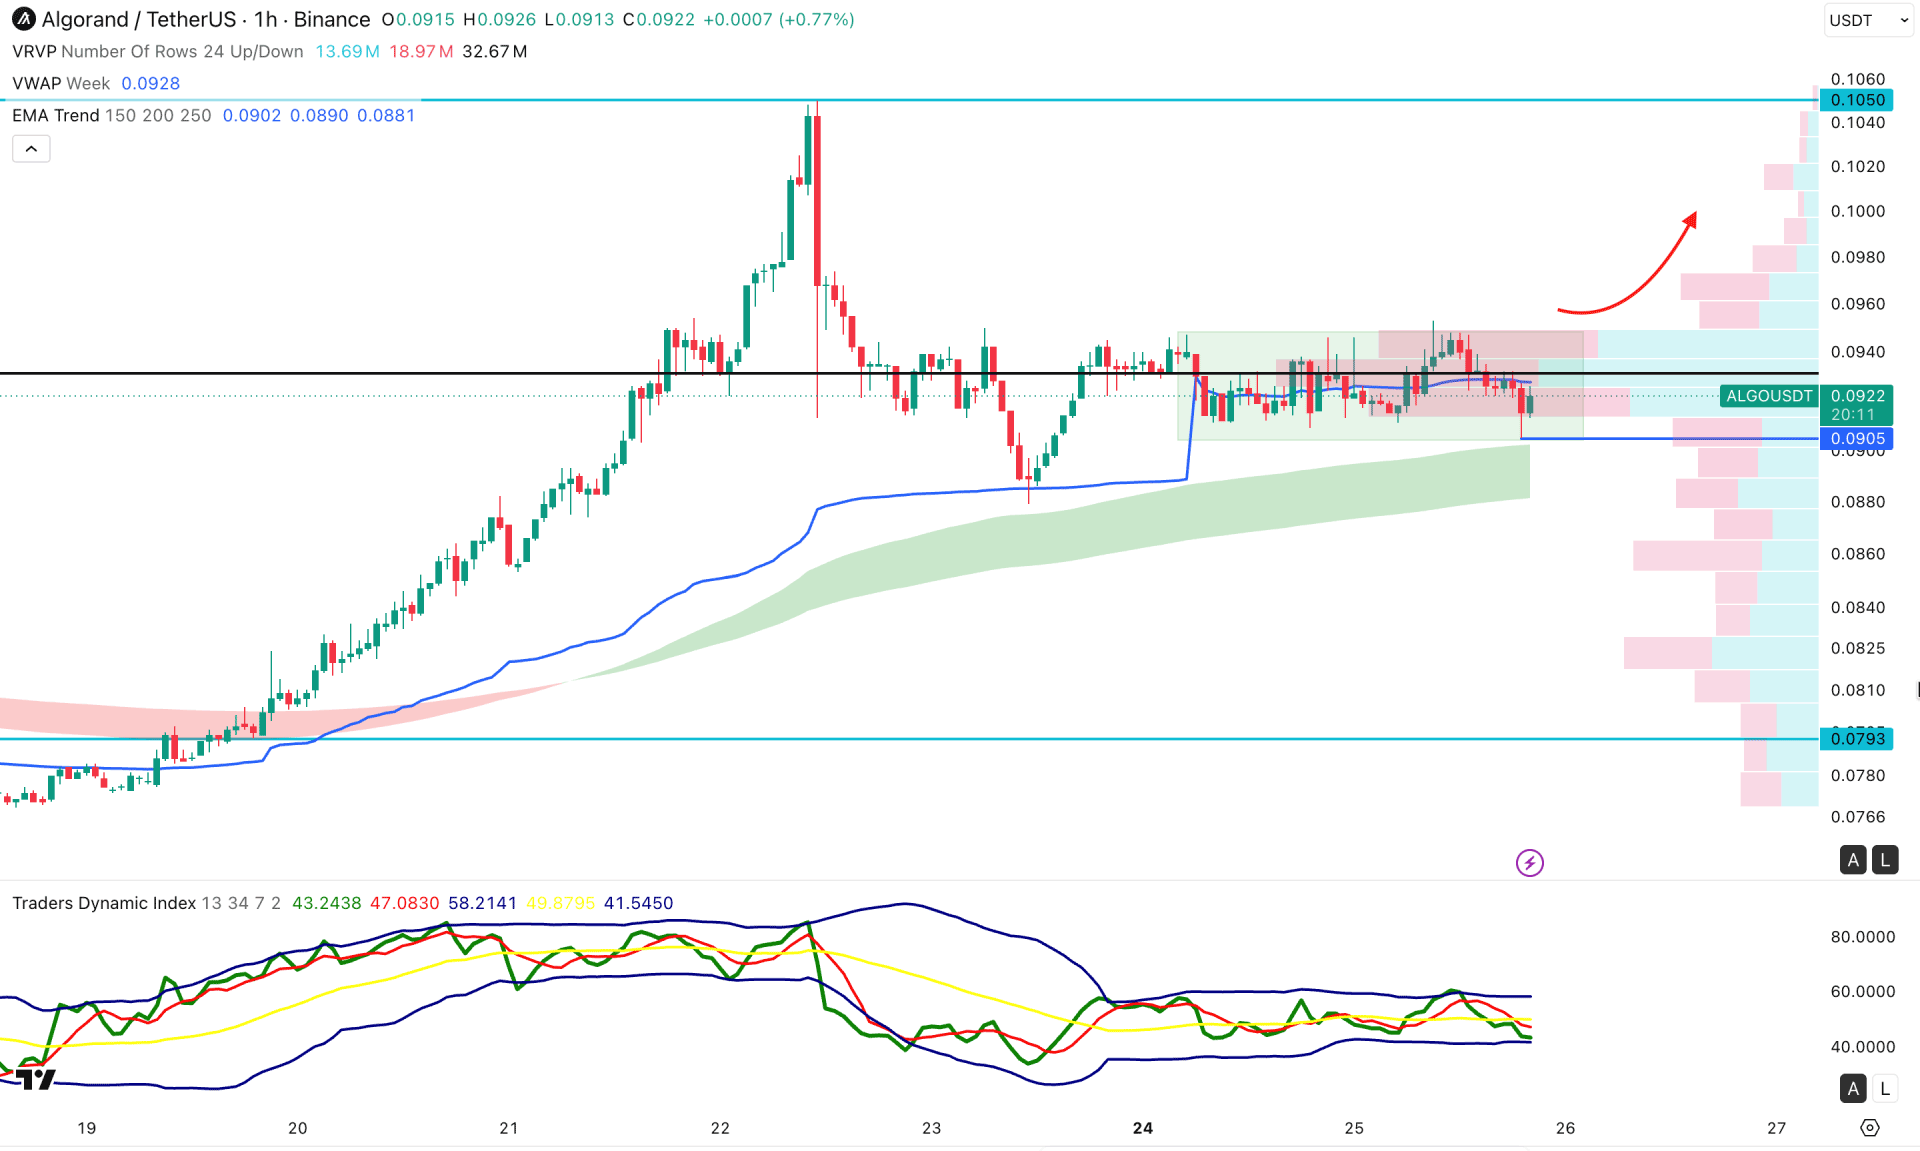
On the hourly timeframe, a corrective momentum is visible after forming a new intraday high. An ongoing rectangle pattern is visible, with price currently testing rectangle support near the 0.0905 level.
On the main price chart, multiple bearish signals are visible below the weekly VWAP level, while the EMA is acting as a major barrier for sellers.
In the secondary indicator window, the Traders Dynamic Index indicates selling pressure, as the current TDI line is hovering near the bearish zone.
Based on this outlook, failure to hold above the 0.0905 support level could increase the possibility of testing the EMA-wave support before an extended downside correction toward the 0.0793 level.
On the other hand, immediate bullish price action followed by a rebound above the 0.0949 high could provide a potential long opportunity targeting the 0.1100 area.
Based on the overall market structure, ALGO/USDT is showing bullish movement from an extreme swing low; however, this remains insufficient to confirm a complete bullish trend reversal. As the current price is volatile near the top, failure to hold above intraday support could validate a pump-and-dump scenario before the broader bearish trend continues.
Still, a bullish breakout with valid price action above the key daily resistance area could confirm a potential trend reversal.


