Published: November 9th, 2022
Let’s start by looking at Airbnb's recent Q3 2022 results. Revenue was $2.9 billion and net income for the quarter was $1.2 billion. Both were the maximum for the company. However, Airbnb’s revenue declined by 42% impressively.
Year over year, net income grew 46%, and revenue was increased by 29%, including a foreign exchange rate negative impact. There would have been growth of 61% and 36%, respectively. However, the financial performance of Airbnb in Q3 was solid.
Equally impressive activity on the platform drives the financial performance of Airbnb. Experiences and nights increased by 99.7 million or 25%, and gross booking value reached $15.6 billion, the sum of all transactions on the platform grew by 31%.
Aircover is another bullish factor for the stock, where the common complaint from users is that it protects guests and hosts from unexpected negative experiences. Additionally, the new feature “categories” improves the search function that helps hosts to show their listings to more potential guests.
Airbnb has grown enormously in the Asia-Pacific region. In Q3, this region grew by 65%, excluding China. However, when China lifted its COVID-19 restrictions, there was a massive potential opportunity.
Should you buy the Airbnb stock now? Let’s have a look at the complete price prediction from teh Airbnb Stock (ABNB) technical analysis:

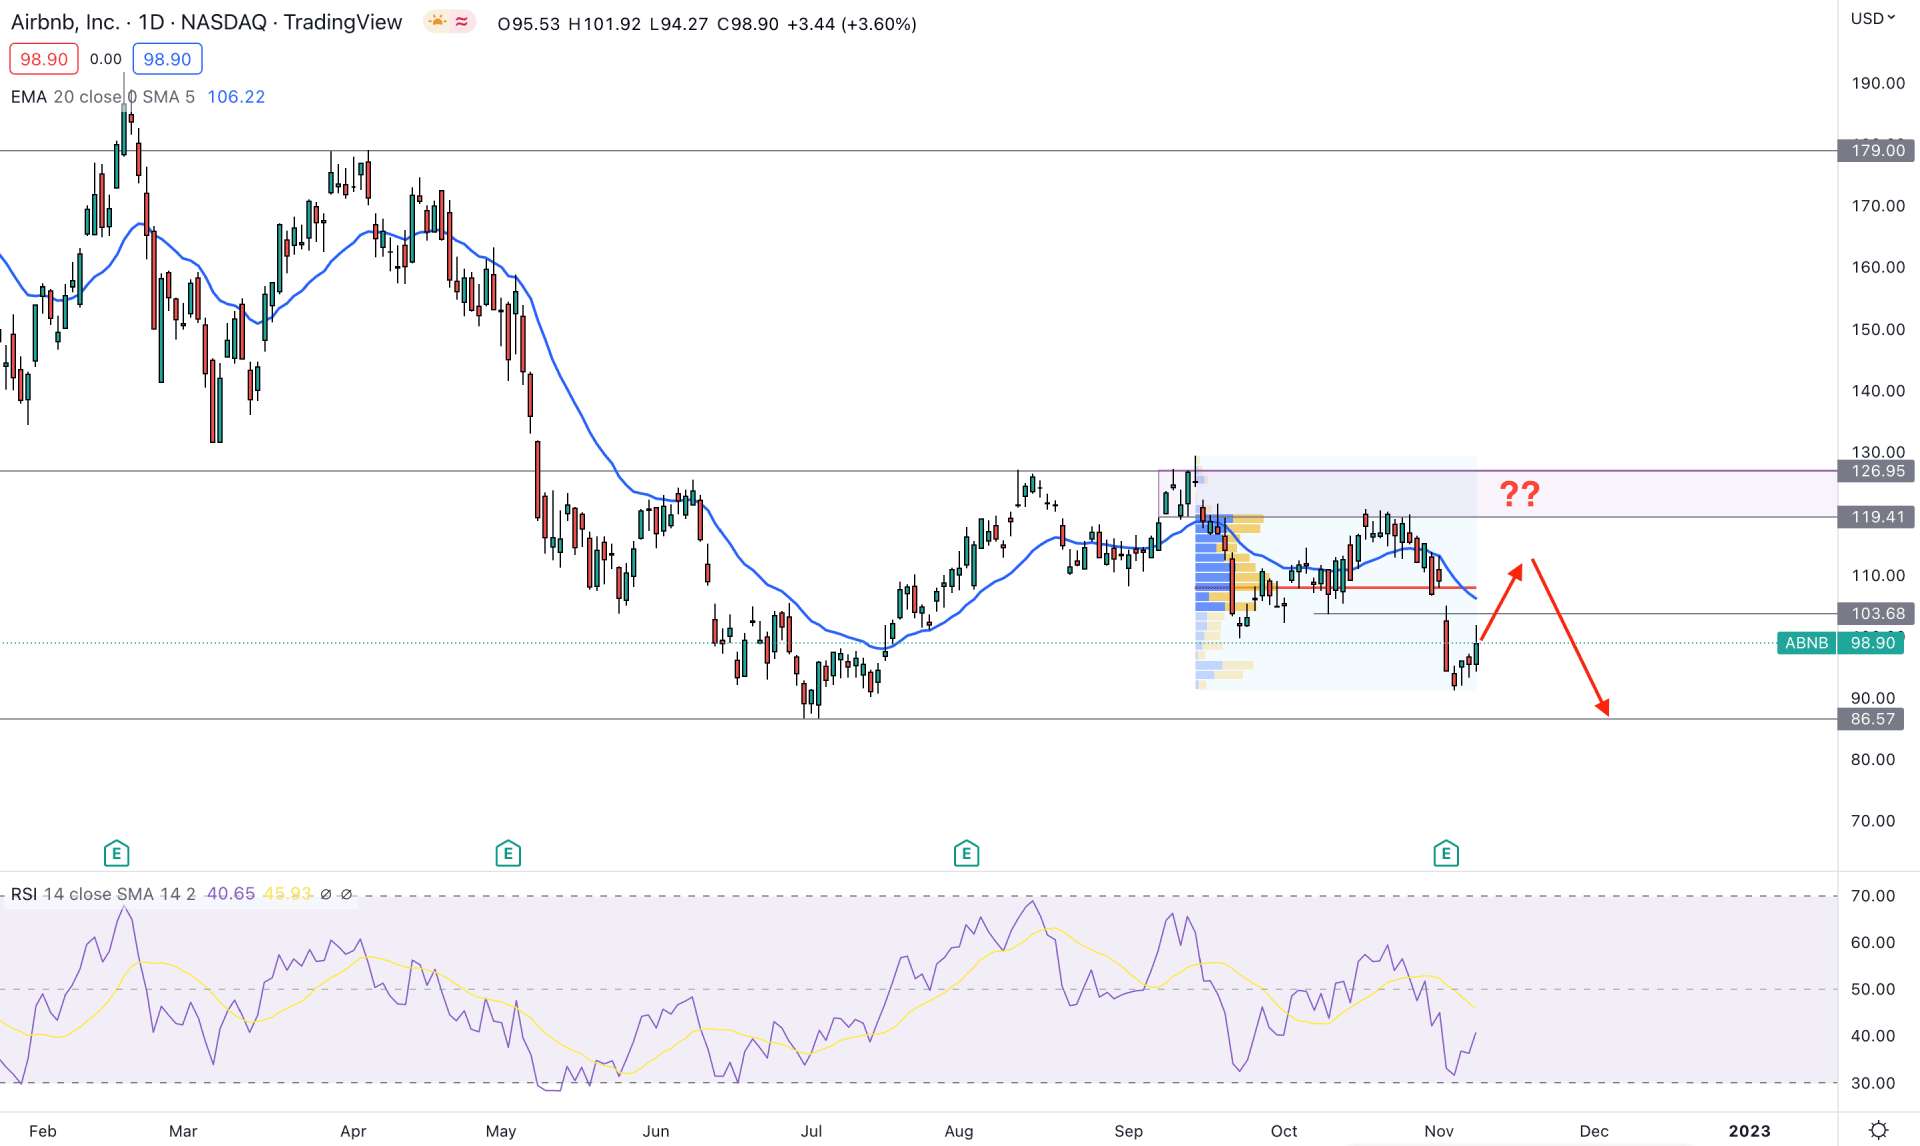
In the Airbnb stock daily chart, the broader outlook is clearly bearish as the current price is trading 43% down from the yearly opening. Moreover, in August 2022, the price formed a decent double top pattern, where the neckline break could offer a bearish trend continuation opportunity.
In the most recent chart, the selling pressure from the key supply zone of 126.95 to 119.41 formed a new swing low, which is another reason for the upcoming bearish trend continuation.
Based on the fixed range high volume indicator, the highest trading volume from September to November 2022 zone is at 108.08 level, which is above the current price. In that case, the bearish possibility in this instrument is valid as long as it remains below the high volume level on the daily chart.
The Relative Strength Index (RSI) shows a bearish corrective possibility, where the current RSI level is within 50% to 30% area. Therefore, the bearish possibility is solid until the RSI shows a strong bullish rejection from the overbought 30% level.
As of the daily price of ABNB, the selling pressure could be potent, where a minute bullish recovery with an appropriate bearish rejection on the intraday chart could offer a short opportunity.
The alternative trading approach is to wait for a new swing high above the 127.00 level before waiting for a 39% gain to 179.00 key resistance level.

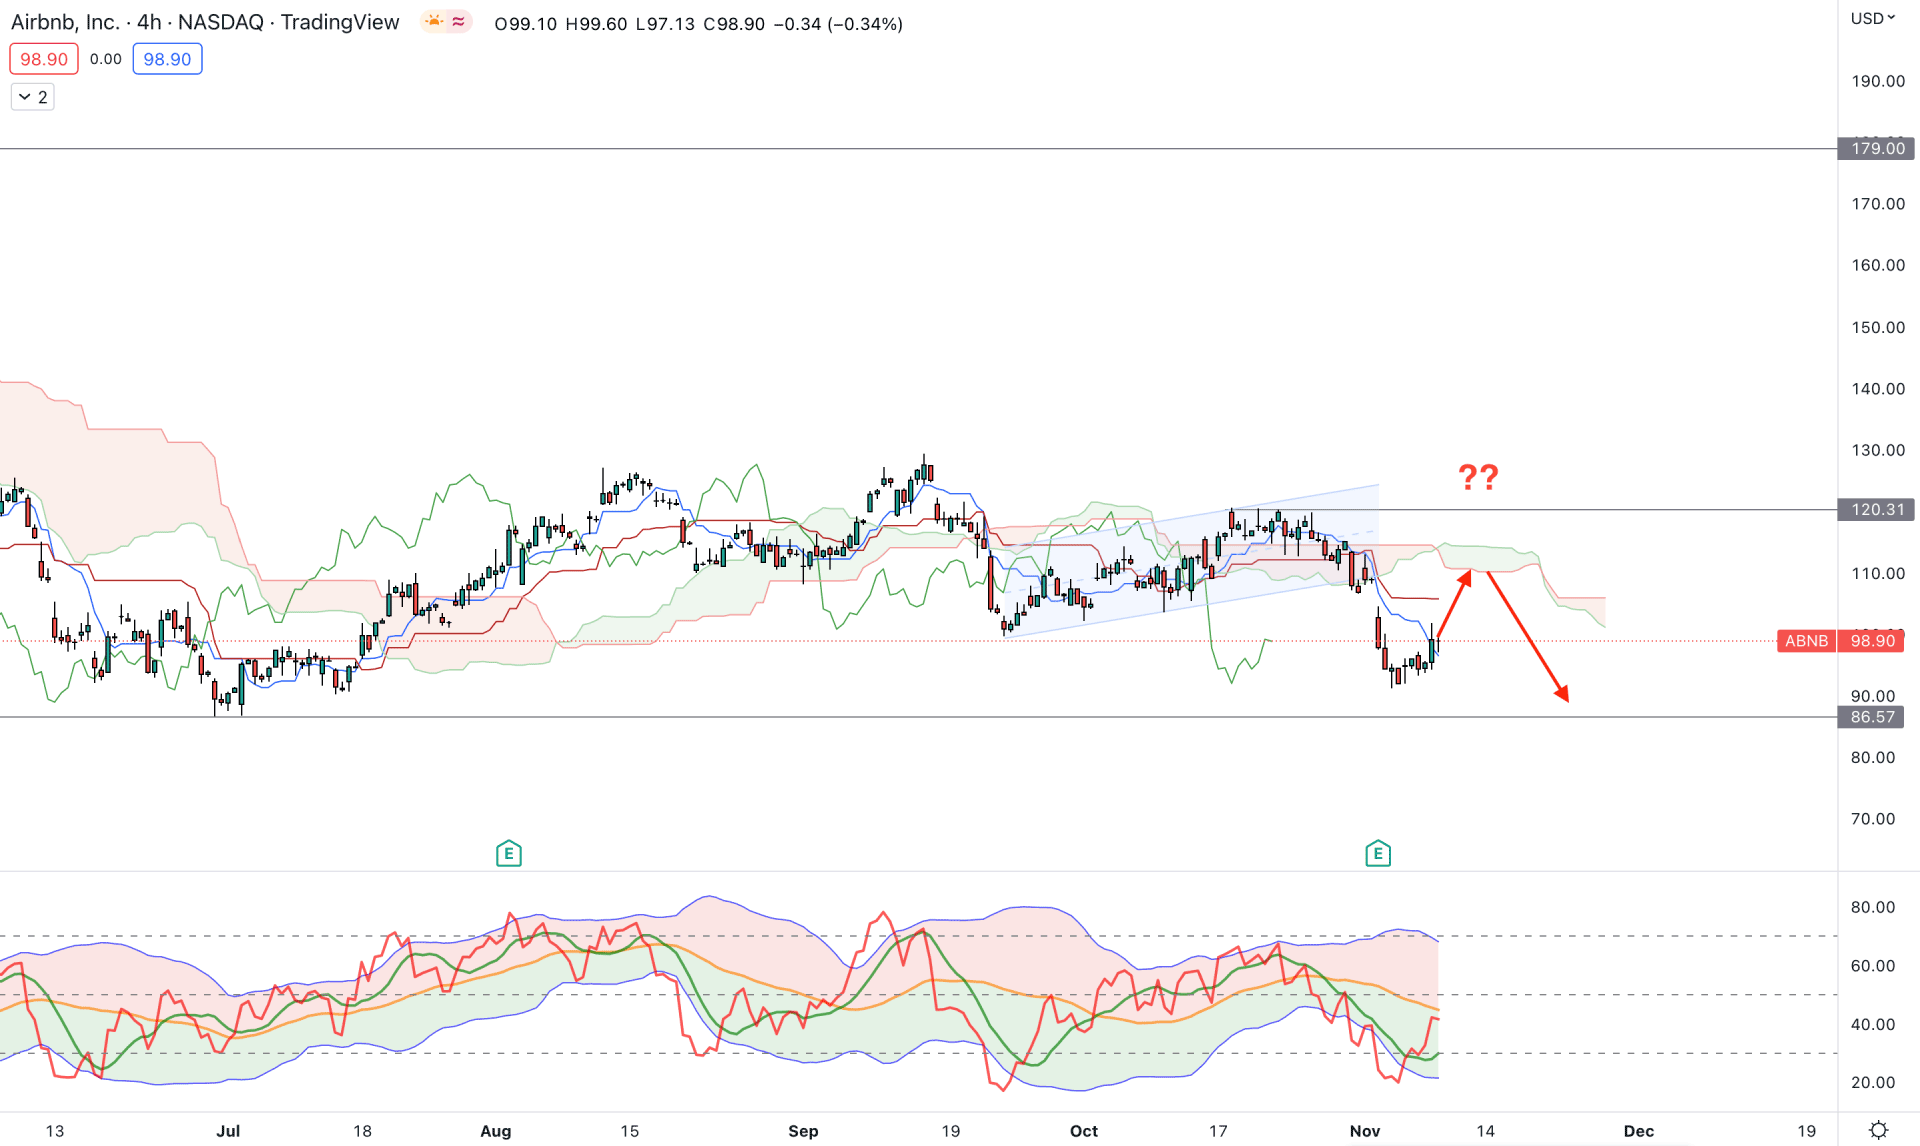
In the H4 chart, the broader outlook is bearish as the current price is below the Ichimoku Kumo Cloud for a considerable time. In October 2022, bulls tried to recover the price but failed to form a new higher high above the cloud support. As a result, the price went sideways within an ascending channel and bears took control over the price.
In the current structure, the future cloud shows a bearish trend continuation opportunity, where the Senkou Span A is below the B. It is a sign that medium and short-term traders in this instrument are in the short position, which may lower the price in the coming hours.
The traders dynamic index, shows a rebound from the lower band, showing a possibility of sellers’ profit taking from the market. However, the buying momentum news reached a new higher high in the price with the TDI level above the 50% area.
Based on the H4 structure, the primary aim of this pair is to find a bearish opportunity, where any bearish rejection from the Kijun Sen level would increase the possibility of lowering the price. The primary target of the selling pressure is 86.57 level, while bulls need a solid breakout above the 120.31 level.

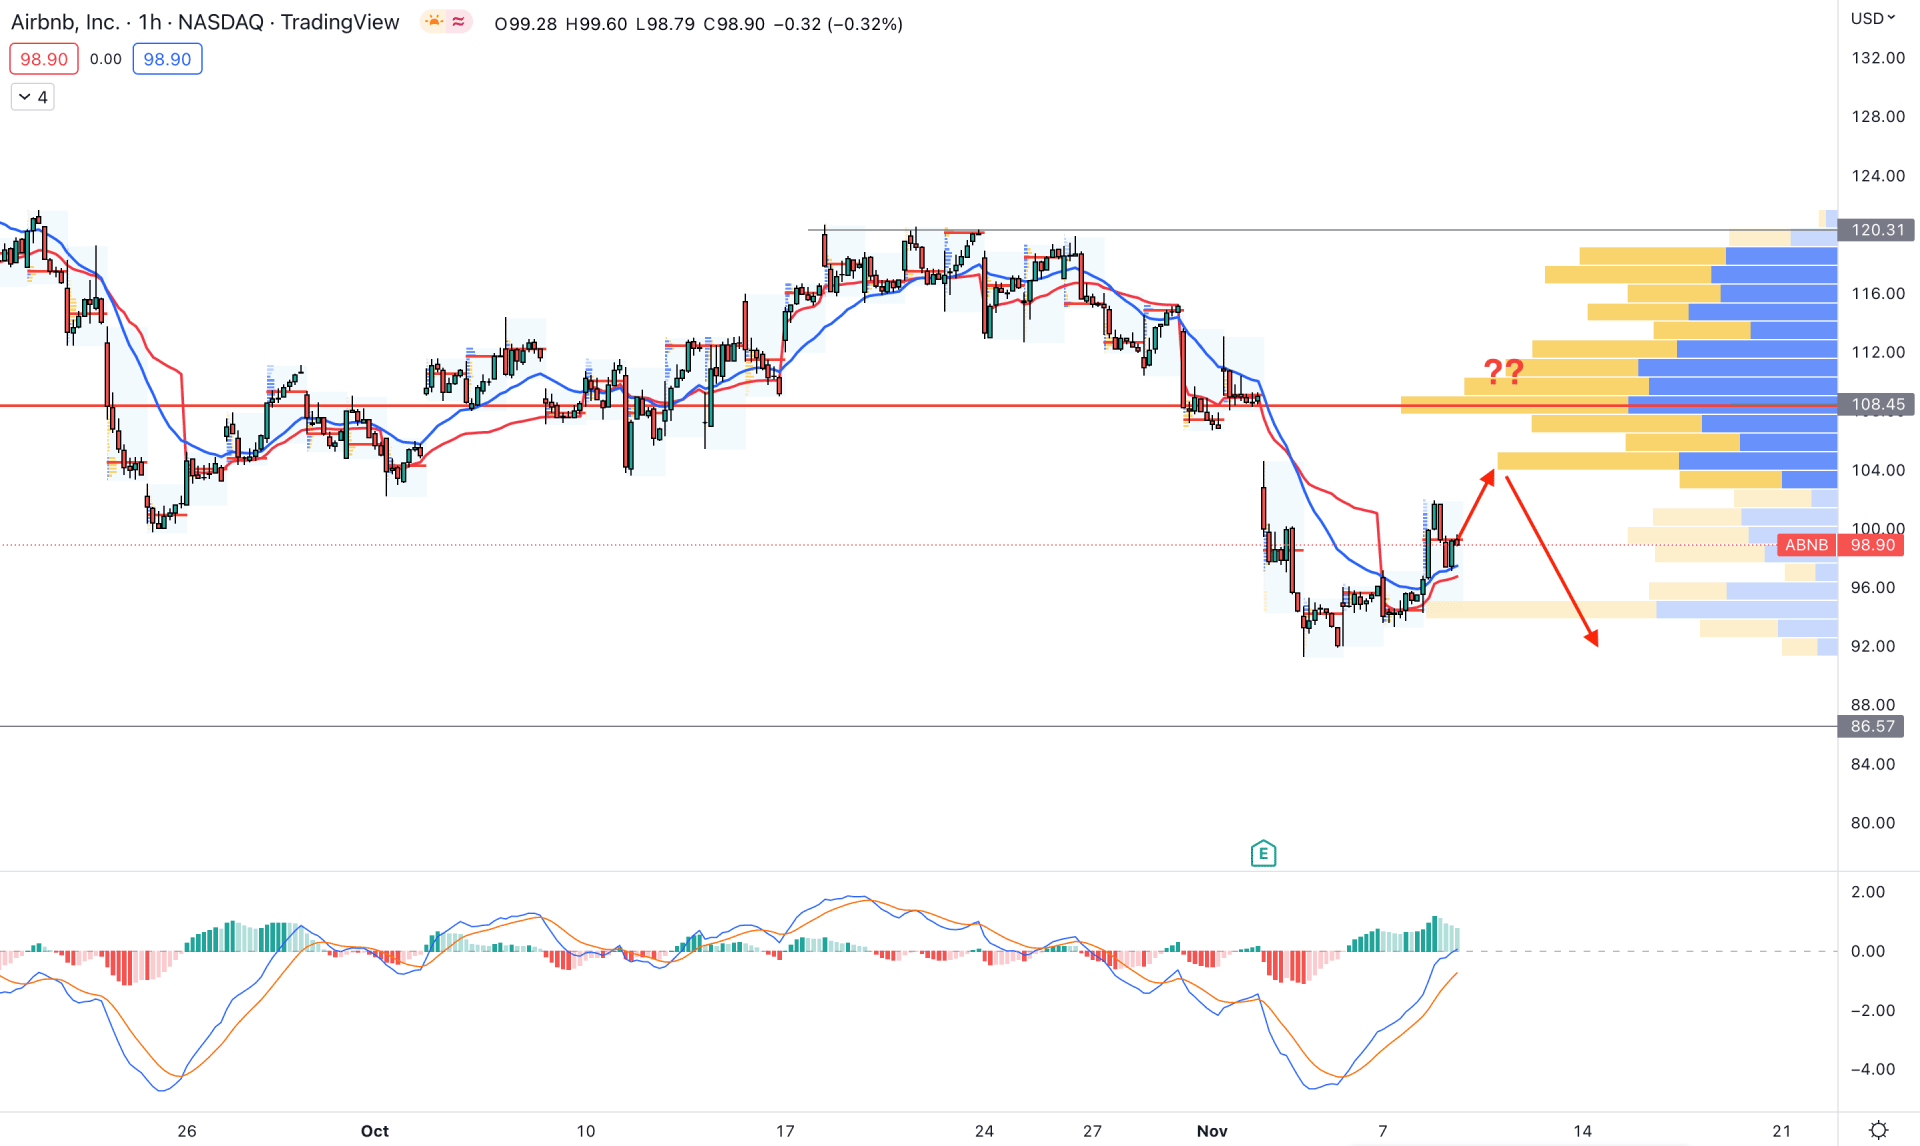
In the hourly chart, Airbnb stock is trading below the visible range high volume level of 108.45. However, the gap between the price and high volume level has extended, which could higher the price for a mean reversion.
The dynamic 20 EMA and weekly VWAP are below the price, which is a sign of a buying pressure, supported by the positive MACD Histogram.
Based on the current outlook, investors should find a bearish H1 candle below the dynamic 20 EMA before going short in this instrument. On the other hand, bulls have a possibility of reaching the 132.00 level if the price shows a positive H1 candle above the 108.50 level.
Based on the current outlook, ABNB has a higher possibility of moving down in the coming days, where further selling pressure from the intraday chart could offer a short opportunity. On the other hand, bullish traders should wait for the new higher high before opening a long position.