![Airbnb Stock [ABNB] Revisited the Pre Q3 Earnings Level](https://d3kvcd8uuqwmxt.cloudfront.net/filecache/articles_img/tech-analysis-main-page.jpg_836_619fa6924fa9c5.34687427.jpeg)
Published: November 25th, 2021
Airbnb stock has become an attractive investment opportunity since it got listed in the Nasdaq in December. It debuted at $68 a share and soared 223% within a year, where the all-time high was set to $219.94 on 11 February.
During the pandemic, travel stocks got hit due to the imposing of lockdowns and shutdowns. Like other travel and entertainment stocks, ABNB became volatile in the first quarter of 2021 but moved lower with an impulsive bearish pressure. Now the situation is changed where vaccination rates are increasing, pushing the ABNB to move higher from July 2021.
Besides the stock recovery from the COVID-19 delta variant crash, the recent Q3 earnings result was published; the diluted earnings per share came at $1.22 a share, 239% higher than a year ago. In the first 9 months of 2021, Airbnb faced a loss of $0.67 a share after the net loss of $2.64 in January to September 2021.
In the quarterly earnings report, EBITDA came with a 120% increase to $1.1 billion with a 67% jump in revenue of $2.2 billion. Moreover, the net income was higher at 280% to $834 billion. Besides earnings growth, Airbnb management noted an improved cost structure that might help the adjusted EBITDA margin increase by 49%. Some prominent analysts are bullish about this stock intending to achieve 38% profit from the current price range.
Let’s see the upcoming price direction from the Airbnb Stock [ABNB] technical analysis:
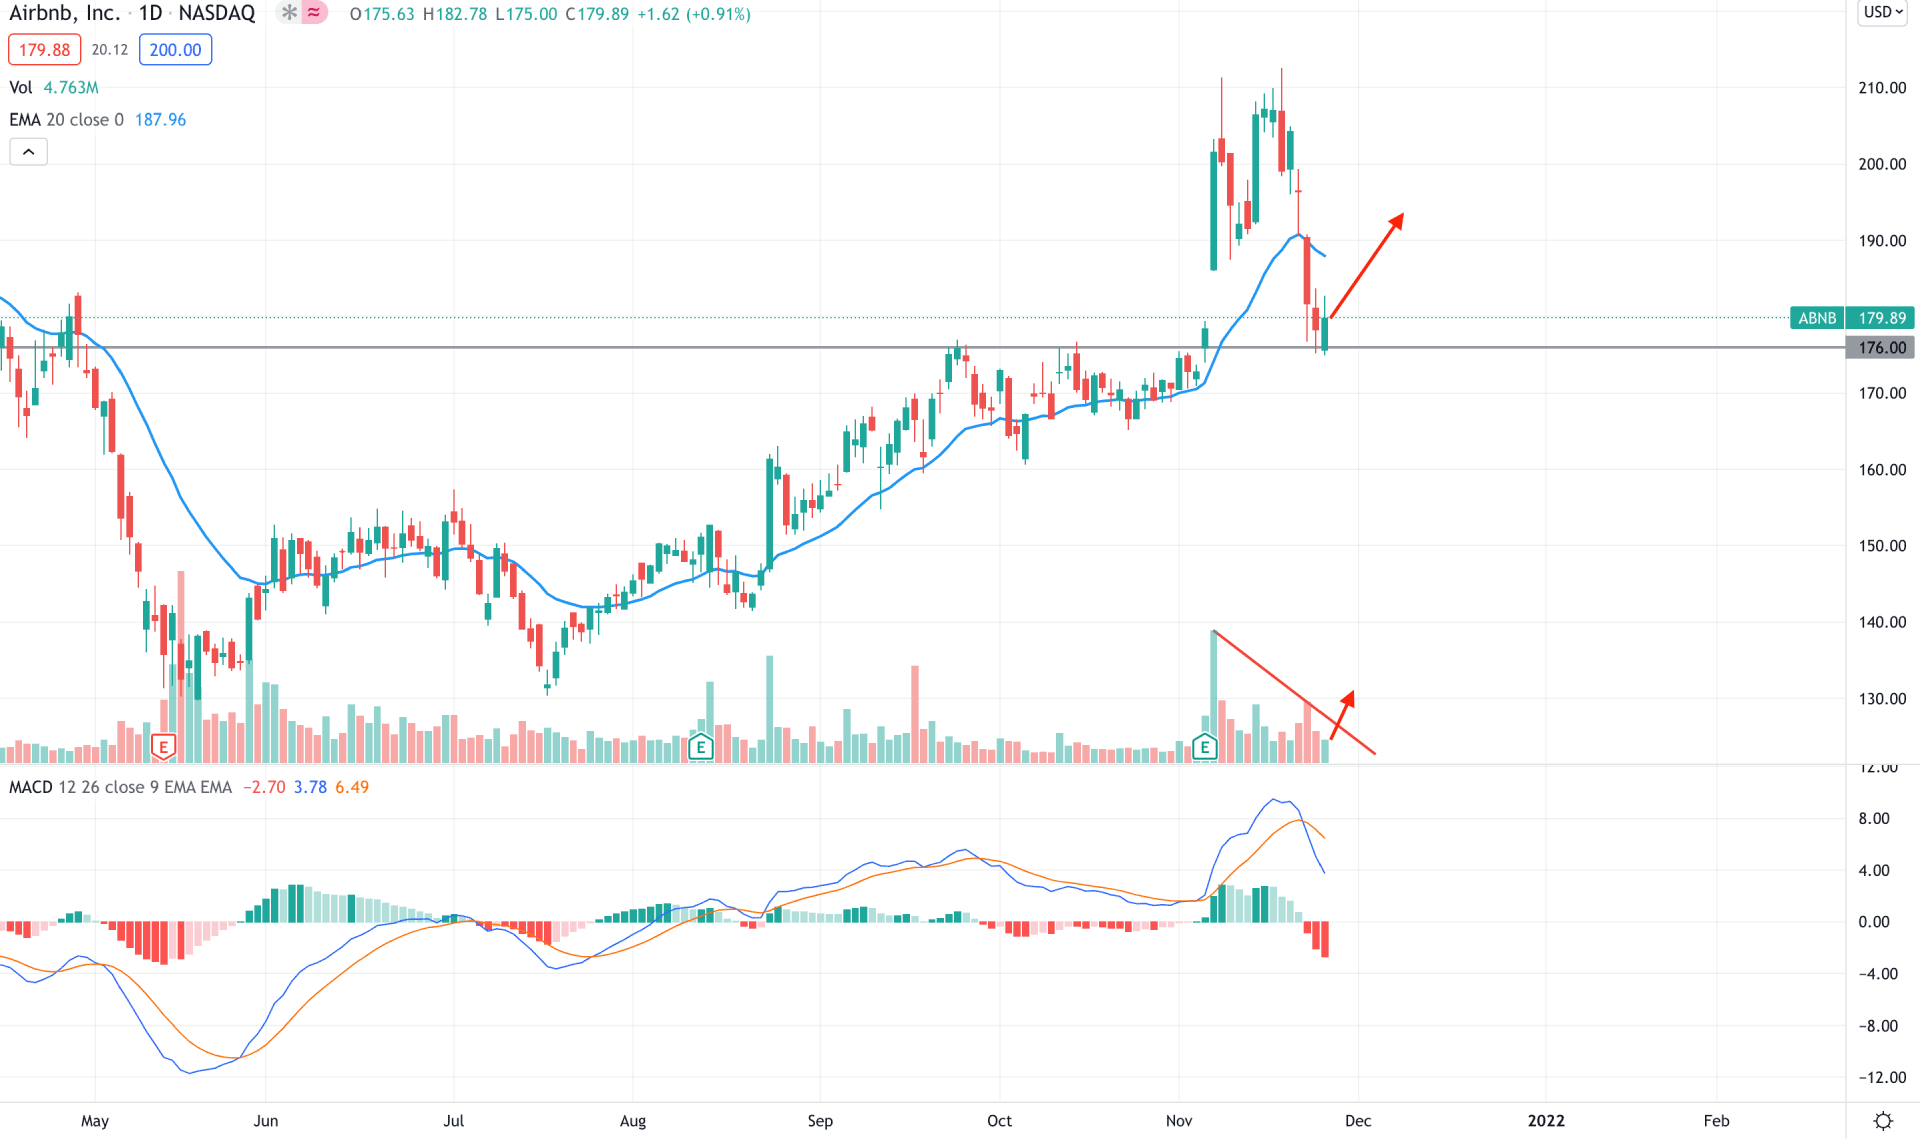
Airbnb stock initiated the bullish movement from the 130.00 double bottom level and above the 176.00 key event level with an impulsive bearish pressure. Moreover, the price shot higher after the Q3 earnings call that reached the price above the 200.00 level with strong support from volume. However, bulls failed to hold the momentum, and the price moved down after massive volatility. During the recent bearish pressure, the higher daily trading volume was seen at 12M. Therefore, as long as the price holds above the 176.00 key event level, any bullish daily candle above the dynamic 20 EMA with a daily trading volume above 12M would be a potential buying opportunity in this pair.
The above image shows how the price moved below the dynamic 20 EMA where the MACD Histogram turned bearish. Therefore, if bulls fail to hold the momentum above the 176.00 level, it may continue the downside pressure towards the 160.00 and even 140.00 area.
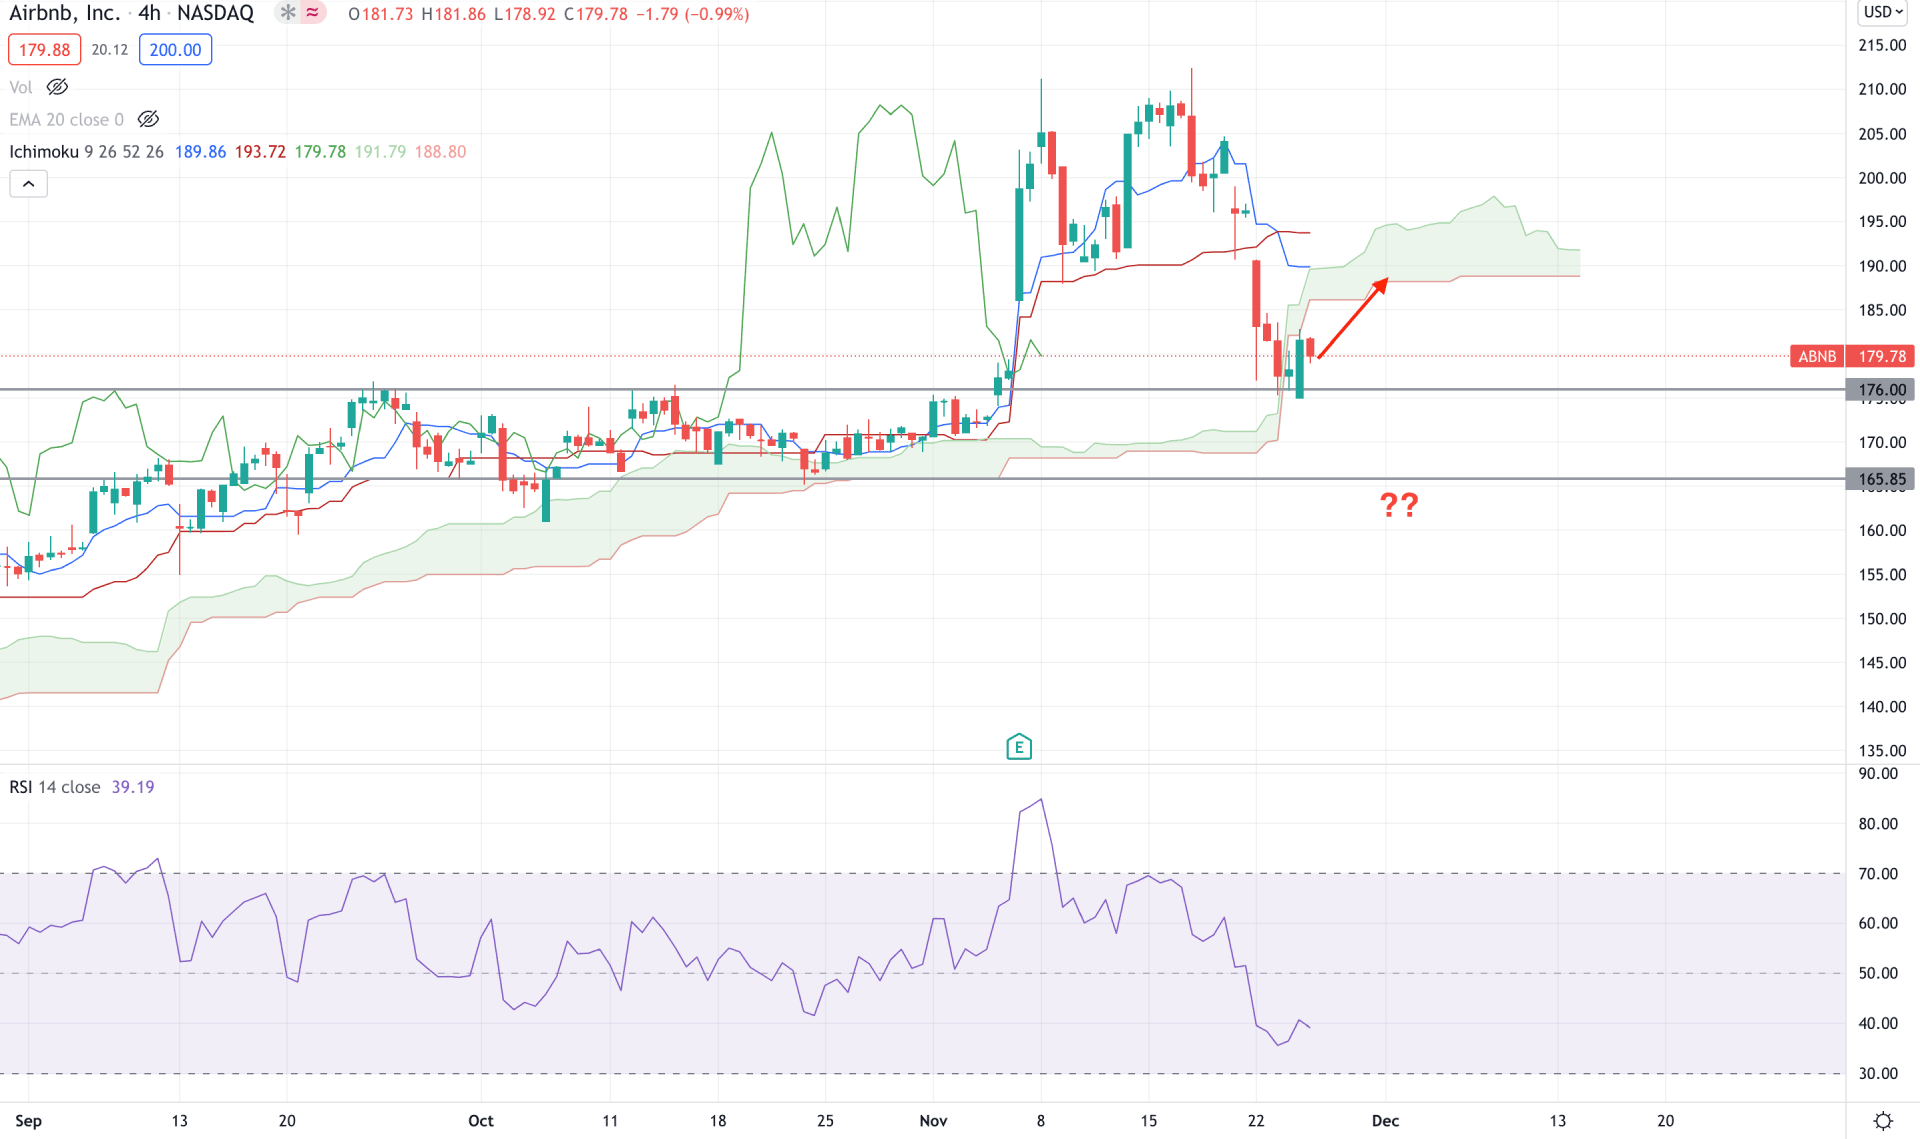
In the H4 timeframe, Airbnb stock is moving within an indecisive momentum where the current price moved below the Ichimoku Kumo Cloud. At the same time, the future Cloud is bullish and above the current market price. Meanwhile, the lagging span is close to the price, indicating more correctness to the price.
The above images show how the RSI moved above the overbought 70 levels during the earnings report release and moved below the 50 levels, later. As the current RSI level is below the 50 areas, it is more likely to drop and test the oversold 30 levels with a bearish pressure in the price. Moreover, the dynamic Tenkan Sen and Kijun Sen are above the price and face a bearish crossover, another indication of selling pressure.
Based on the H4 context, any strong bullish rebound from the 176.00 level with an H4 close above the dynamic Kijun Sen would increase the selling pressure towards the 200.00 area. On the other hand, a break below 165.85 level with a bearish H4 close may resume the current selling pressure towards the 140.00 level.
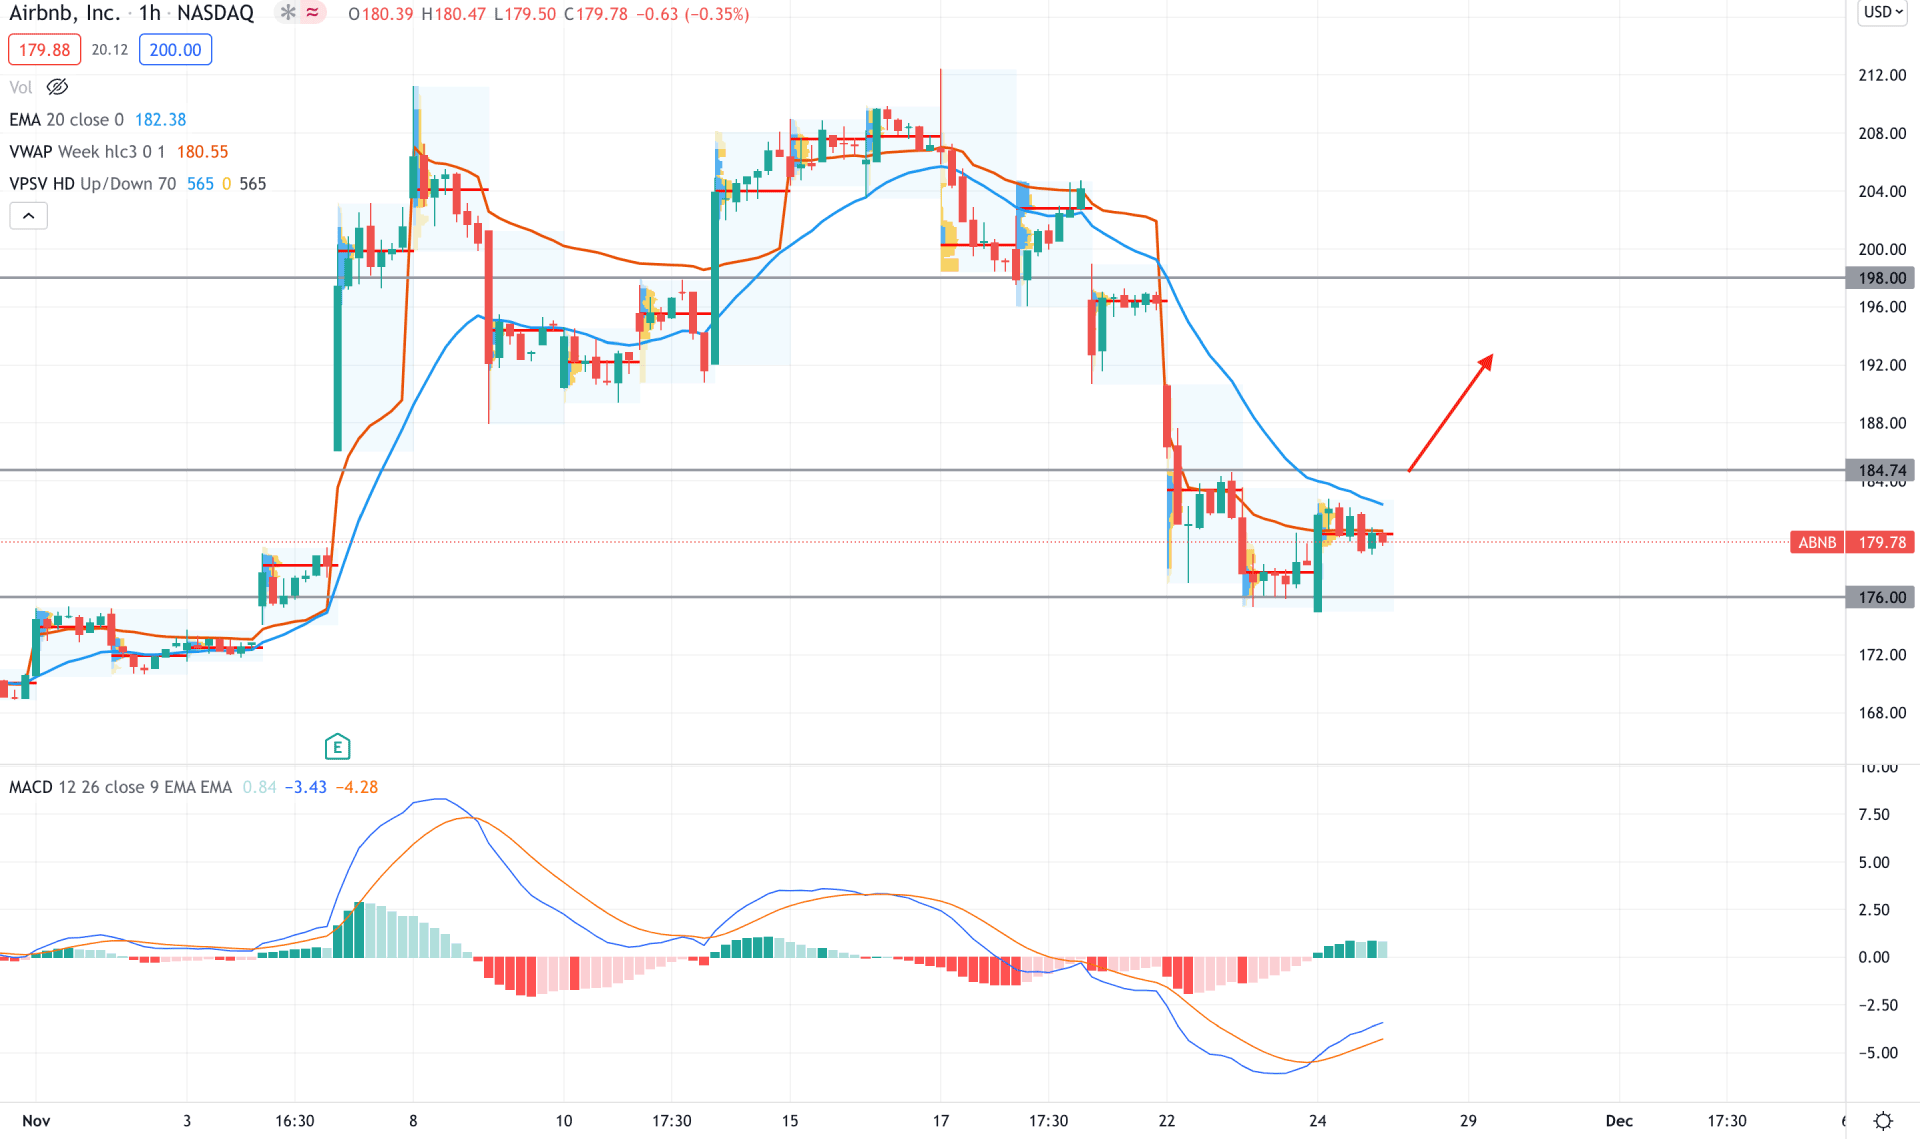
In the intraday chart, Airbnb stock failed to hold the bullish momentum above the 200.00 level and moved below the dynamic 20 EMA by making consecutive lower lows in the intraday high volume level. However, the bearish pressure stalled at the 176.00 level, where the current price is still below the dynamic 20 EMA.
The above image shows how the MACD Histogram moved above the zero level where the dynamic weekly VWAP is above the price. Therefore, based on the intraday price structure, a strong bullish H1 candle above the 184.74 intraday event-level would increase the bullish pressure towards the 200.00 area. On the other hand, investors should see how the price reacts below the 176.00 level where a strong bearish pressure with a correction is important to rely on the possible bearish opportunity.
As per the current market condition, Airbnb Stock bulls should wait for the price to see a strong bullish daily candle above the dynamic 20 EMA with a breakout in the daily trading volume. In that case, the price may move beyond the ATH, followed by the earnings support. On the other hand, a stable break below 176.00 is important to rely on the possible bearish opportunity.


