Published: February 4th, 2021
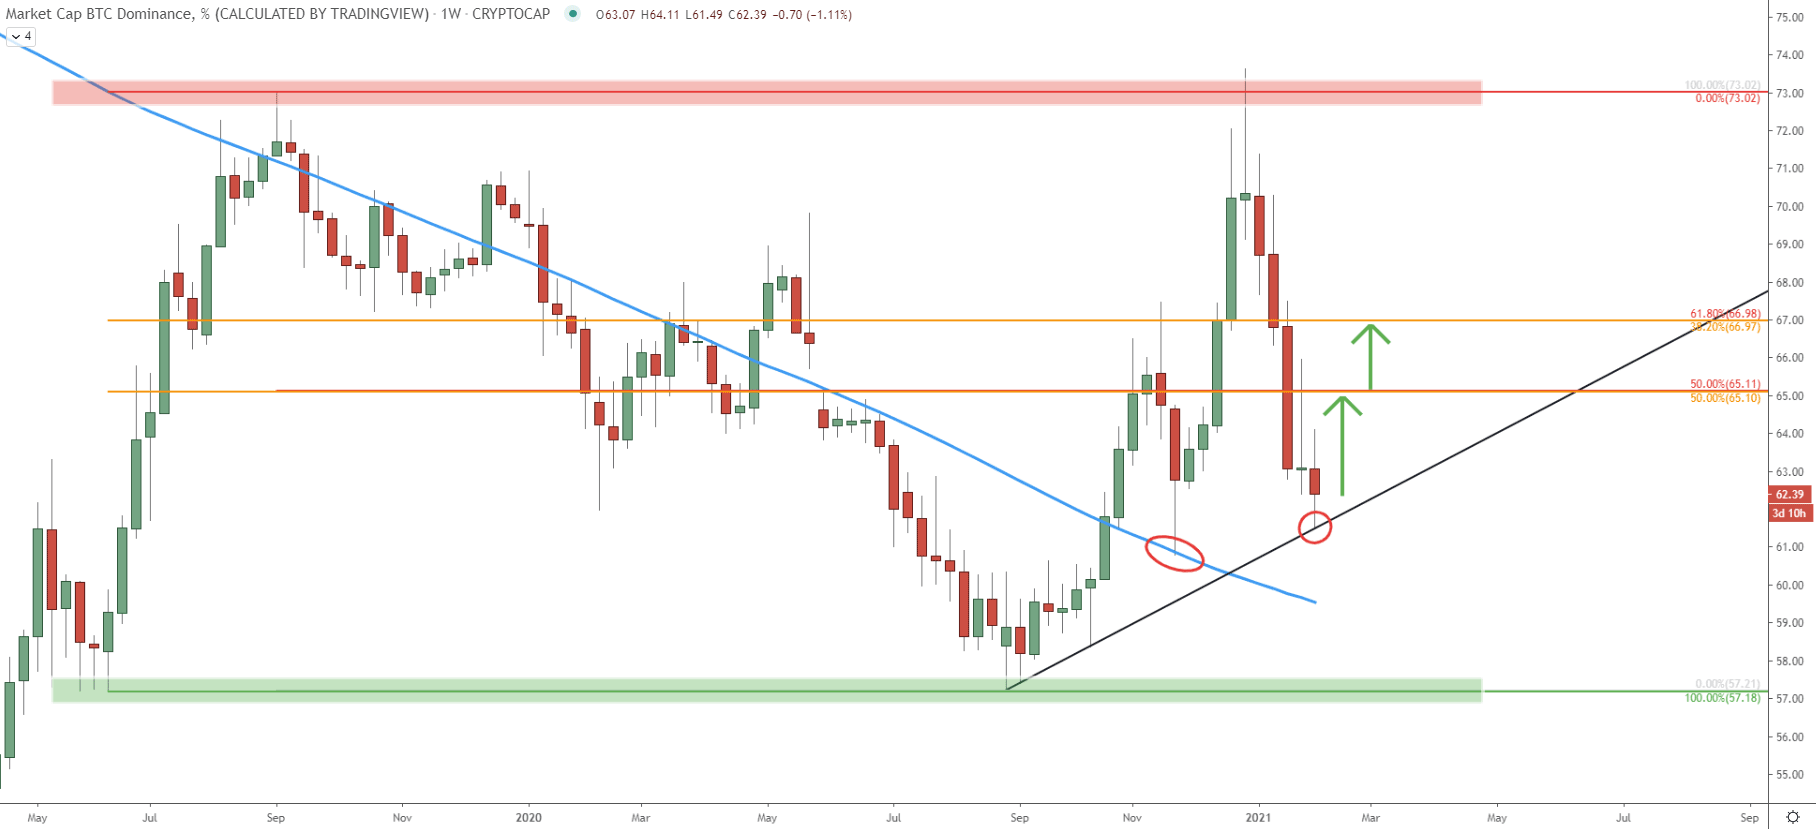
Today we’ll start by observing the Bitcoin Dominance weekly chart, to understand the overall sentiment of the Altcoin market, including the FTM (Fantom) token. Considering the price action of the last two years, the BTC.D is currently still in the consolidation phase and it remains between 57% support and 73% resistance area. Back in November, BTC.D rejected cleanly the 200 Exponential Moving Average after which the price went up and re-tested the 73% resistance. Then a sharp decline followed, which actually provided the strong altcoin season. Right now Bitcoin Dominance is right at the uptrend trendline support, which got rejected cleanly this week.
This might imply, that money will flow from Altcoins back to Bitcoin for the short or medium term. It is highly likely that BTC.D will be testing either 65% or 67% dominance before it goes down. In this case, most altcoins will go through a correctional phase, which for some coins could be small, but for some, like Fantom, it can be a substantial price decline. Now let’s jump into the analysis of FTM/USDT.
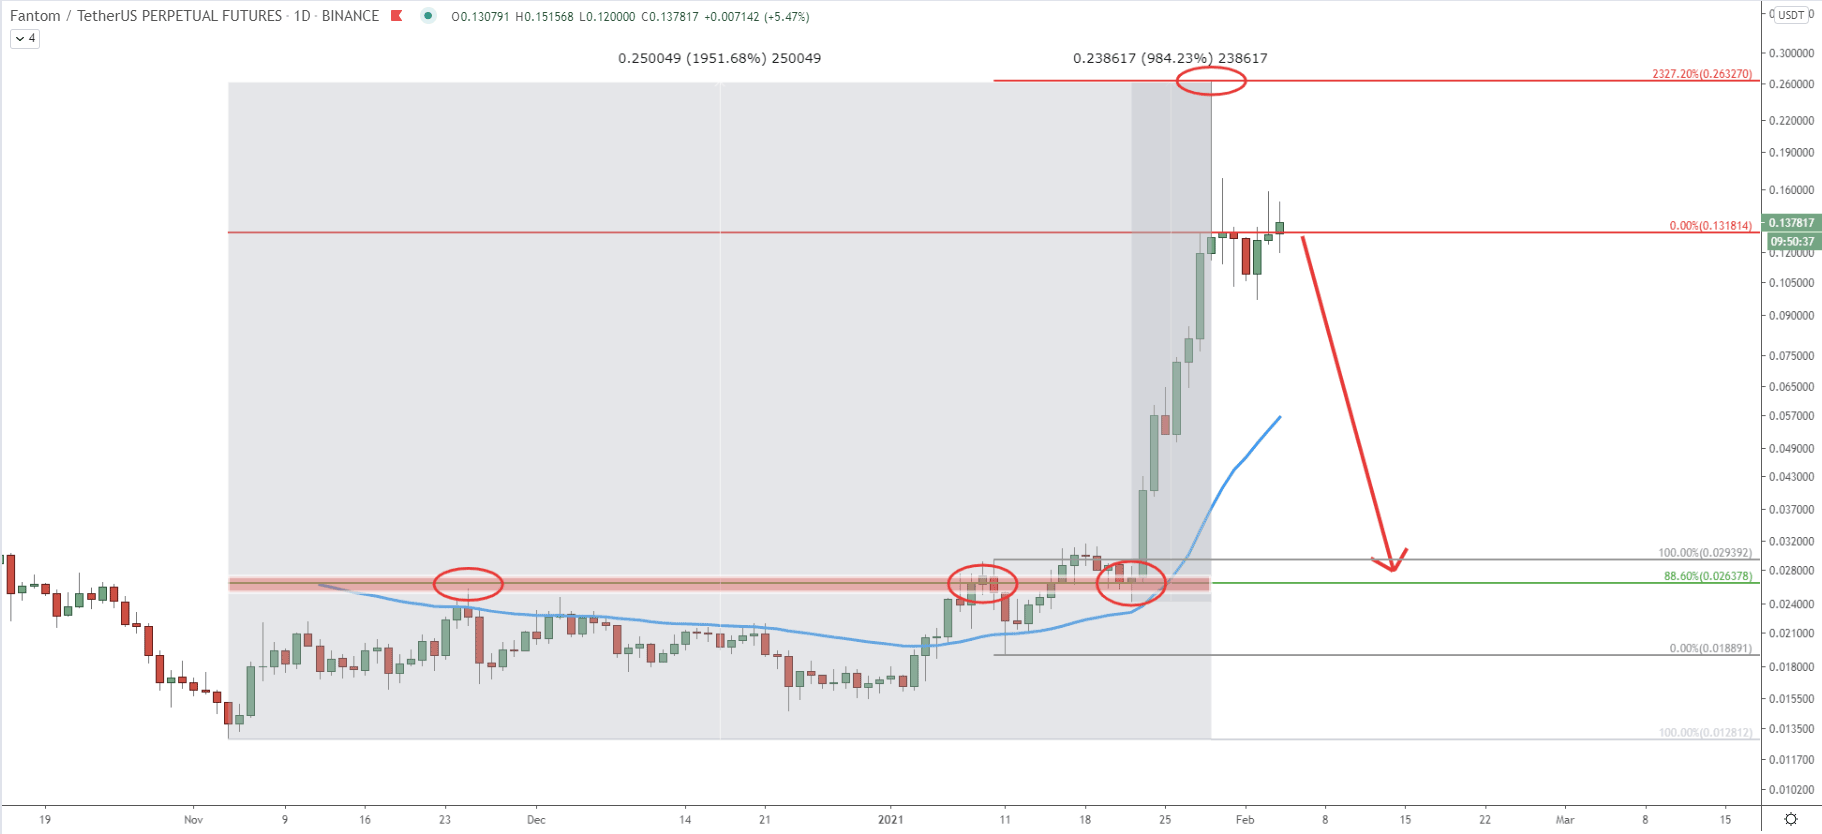
Since November 2020 price has increased by over 980%, while rising from 0.012 low, up to 0.263 high, which was tested a week ago. It was very significant growth in a relatively short period of time, but as always, the market can not move only in one direction for an extended period of time, and the correctional moves should be expected. Based on the analysis of the Bitcoin Dominance, altcoins could be going through this correction.
Fibonacci indicator, applied to the correctional move down, where 50 Exponential Moving Average was rejected last time, shows that 2327.2% retracement level at 0.263 was rejected precisely, suggesting that FTM/USDT price could have topped out. Based on another Fibonacci indicator, applied to the overall move up, the price can drop towards the 88.6% retracement level at 0.026. This is because 88.6% is an extremely common level for a pullback in the cryptocurrency market.
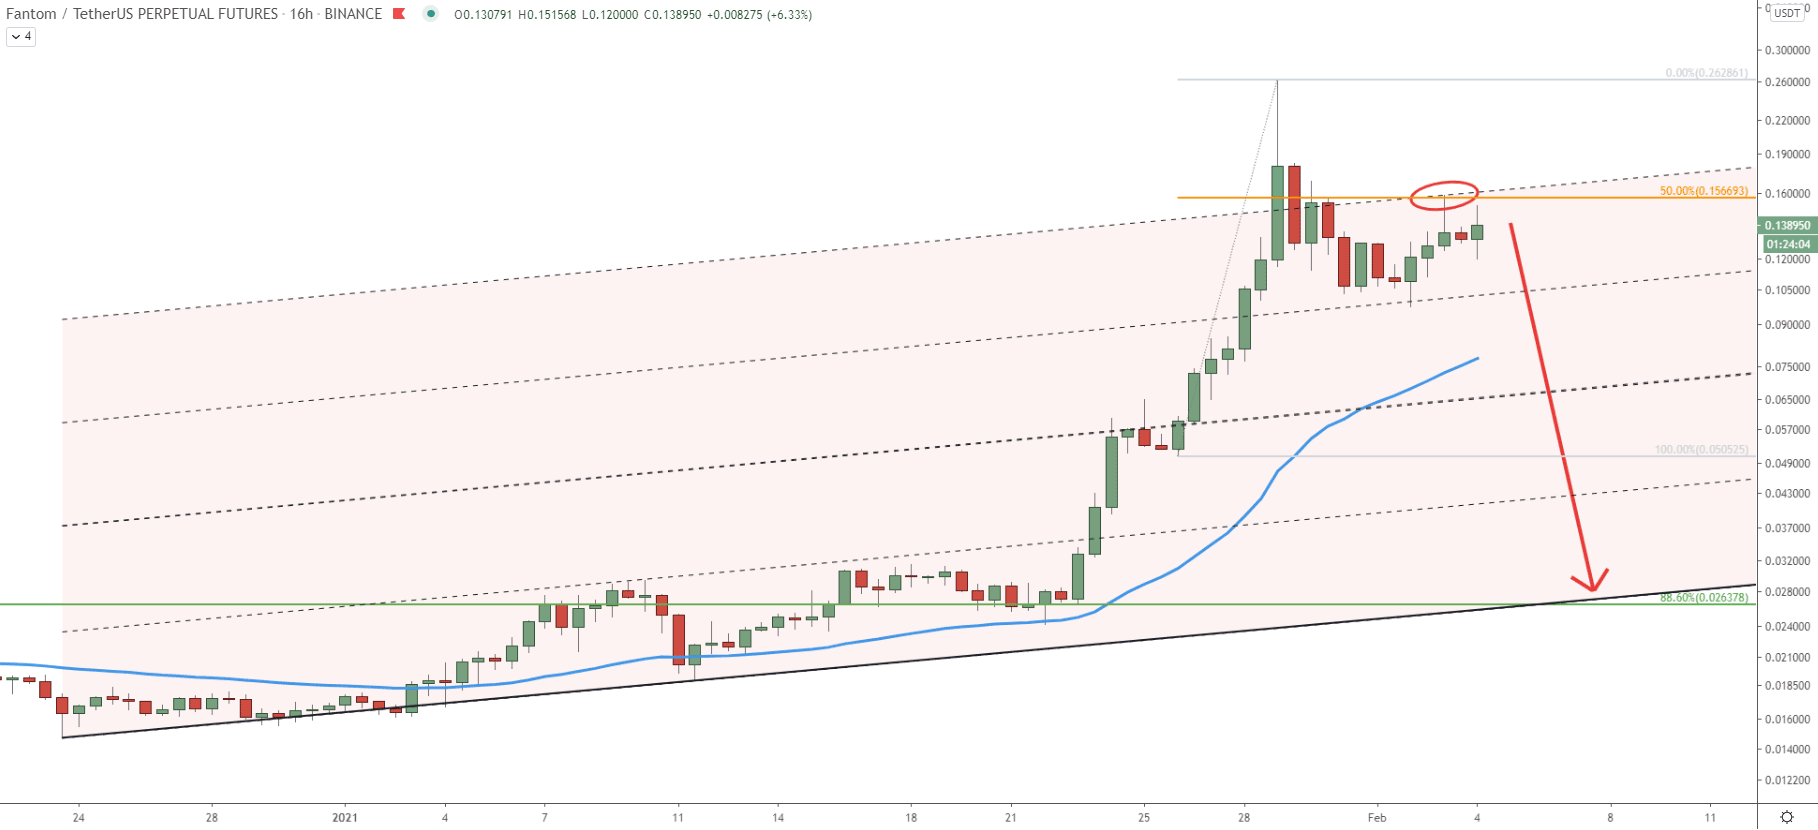
On this chart, the ascending channel has been applied and extended. Just a few days ago, Fantom bounced off the top of the channel as well as the 50% Fibonacci retracement level, applied to the last wave up. It shows, that the selling pressure is increasing and soon the downside correction is likely to take place. On this chart, it can be seen that the downside target at 88.6% Fibs corresponds to the simple uptrend trendline or the bottom of the original ascending channel. It implies a very rapid price decline, which can take less than one week.
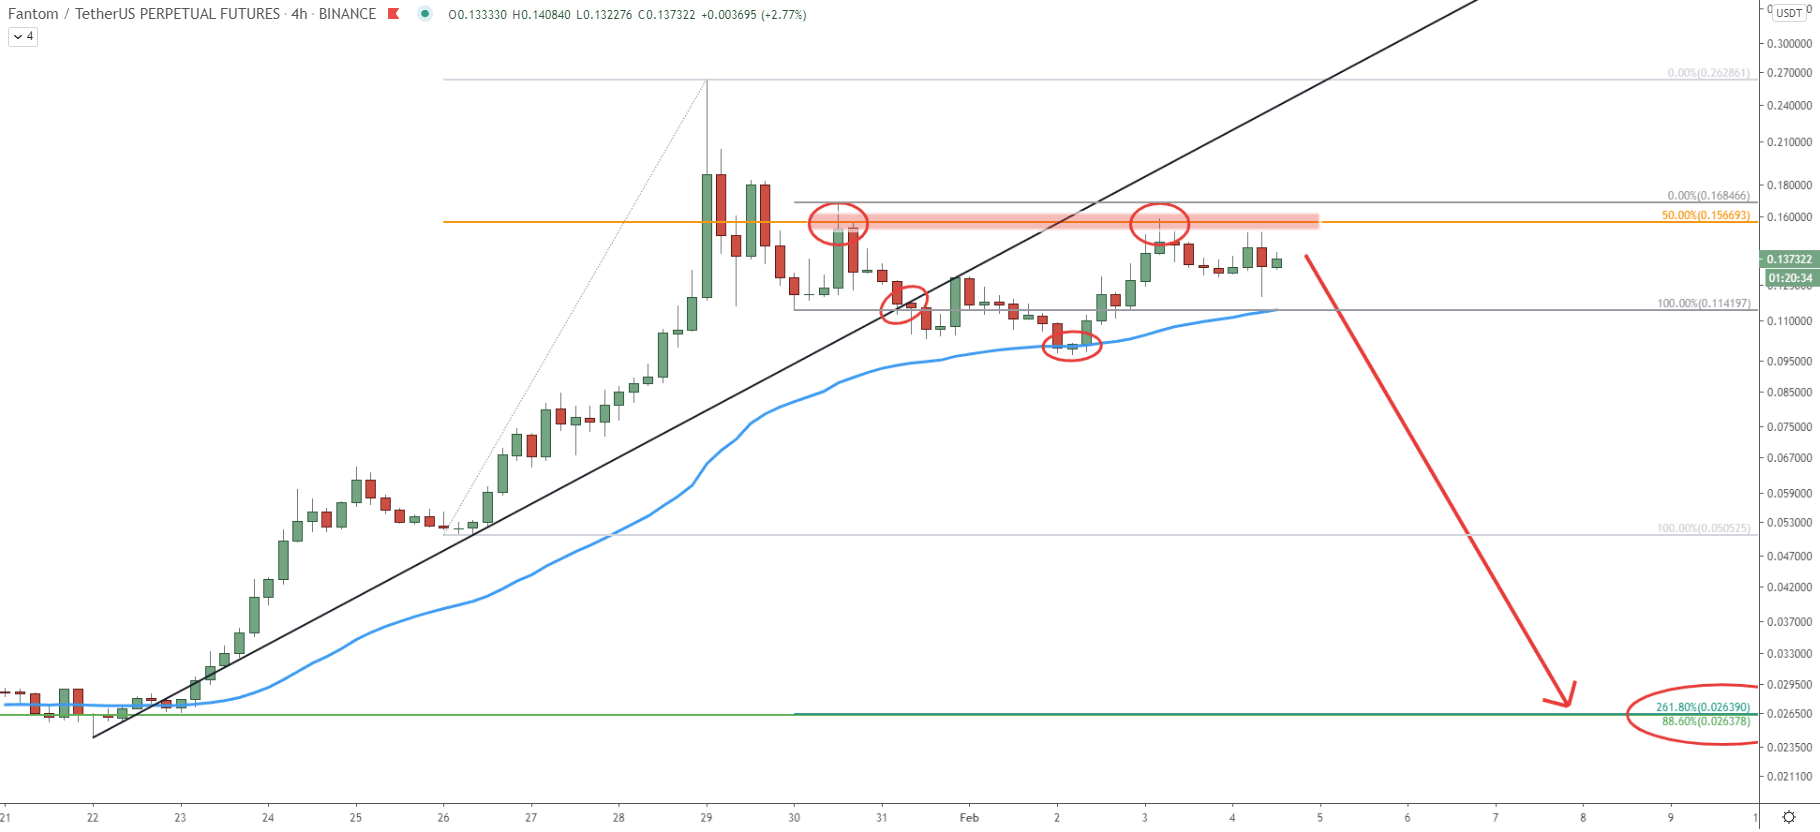
The 50% Fibonacci resistance level at 0.156 has been rejected two consecutive times. At the same time, the price broke below the simple uptrend trendline as well as 200 Exponential Moving Average. These are more confirmations of increasing bearish pressure, and as long as the price remains below the 0.156 - 0.168 resistance area, the price decline is imminent. Besides, on this chart, the Fibonacci retracement indicator was applied to the corrective move up, where 0.156 resistance was rejected for the first time. It shows that the 261.8% retracement level exactly corresponds to the previously mentioned support at 88.6% Fibs. This makes it a key long term demand area, where price could be heading very soon.
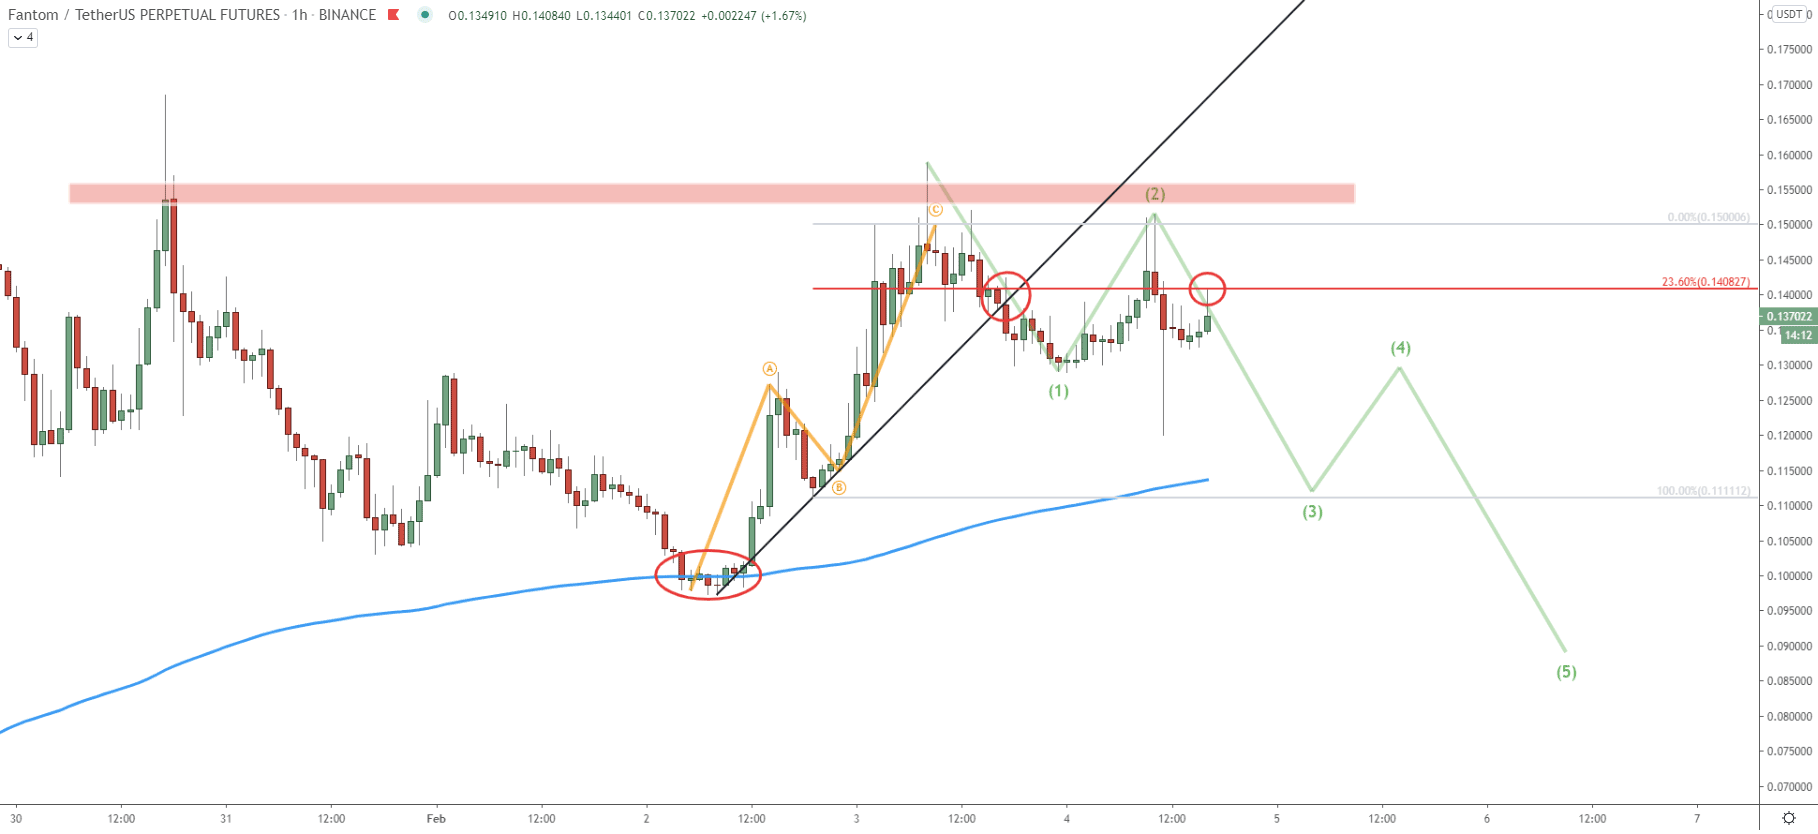
On the hourly chart, we have applied an Elliot Wave theory to understand what can be expected in the short term from FTM/USDT price. After Fantom broke below the 200 EMA, it corrected up, with an ABC correctional pattern and rejected the 0.15 resistance area. After that, the uptrend trendline was broken and 23.6% Fibonacci retracement level at 0.14 is being rejected cleanly. Perhaps from now on, there will be a 5-wave move to the downside, and currently, FTM has just completed wave 2.
The cryptocurrency euphoria could have come to an end, and there could be a relief from the buying pressure throughout multiple altcoins. Fantom is one of those coins which might have the strongest pullback, which seems to have just started.
As per the daily and 4-hour chart, the key support and the potential downside target is located at 0.026. This support level is confirmed by a simple uptrend trendline along with two Fibonacci retracement levels.
As per the 4-hour chart, the resistance area is located between 0.156 and 0.168. Break below this area will immediately invalidate a bearish outlook and the major uptrend can be expected to continue.
Support: 0.114, 0.100, 0.026
Resistance: 0.140, 0.150, 0.168