

Published: November 3rd, 2026
Advanced Micro Devices (AMD) is set to announce its third-quarter earnings this week. Investors expect another strong performance, fuelled by growing demand for artificial intelligence (AI) chips and server processors.
Market forecasts place revenue between $13.08 billion and $13.09 billion, up about 41% from $9.25 billion in the same quarter last year. Adjusted earnings per share are expected to range from $1.88 to $1.95. Up from $0.97 to $1.20 a year earlier.
The data centre business is expected to attract considerable attention. In the second quarter, the segment recorded $6.7 billion in revenue, nearly doubling year-on-year. Strong demand for EPYC server processors and Instinct AI accelerators primarily supported growth. AMD had also indicated a non-GAAP gross margin target of approximately 56%.
Beyond its quarterly performance, investors are likely to focus on the company's fourth-quarter outlook. These projections could offer further insight into the pace of AI infrastructure investment and demand sustainability.
Let's see the full price outlook from the AMD technical analysis:
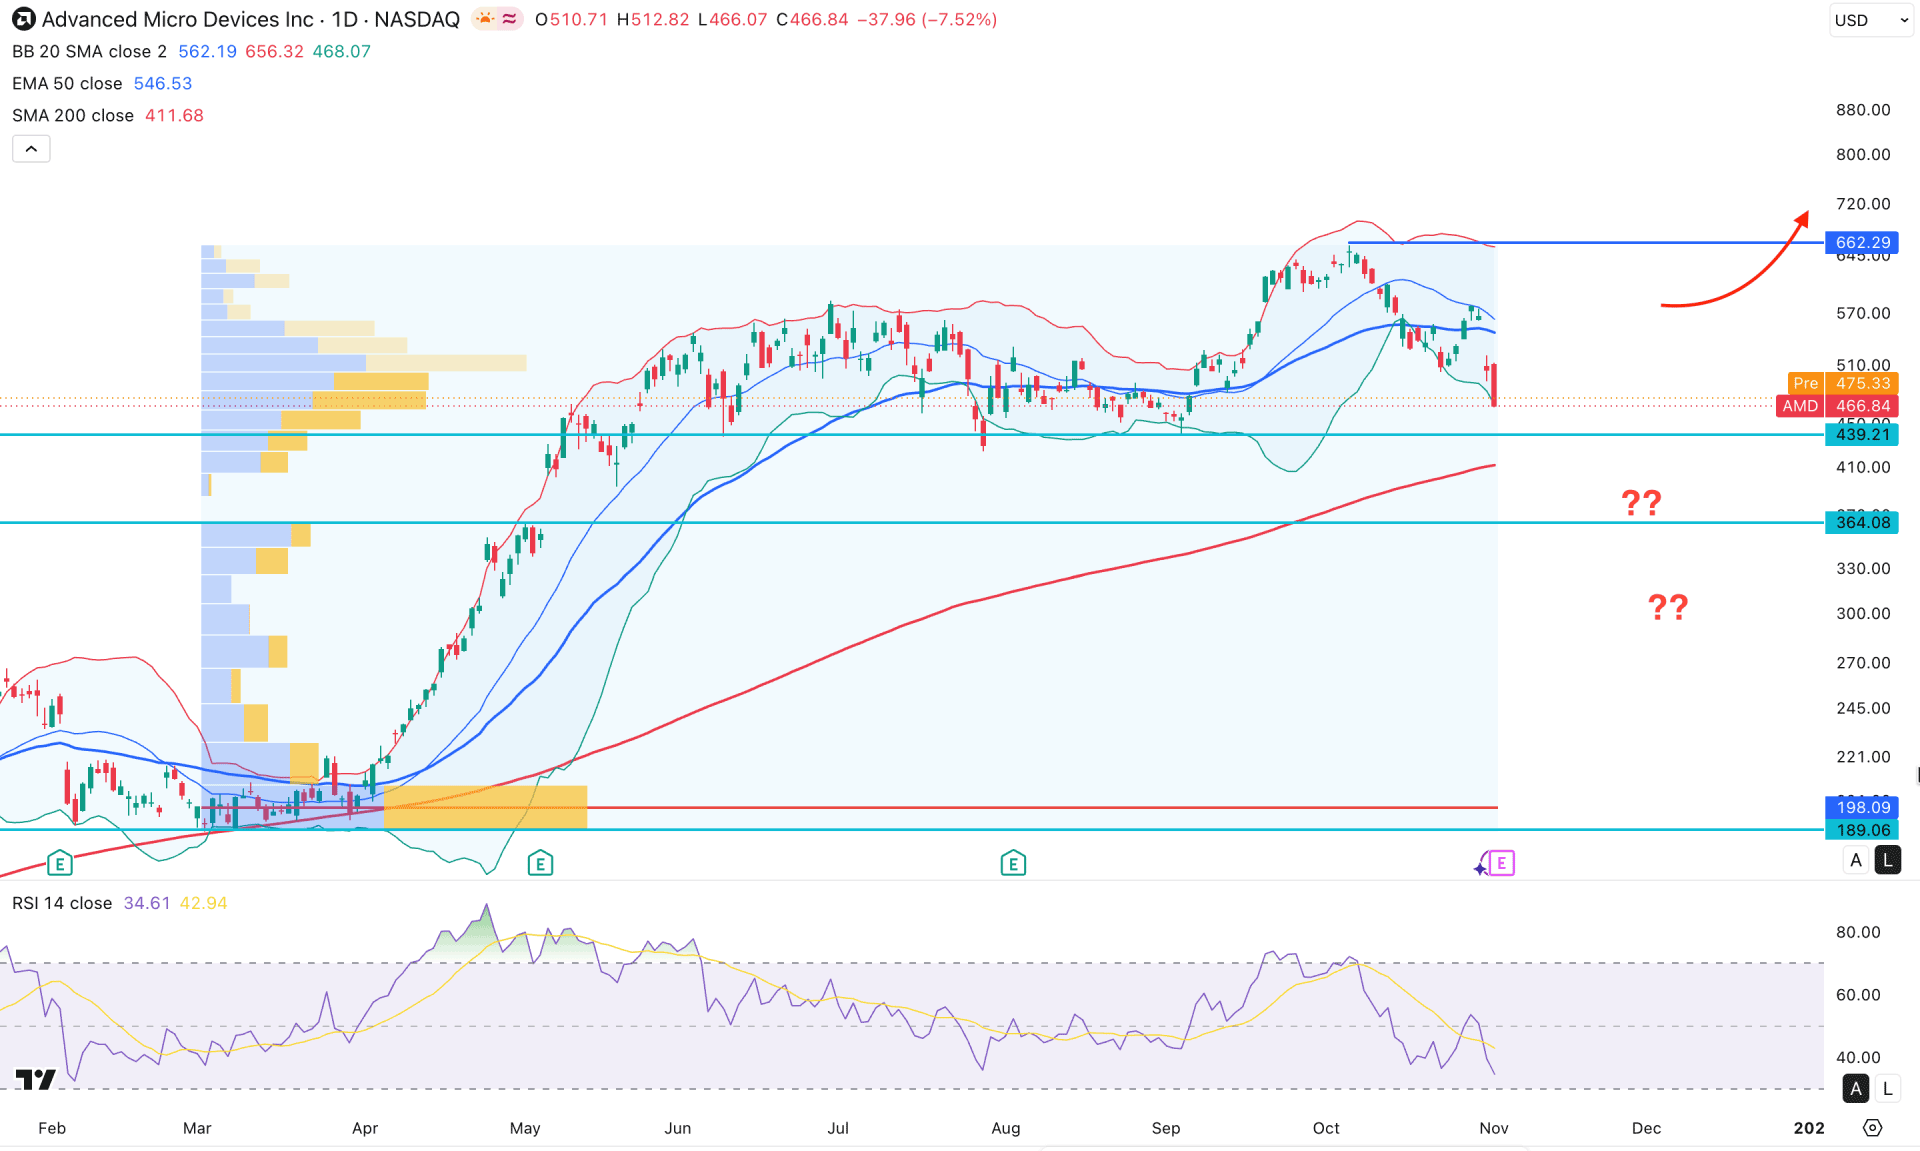
In AMD's daily chart, a prolonged bullish trend is visible, though the stock has been trading sideways for a considerable time. The most recent bullish attempt from the September 2026 bottom failed to sustain momentum and fell back into the consolidation zone. This raises questions about the strength of bullish continuation, but it also offers a discounted price to investors.
On the higher timeframe, price action looks sideways, trading in the bullish peak area with no sign of continuation momentum. The monthly candle is trading at a crucial support area. From here, a decent downside correction is possible. Moreover, the weekly timeframe shows a strong buy-side liquidity sweep, even though the price is holding above the crucial support of 439.21. As long as the price remains above this crucial weekly support level, we may anticipate a bullish continuation.
In terms of volume, sellers are still favored, as no significant buying activity has been seen at the recent bullish peak. According to the high volume profile indicator, the most significant level since March 2026 is 198.09, which is well below the current price. As long as price stays above this line, a bullish continuation remains possible, even if there is room for a bearish correction.
In the indicator window, the most recent price is at the lower Bollinger Band line and is testing the crucial support level below the 50-day EMA. Meanwhile, the 200-day SMA remains below the current price and hovers near the 439.21 critical support area.
In the secondary indicator window, the Relative Strength Index (RSI) may rebound; however, the current line is at its lowest level in the last six months. Still, the RSI has more room to move downward, as the 30.00 oversold level is below the current line.
Based on market structure, multiple support areas lie below the current price, and the 200 SMA is a key level to watch. The ongoing downside correction might test the 439.21 primary support level before testing the 200 SMA. However, the extreme support area is at 364.08, which could be tested before a bullish rebound forms. On the bullish side, a rebound above the 50 EMA could open a long opportunity targeting the 700.00 psychological resistance level.
On the other hand, ongoing downside pressure and consolidation below the 200 SMA could increase the chance of a new swing low below 364.08. In that case, the ultimate target area would be the 198.09 high-volume line.
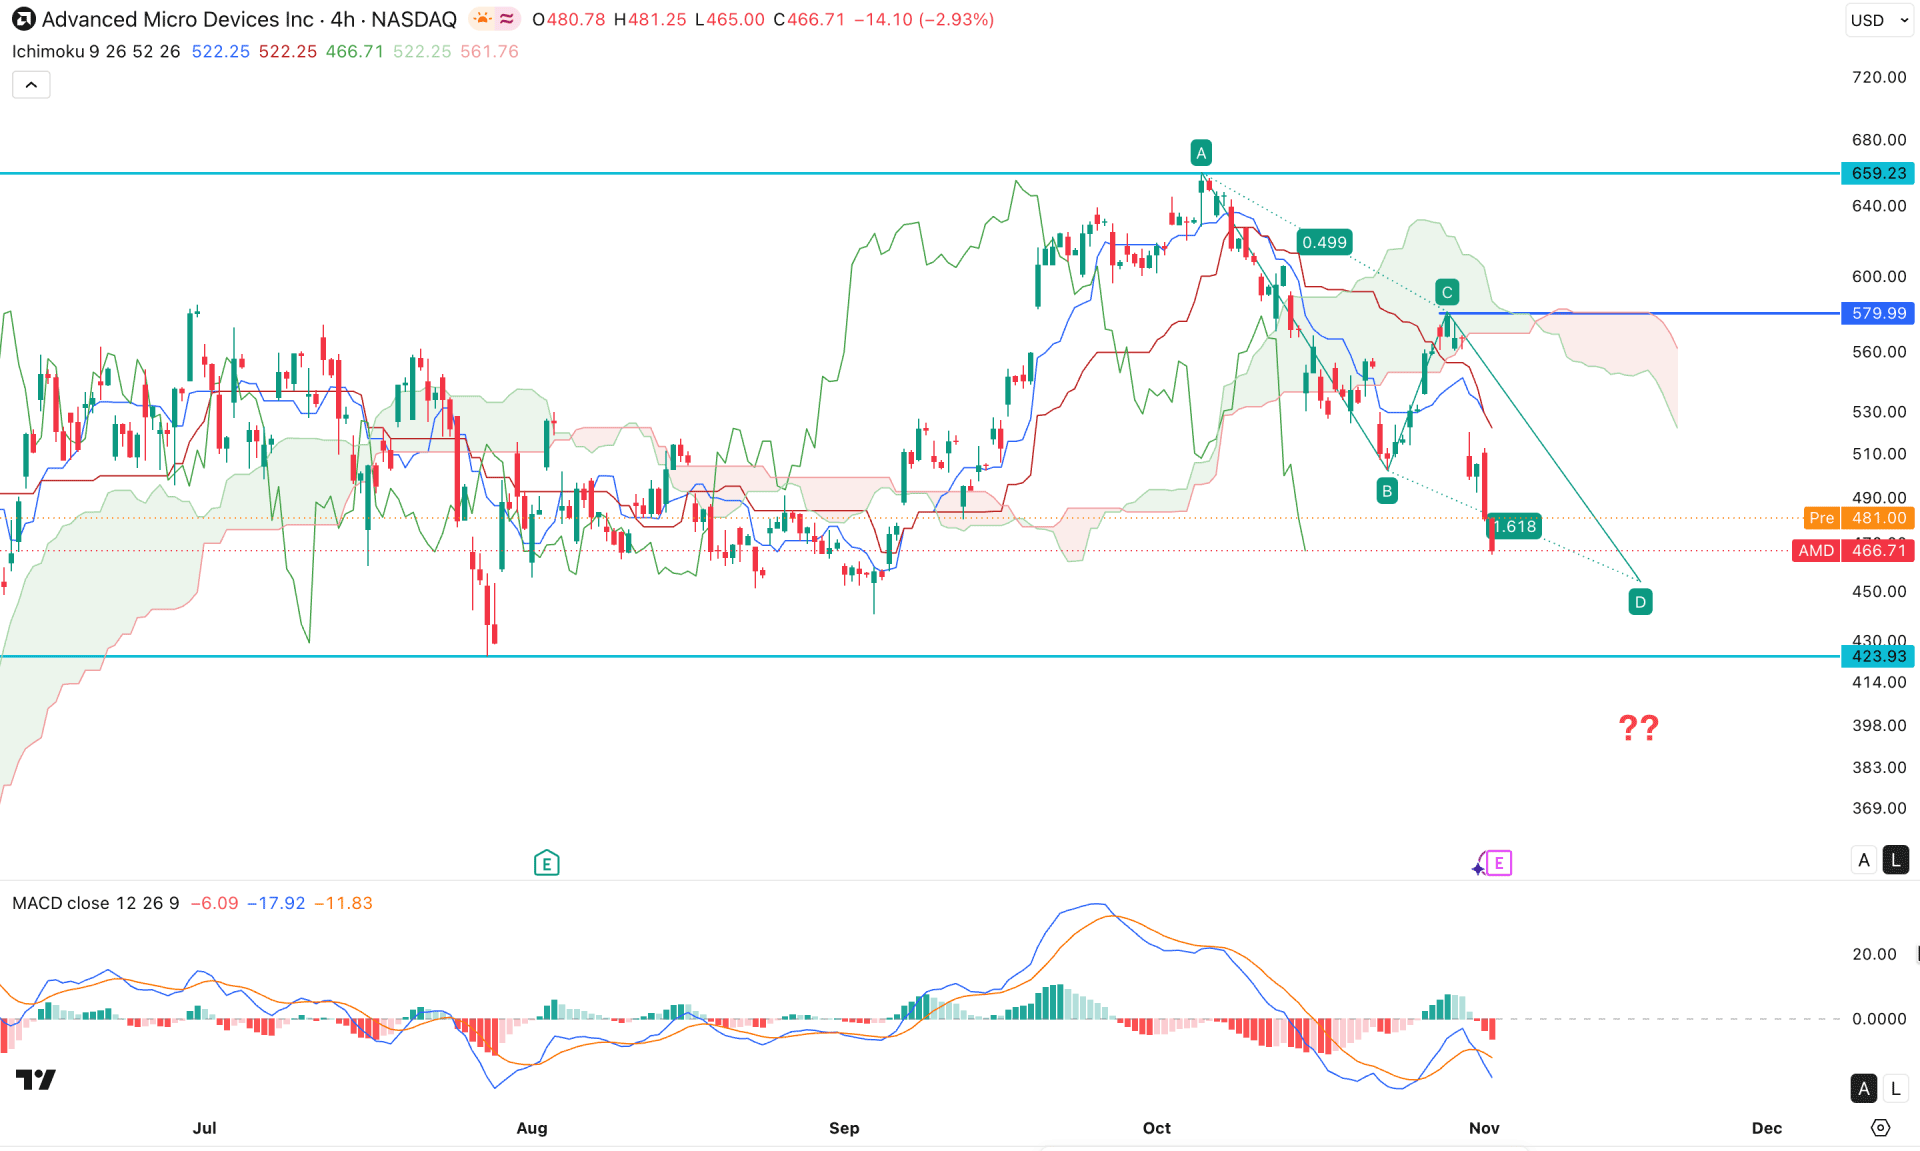
In the H4 timeframe, AMD stock is trading within an extreme corrective structure where the most recent price failed to hold the bullish structure above the cloud area. As a result, the price rebounded lower with counter-momentum and formed a new swing low after testing the crucial cloud resistance.
As a result, the future Kumo cloud has flipped position and is pointing lower, signaling continued bearish momentum.
In the indicator window, the MACD histogram formed a continuation pattern, creating an NPN formation with a bearish crossover in the signal line.
However, the ongoing downside pressure has a possible ABCD correction, with point D marked at 453.65, a support level. In that case, a continuation with an immediate rebound above the 500.00 psychological line would be a high-probability opportunity targeting the 659.23 resistance level.
On the other hand, the ongoing downside momentum is valid as long as the price stays below the Kumo cloud resistance zone. In that case, the immediate support level to watch is 423.93, and a break below it could open the way for a test of the 362.73 support level.
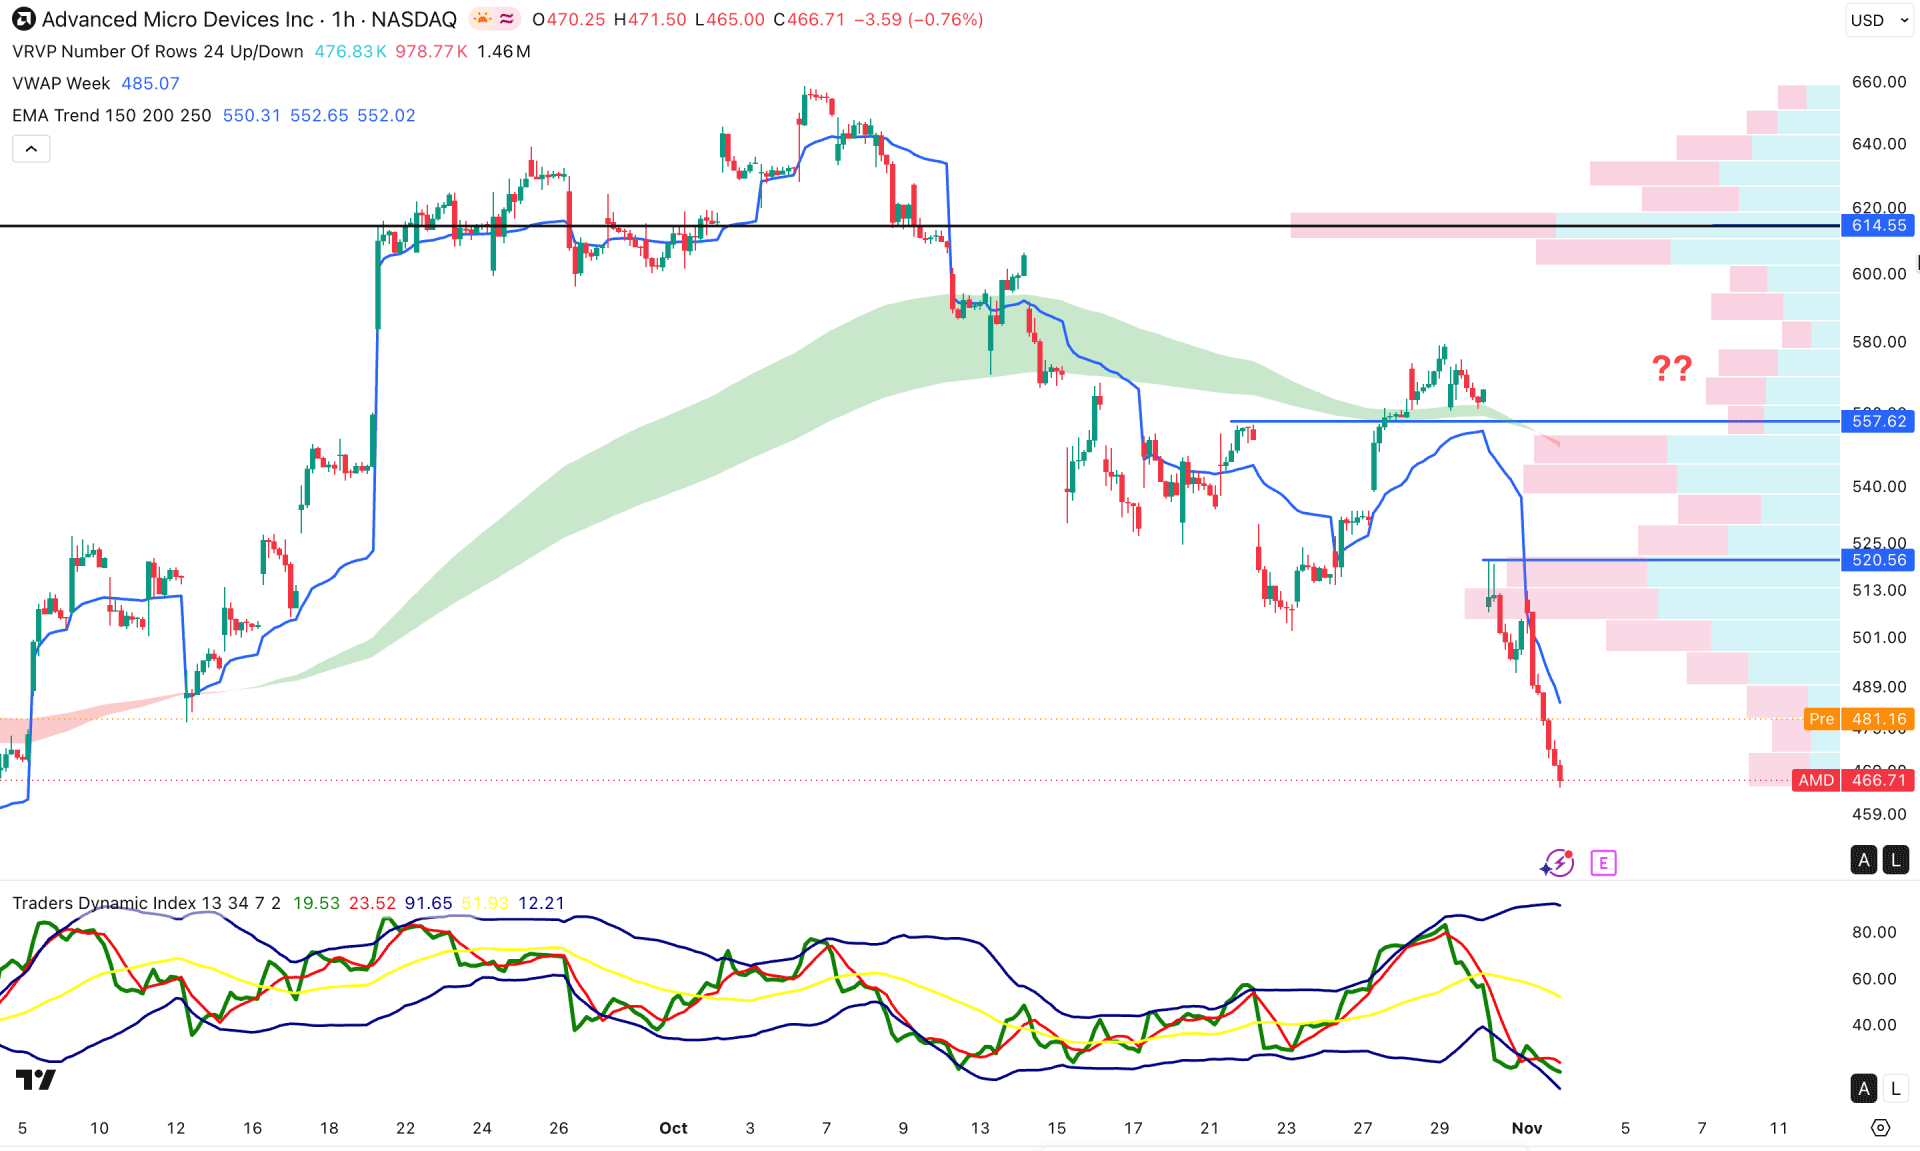
On the hourly timeframe, AMD stock is trading under ongoing bearish pressure, as price formed a new swing low after a period of sideways movement. As a result, extreme pressure is visible below the crucial dynamic resistance level, where the high line is marked at 614.55.
Moreover, the EMA wave is above the current price with a gap, increasing the possibility of a bullish mean reversion.
In the secondary indicator window, the Traders Dynamic Index (TDI) is at an extreme oversold condition, from which a decent bullish correction is possible.
Based on the overall market structure, the immediate resistance level to look at is 520.56. As long as the price remains below this line, downside pressure could extend to the 423.15 support area.
On the other hand, a recovery above the 520.56 resistance could increase the possibility of testing the 614.55 high line before forming a bullish reversal.
Based on the overall structure, AMD is trading within a long-term bullish trend, with the ongoing consolidation awaiting confirmation from the upcoming earnings report. Any positive surprise from the earnings outlook could encourage investors to join the bull run from the support area. However, a weaker-than-expected earnings report could push the stock to form a bearish breakout, creating a new swing low from the ongoing range-bound market.


