
Published: May 22nd, 2024
Investor elation over Advanced Micro Devices (AMD) artificial intelligence processors propelled the stock to an all-time high in early March. However, shares declined before competitor Nvidia (NVDA) introduced new AI processors. This decline may cause some investors to question whether AMD stock is a decent investment.
AMD and Nvidia are competitors in the PC and server CPU and GPU markets, respectively, and for gaming consoles and data centers. After transitioning to a fabless semiconductor business in March 2009 and spin-off its factories as GlobalFoundries (GFS), AMD, established in May 1969, went public in September 1972.
Under the leadership of CEO Lisa Su, AMD has entered a new era since October 2014, when Ryzen PC processors and Epyc server CPUs were introduced in 2017. Under her direction, AMD has surpassed Intel in the production of CPUs with reduced node sizes, thereby improving their speed and performance. Currently, AMD processors are manufactured by Taiwan Semiconductor Manufacturing (TSM) at a 4-nanometer scale.
By coordinating significant acquisitions, Lisa Su has enhanced the data center capabilities of AMD. By acquiring Xilinx in an all-stock transaction for $49 billion in February 2022, AMD expanded its portfolio of specialty processors. The stock of AMD increased in response to this news. AMD concluded the acquisition of distributed computing startup Pensando Systems for $1.9 billion in May 2022, thereby enhancing the capabilities of its data centers. In response to the announcement, AMD stock increased 6.6%.
AMD increased its market share in CPUs for personal computers and servers during the first quarter, per Mercury Research. Since the previous year, AMD's share of PC processor sales has increased from 17% to 20.6%. Its market share for desktop PC processors rose from 19.2% to 23.9%, and for notebook PC processors, it increased from 16.2% to 19.3%. AMD experienced an increase in its unit share within the server CPU market, rising from 18% a year ago to 23.6%.
AMD projected sales of $5.7 billion for the current quarter, with a variance of $300 million, in contrast to the $5.73 billion anticipated by analysts and the $5.36 billion reported in the previous year's second quarter. On the horizon for AMD stock is the company's Q2 earnings report, which is anticipated to be released in late July or early August.
Let's see the further aspect of this stock from the AMD technical analysis:
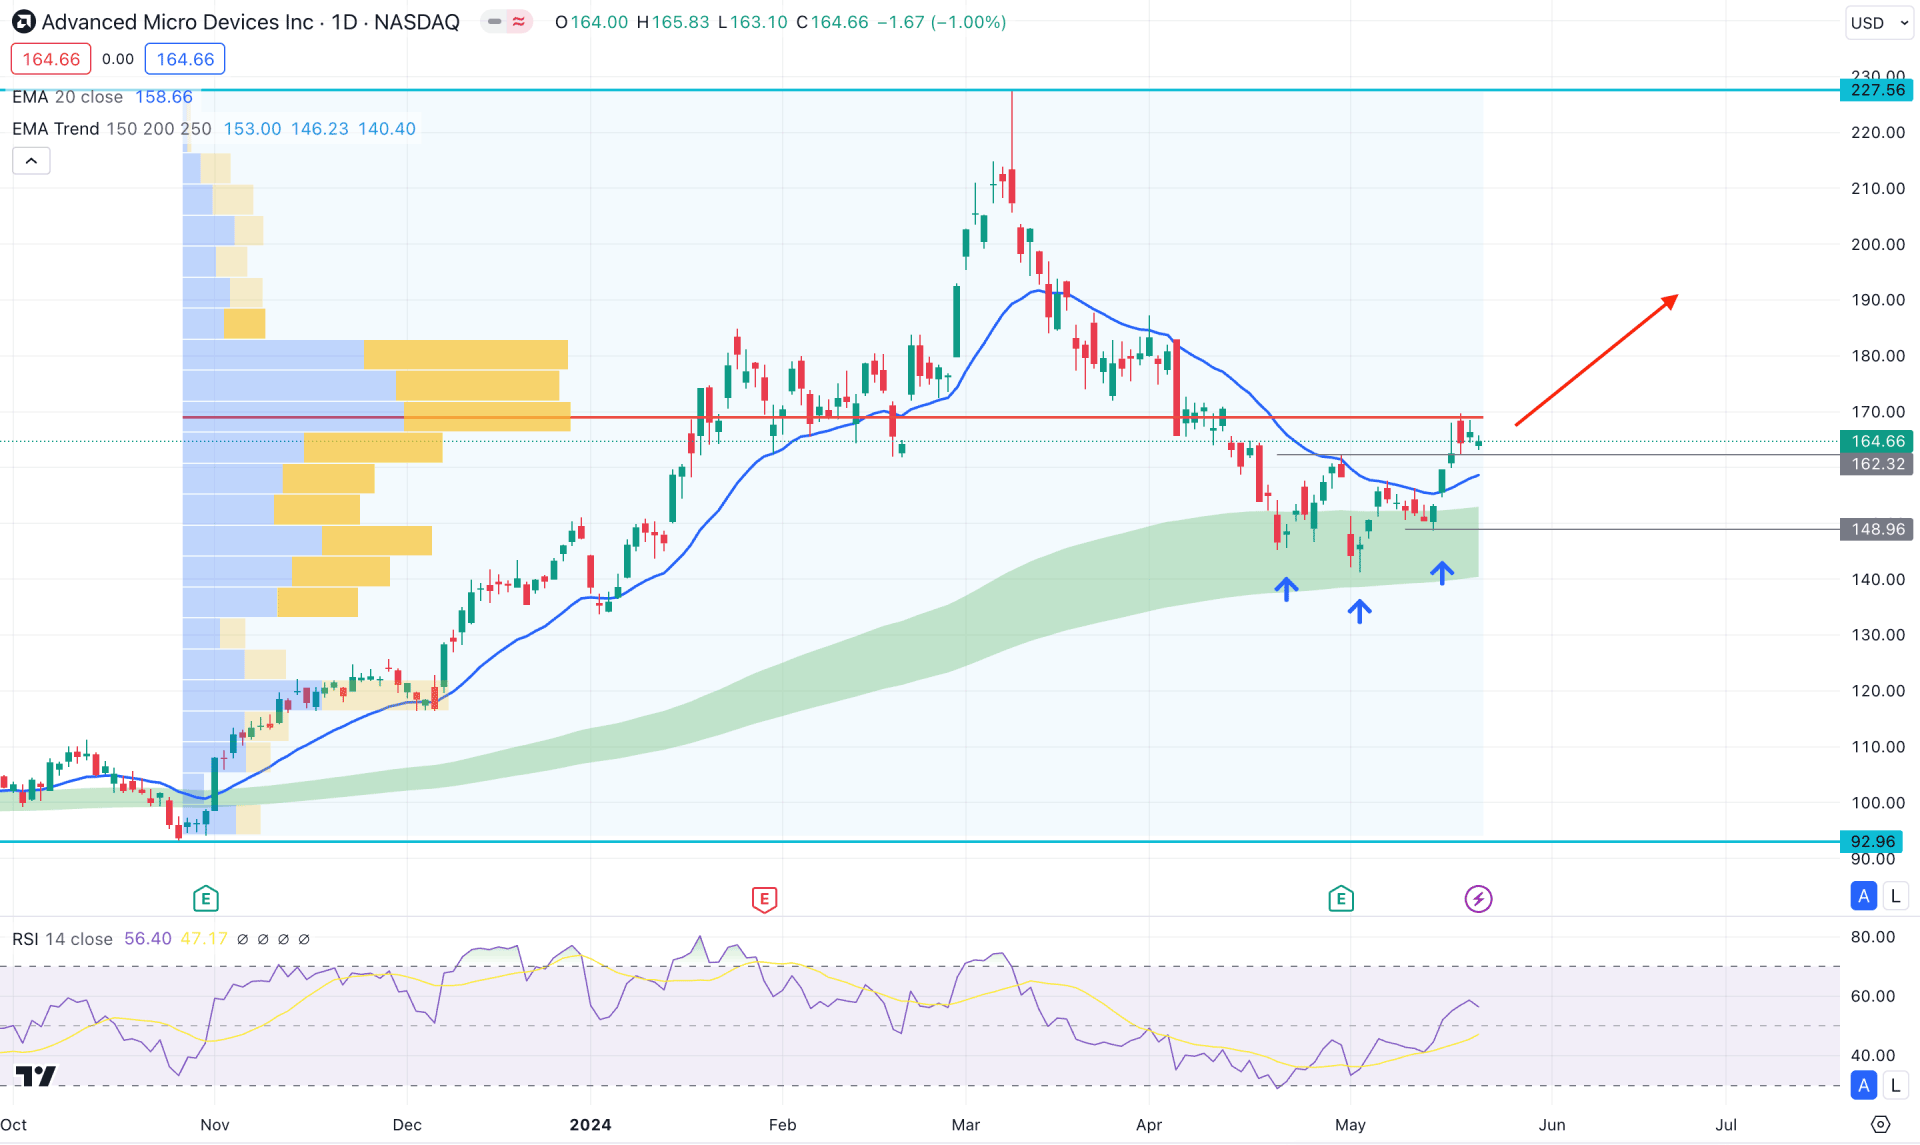
In the daily chart of AMD, the broader market direction is bullish, as the current price is aimed higher from left to right. Moreover, the most recent price showed a deeper correction from where a valid bullish reversal is also available.
In the higher timeframe, the current monthly candle trades higher after grabbing the sell-side liquidity from the March 2024 low. Therefore, as long as the current price trades above the 155.75 level, we may consider the buying pressure to extend in the coming days. Moreover, the weekly price trades above the 20 week EMA, supported by the broader trend continuation.
Looking at the volume structure, the most significant level since November 2023 is marked at the 168.88 level, which is just above the current price. Therefore, any bullish continuation with a daily candle above this high volume line could be a potential bullish continuation signal.
In the daily chart, an Inverse Head and Shoulders breakout is visible towards the major trend. In that case, a valid bottom formation is visible at the 141.13 level, which could signal a bullish pressure. Moreover, the Moving Average cloud consisting of MA from 150 to 250 remains below the current price with an upward slope. Currently, this zone is working as a major support to bulls, as an upward continuation is potent above this level. Also, the Relative Strength Index (RSI) suggests the same story, where the current RSI line hovers above the 50.00 line.
Based on the daily market outlook, AMD stock has a higher possibility of continuing higher. As a valid higher low is formed with a bullish reversal pattern a daily candle above the 170.00 level could validate the high probable long signal. In that case, the primary target of the bull run is towards the 200.00 level before reaching the 227.56 level.
Conversely, a failure to take the price above the high volume line could be a potential bearish signal. In that case, a bearish daily candle below the 20-day EMA could lower the price towards the 120.00 psychological line.
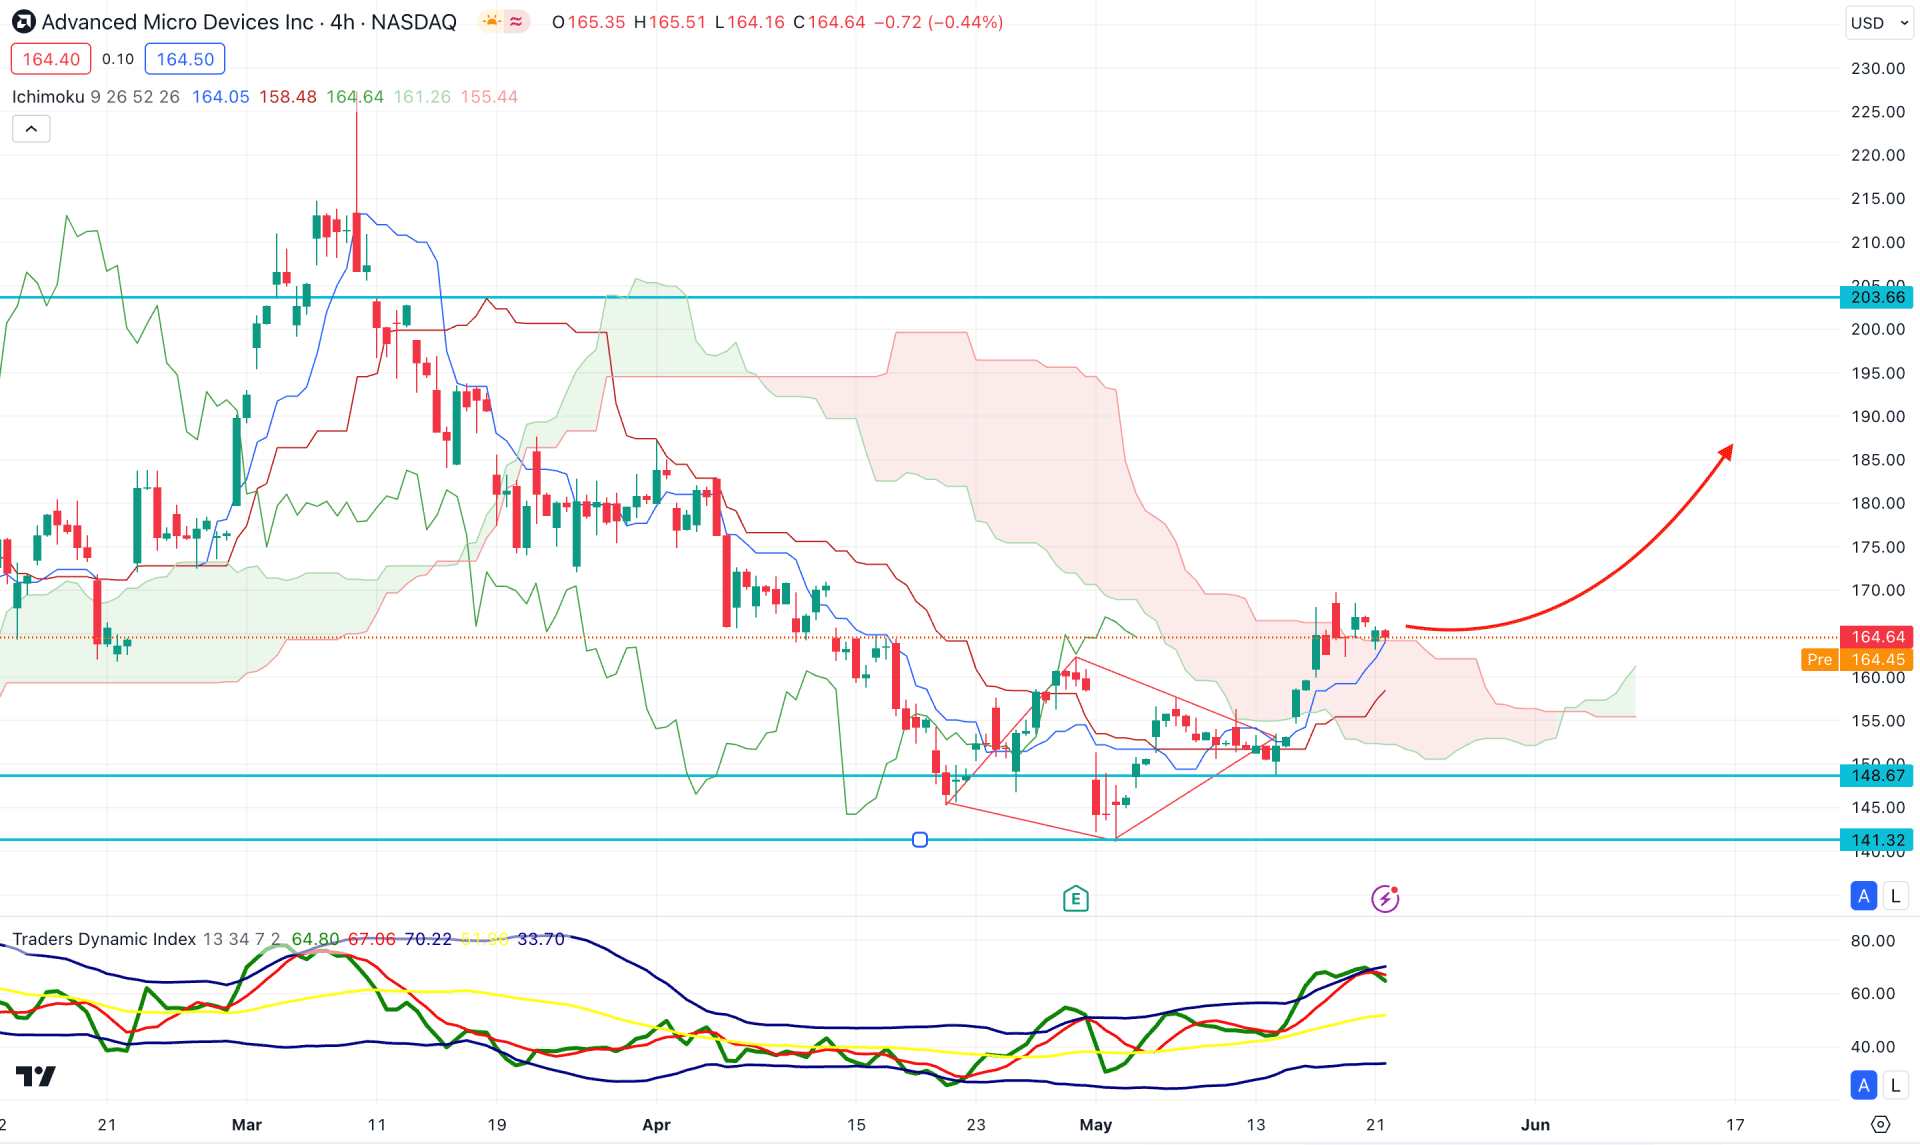
In the H4 timeframe, the recent price showed a downside correction below the Ichimoku Kumo Cloud but failed to hold the momentum. As a result, an immediate upward pressure came from the 141.32 bottom, creating a bullish pre-breakout structure at the cloud high. Moreover, the future cloud showed a bullish continuation signal, where the Senkou Span is above the Senkou Span B.
In the secondary window, the Traders Dynamic Index (TDI) reached the upper bans area, suggesting an active buying pressure.
Based on the H4 outlook, a bullish breakout is visible from the Diamond Pattern breakout, with a consolidation above the Kijun Sen level. In that case, the price has a higher possibility of moving higher and reaching the 200.00 psychological level.
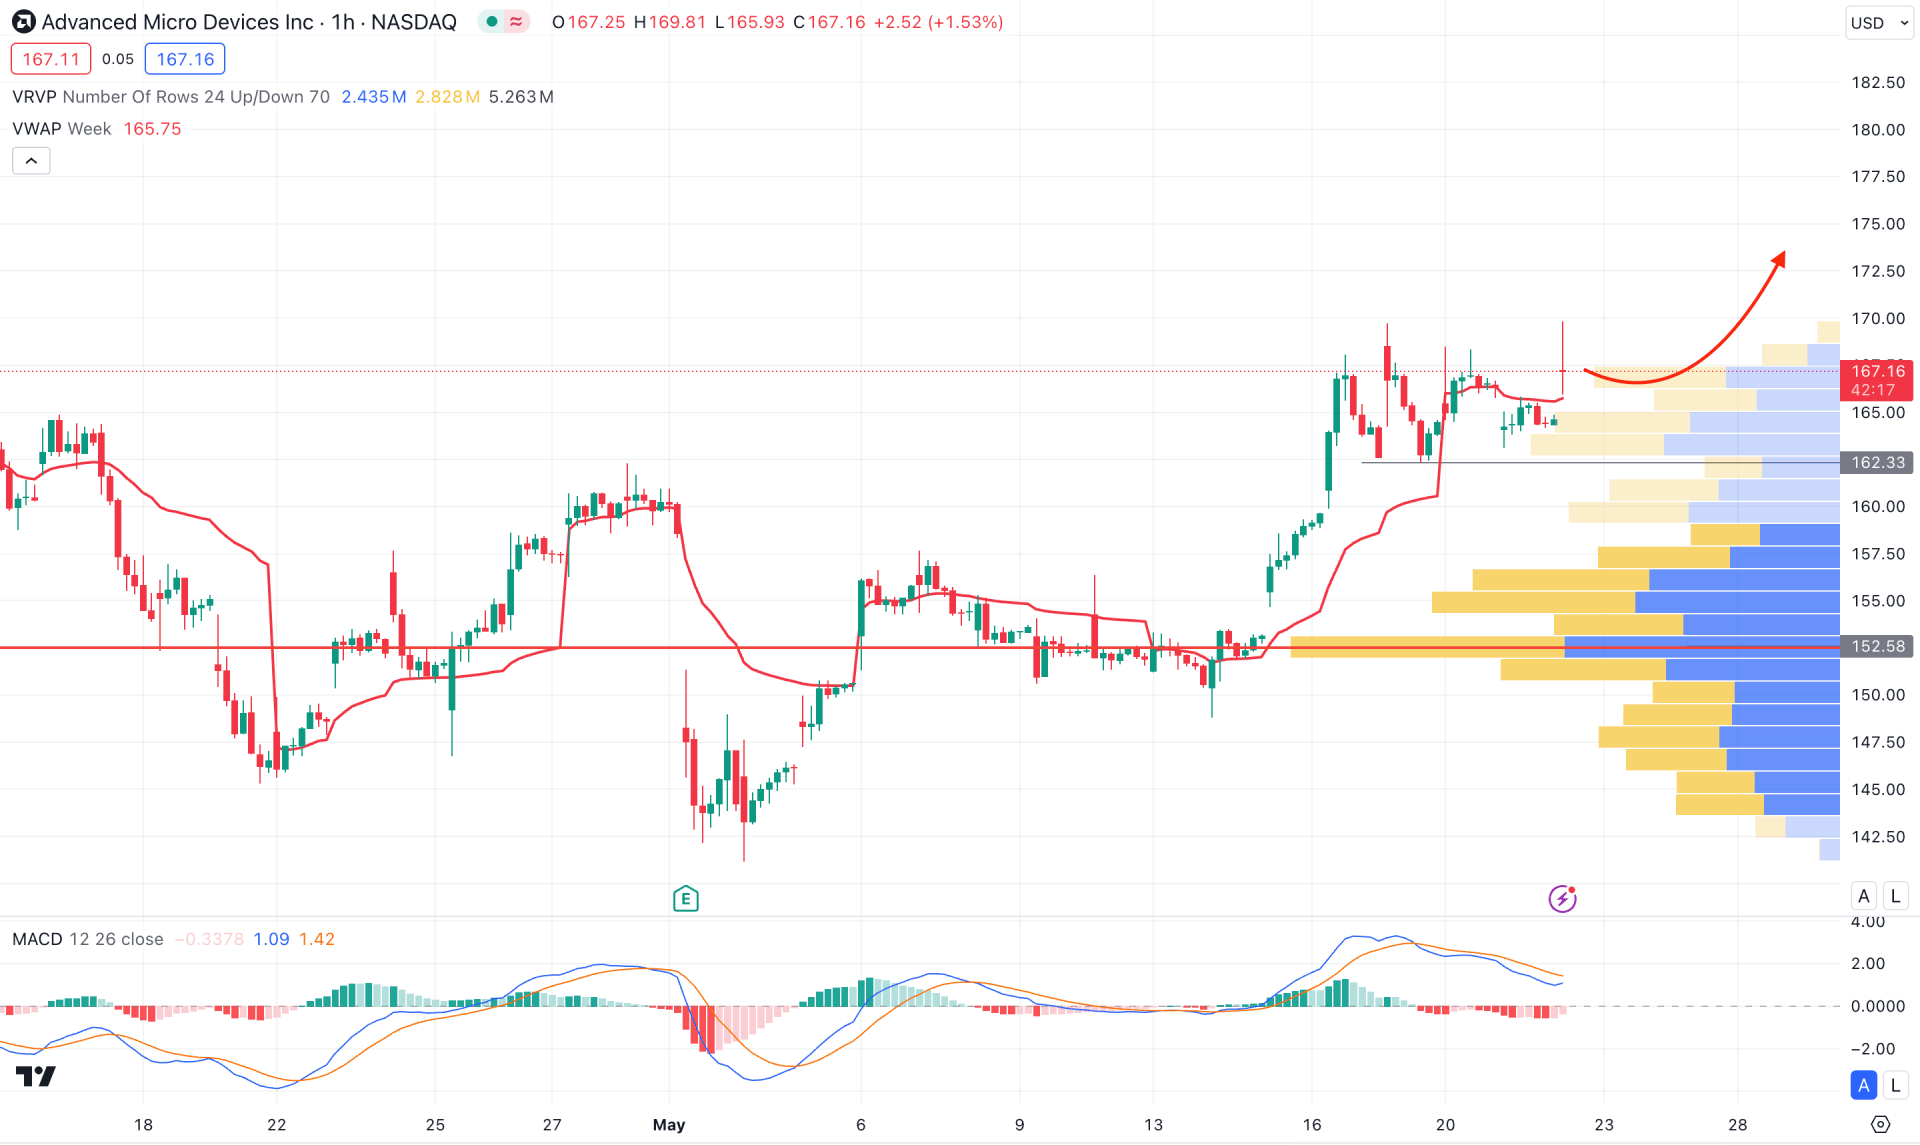
In the hourly chart, the AMD stock is trading above the visible range high volume line, suggesting an ongoing intraday buying pressure. Moreover, the weekly VWAP is below the current price and is working as an immediate support.
In the secondary window, the MACD Histogram is neutral after maintaining the downside momentum with a potential divergence with the main price swing.
Based on the hourly outlook, a bullish continuation is potent as long as the price trades above the dynamic VWAP level. However, a downside correction is possible, where an additional bullish reversal from the 162.33 to 156.00 zone could be a potential long opportunity.
Based on the current market structure, AMD stock is more likely to extending the upward pressure in the coming days. In that case, a high probable bullish continuation signal might come once the price show a valid bullish reversal from the intraday support level.


