
Published: February 7th, 2023
In 2022, Advanced Micro Devices (AMD) saw its shares drop 55% due to the steep decline in the personal computer market. As a leader in computer components, a year of significant reductions in graphics processing unit shipments had a negative impact on AMD's gaming and client segments.
However, optimistic investors have pushed up AMD's stock by 34% in 2023 due to a successful chip launch and higher-than-anticipated quarterly results. The company's data center segment has been performing well in recent quarters, giving the tech giant a positive outlook.
Over the past five years, AMD's revenue rose 264% to $23.6 billion in 2022, and its operating income has increased 435% to $1.2 billion. This impressive growth is largely attributed to the phenomenal success of its Ryzen processors, which were first introduced in 2017 and have solidified the company's position in the PC market.
Although declines in chip sales have impacted AMD's desktop CPU business, the company has made strategic diversifications since 2017. In addition to its presence in data centers, the semiconductor company acquired Xilinx in 2020 for $35 billion. Xilinx develops processors for specialized tasks such as video compression or encryption and has significantly contributed to AMD's embedded segment revenue, which reached $1.4 billion in its latest quarter.
The broader outlook of this instrument is solid from the fundamental perspective, but investors should focus on finding the best price to buy it.
Let’s see the future price direction of AMD stock from the Advanced Micro Devices (AMD) Technical analysis:
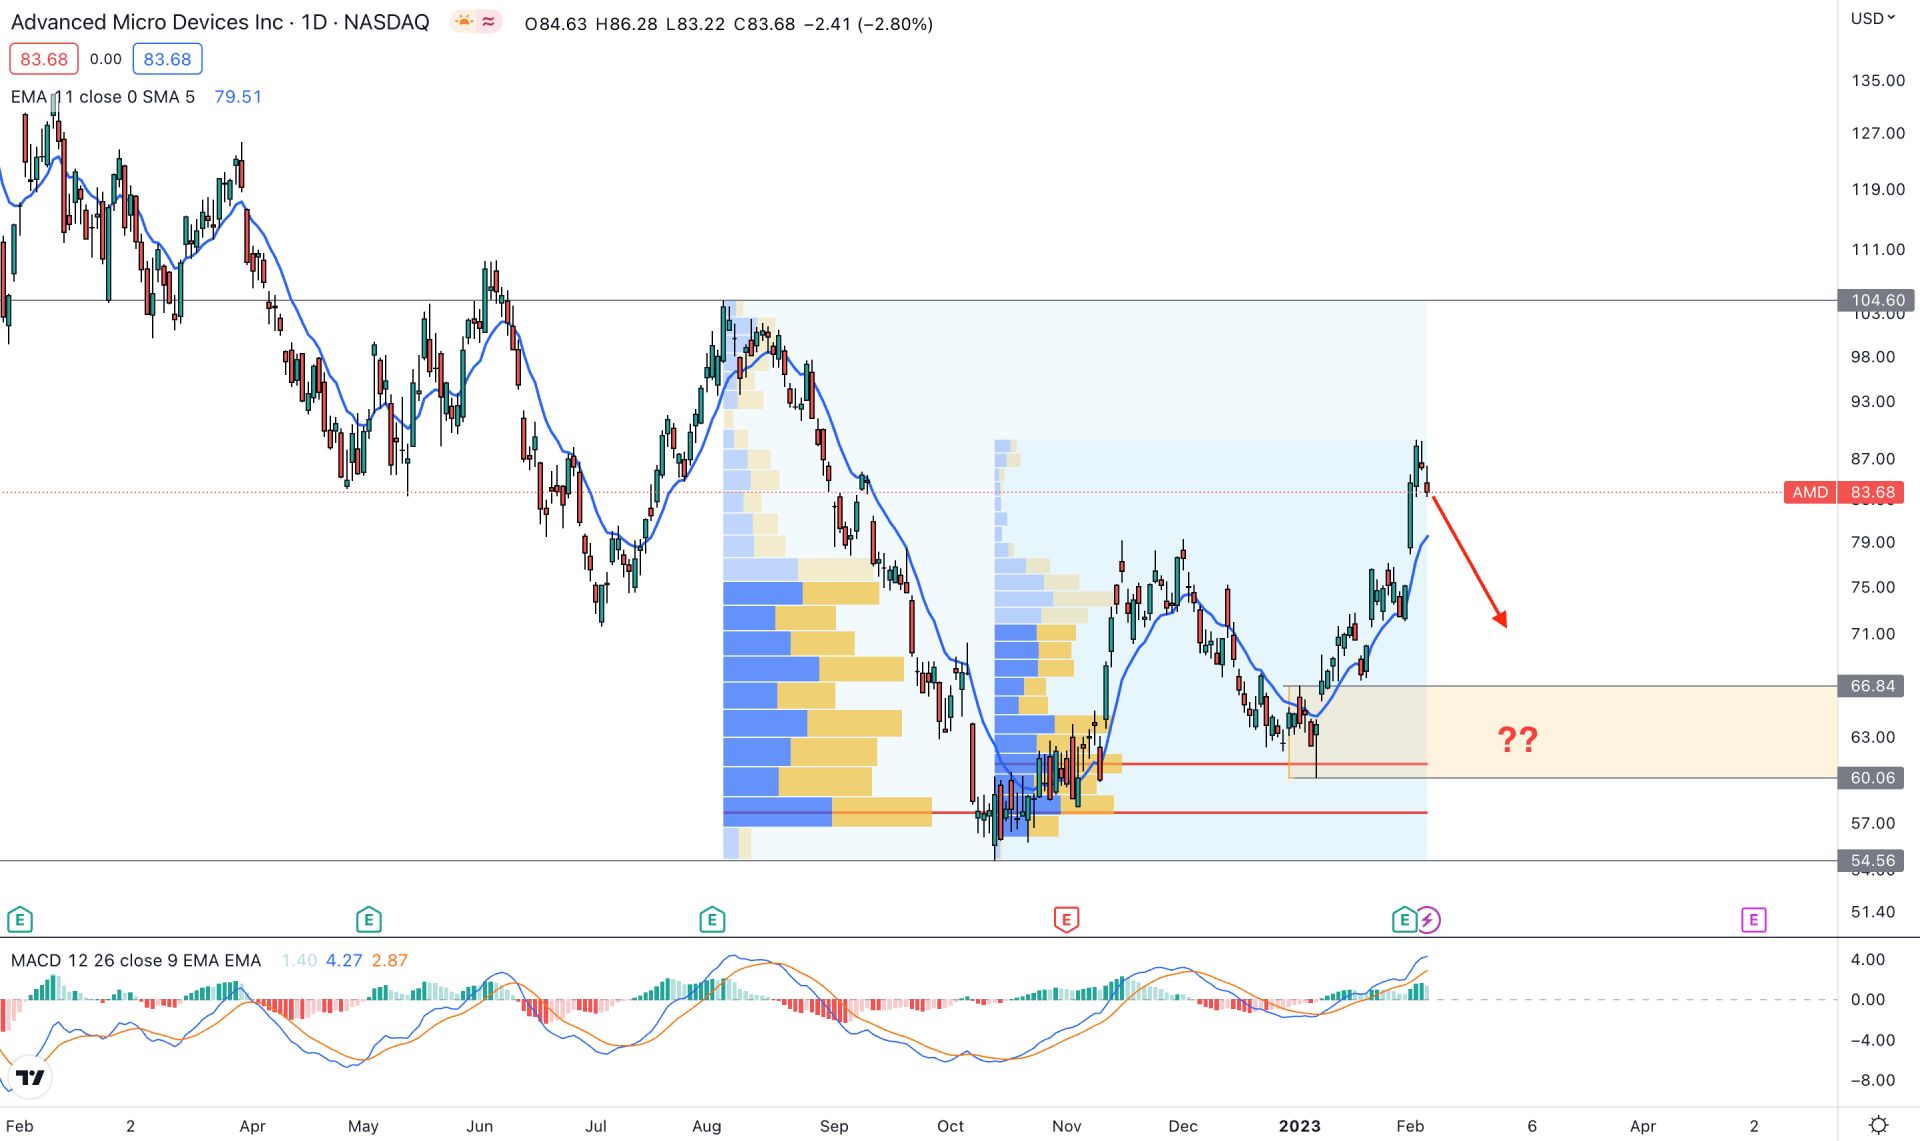
In the daily price of AMD, the broader bearish outlook is questionable from multiple buying pressure from bottoms with a higher trading volume. It is a sign that bulls are interested in this instrument at a lower price, which can offer a buying opportunity.
From July 2022 to February 2023, the most active level was spotted at 57.69 level, which is far below the current price. Moreover, another high volume level from October to February was also spotted at the 61.11 level. The current price is barely 30% higher from these zones, so the overall outlook would be bullish with a minor bearish correction possibility.
In the main chart, the dynamic 20 Day EMA is below the current price, aimed higher, signaling a dynamic support. Moreover, the indicator window shows an overbought price, as the current MACD EMA’s have reached the overbought area.
Based on the daily outlook of AMD, the overall structure is bullish, where sufficient downside pressure is still pending. Therefore, a bearish correction and buying pressure from 66.85 to 60.00 could offer a buying opportunity towards the target of 104.60 level. However, as the current buying pressure is strong, any bullish rejection from dynamic 20 EMA could offer an early buying opportunity.
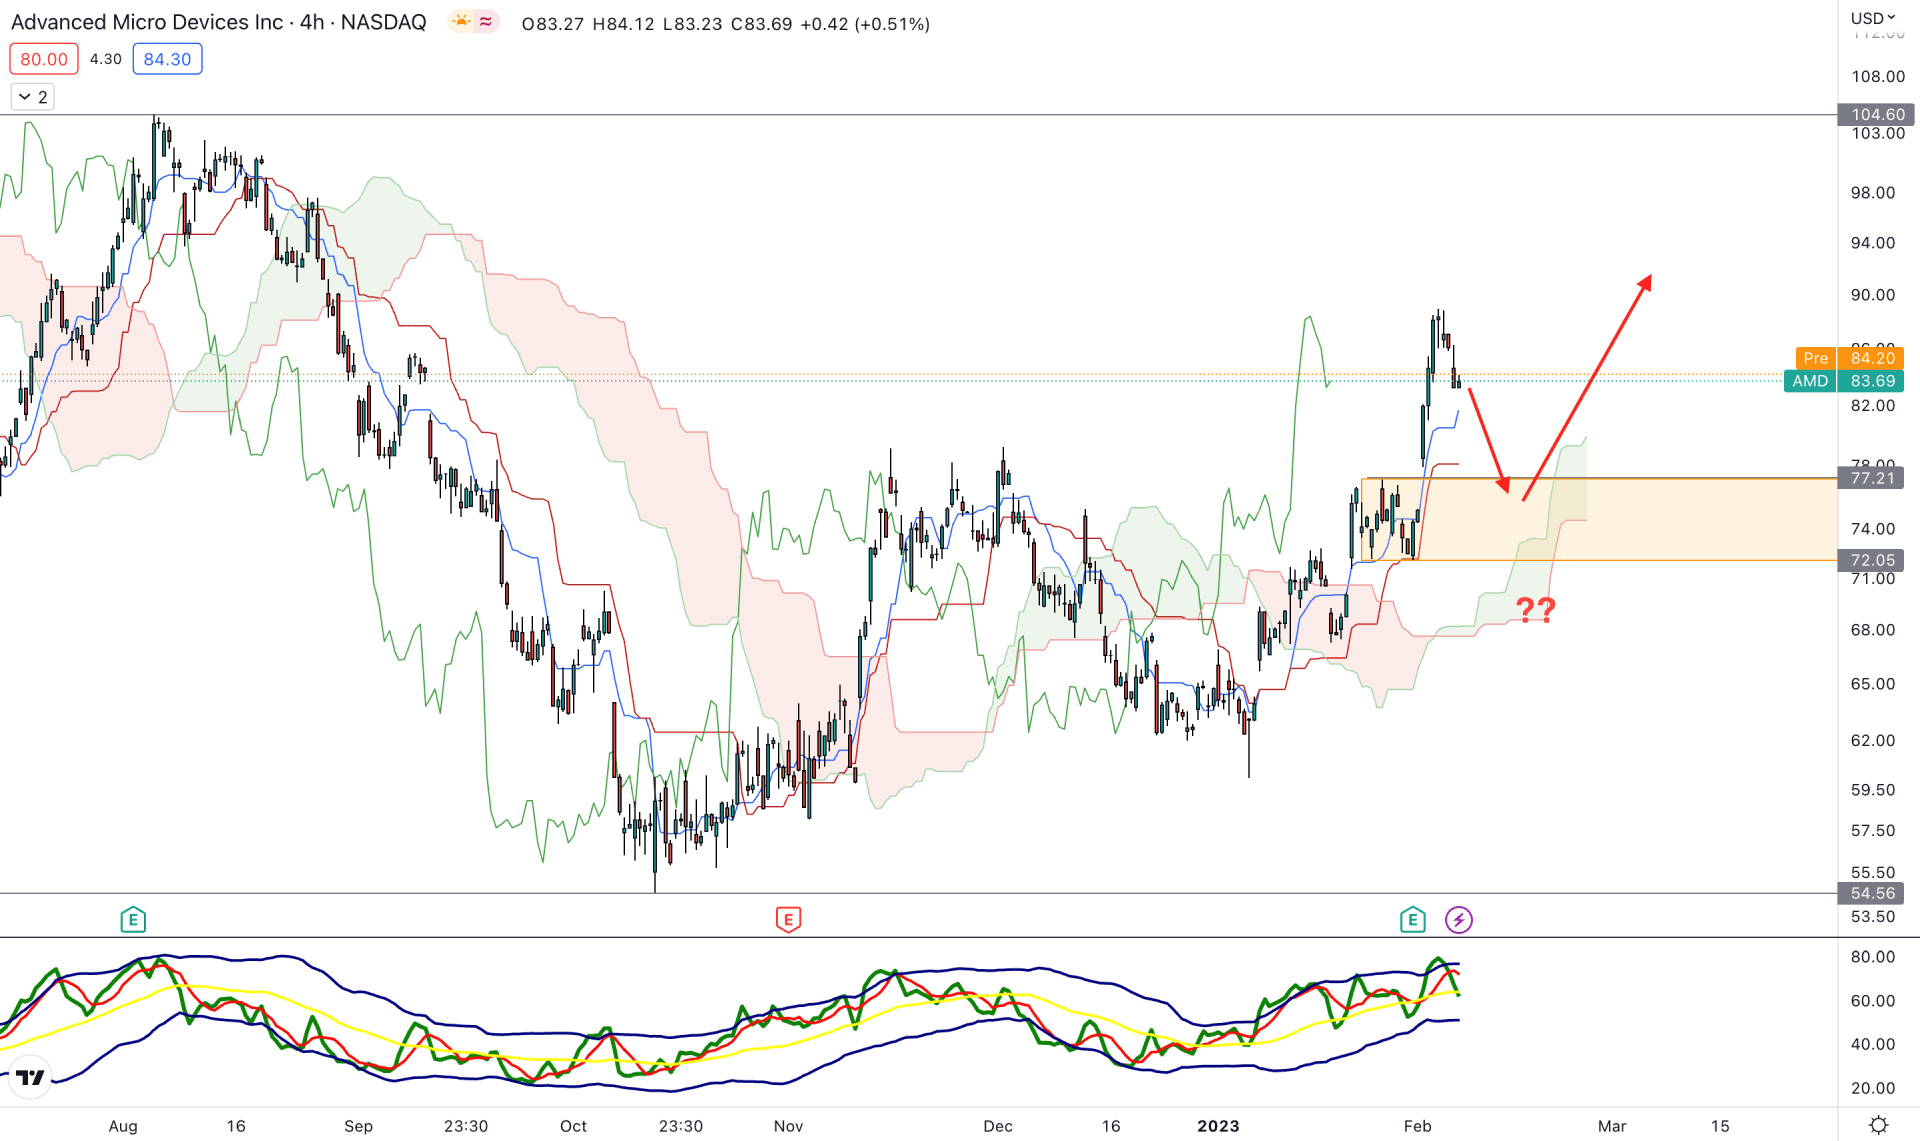
In the H4 timeframe, the current price trades within a strong buying momentum above the Ichimoku Kumo Cloud. In that case, any upside trading opportunity is more likely to provide a buy signal.
In the main chart, the future cloud is solid for bulls as the Senkou Span A is above B. Moreover, the Lagging Span is above the current price, signaling a strong buy-side momentum.
The indicator window shows a different story as the current TDI level reached the overbought zone. It is a sign that bulls have reached the peak, and a downside correction is pending.
Based on the H4 price outlook, any bullish pressure from the 77.21 to 72.00 area could provide a high probable buying possibility, towards the target of 105.00 level.
The alternative approach is to wait for the price to come below the 71.00 psychological level, which can extend the downside momentum towards the 60.00 level.
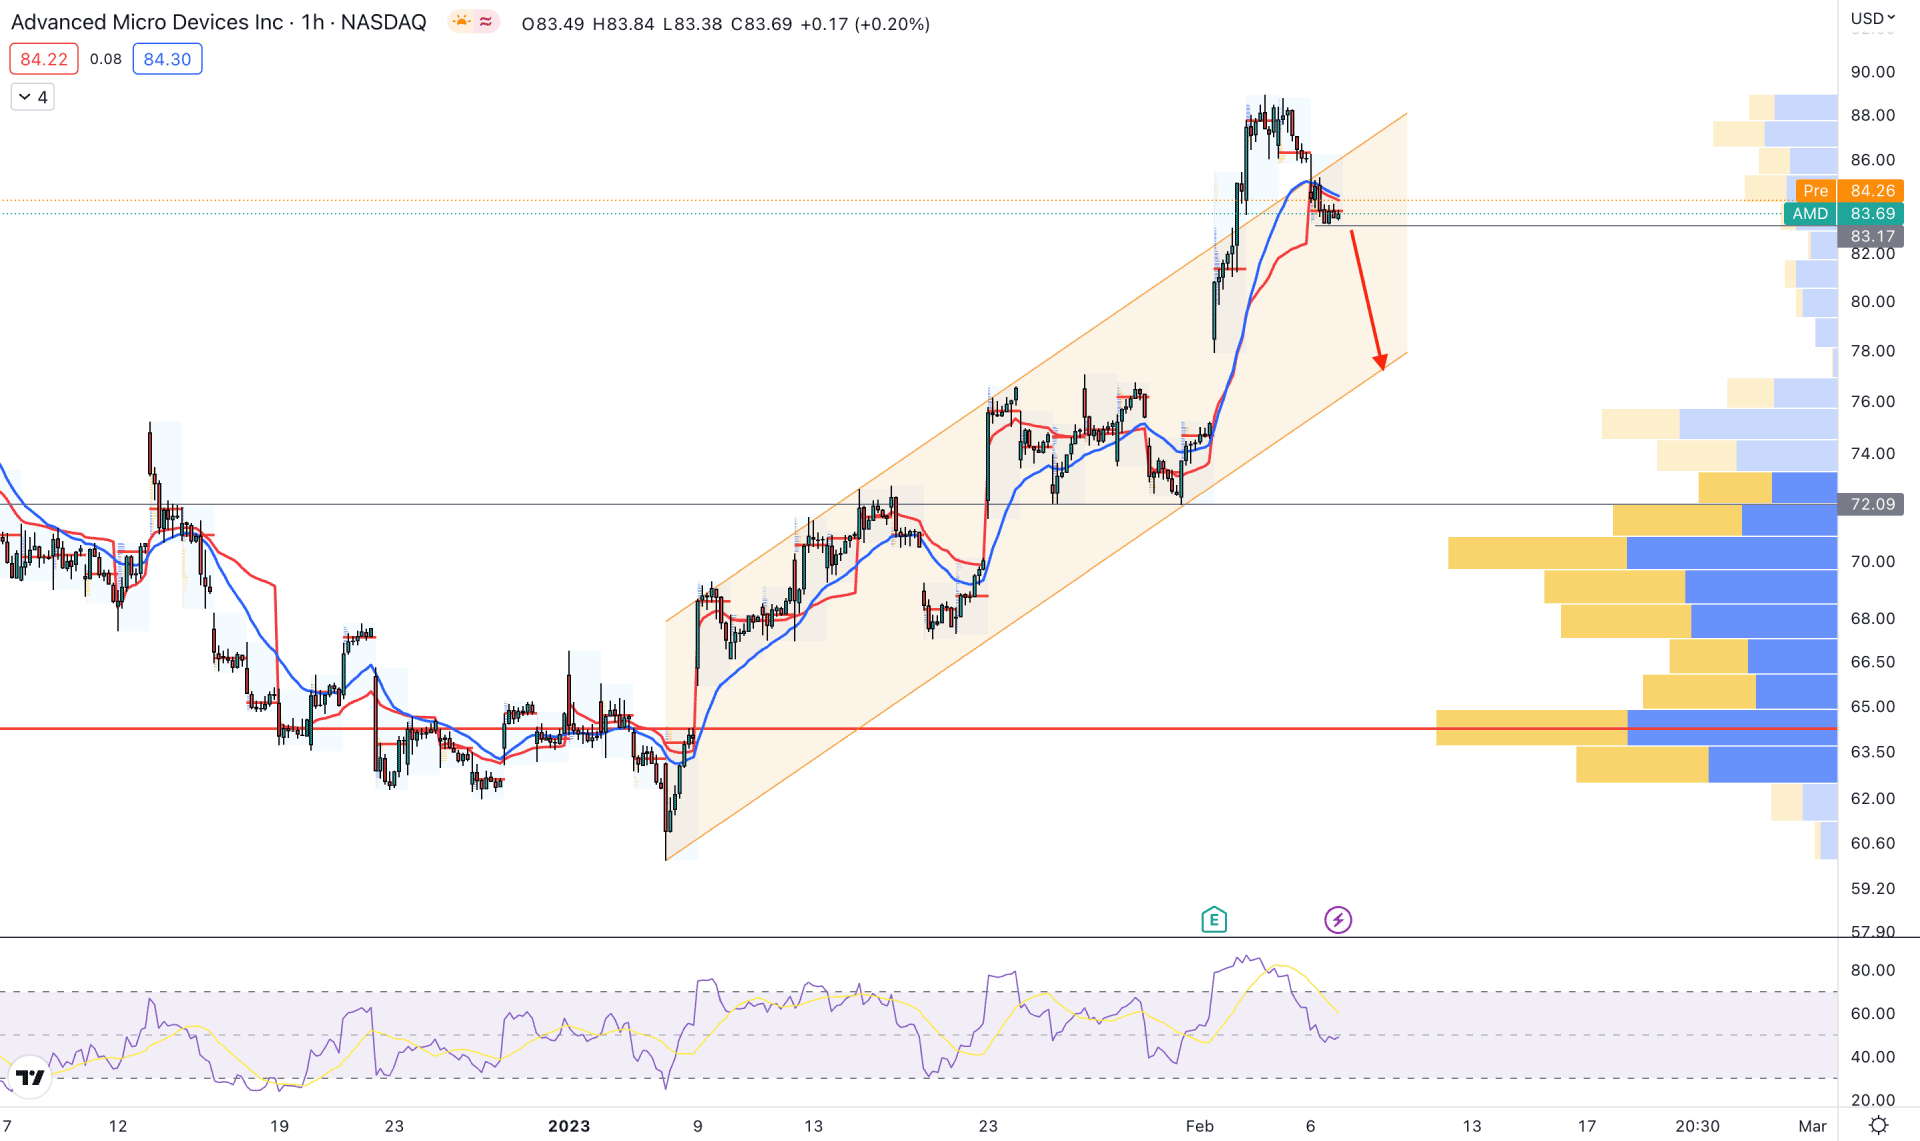
In the hourly AMD chart, the current price is overextended from the ascending channel, while the gap between the price and the high volume 64.39 level has extended. It is a sign that the downside pressure is solid in this instrument, even if the broader outlook is bullish.
The dynamic 20 EMA and VWAP shifted directions by moving above the price, while the latest intraday high volume level is above the price.
Based on this structure, further downside pressure is possible in this instrument, where the main target is to reach the 72.00 support level.
Based on the current price outlook, AMD stock can move higher once the bearish correction is over. Investors should closely monitor how the price trades on the intraday demand zone to find the best place to join the buy rally.


