Published: September 10th, 2024
Adobe Systems (ADBE) will announce a quarterly profit of $4.53 for each share in the forthcoming release. This indicates a 10.8% rise in earnings year over year. Revenues of $5.37 billion are expected, representing a 9.7% increase from the same quarter last year.
The average EPS forecast for the quarter throughout the previous 30 days is reflected at this level, which indicates no revision.
A more complete view can be obtained by closely examining analysts' projections for certain of the company's critical metrics, even though investors usually use consensus revenue and earnings projections as a benchmark to assess the company's every quarter performance.
In the subsequent quarter, the total new Annualized Recurring Revenue (ARR) from Adobe's Digital Media division amounted to $487 million, a rise from $470 million in the same period the previous year. The stock increase the day the results were released assisted Adobe in posting better-than-expected outcomes.
Visible Alpha reports that analysts are predicting a minor drop in gross new Digital Media ARR to $462 million in the third period. Investors may still witness a "reacceleration" of the ratio in the remaining half of the year, according to Oppenheimer specialists.
Investors are also expected to watch for updates regarding Adobe's AI monetization strategies. The company has previously mentioned that a large number of Creative Cloud subscribers have recently upgraded to gain access to Firefly, its generative artificial intelligence model. Along with Firefly, the company also added generative artificial intelligence (AI) to Document Cloud and Adobe Express for company operations.
The business might also unveil recent AI services at its October Adobe MAX meeting. Researchers at Oppenheimer predicted that "generative video, editing, and audio dubbing solutions approaching beta" may be revealed.
After the company revealed its better-than-expected second-quarter outcomes, Adobe's shares have jumped almost 23%, but they continue to lose about 5% of their value this year.
Let's see the upcoming market outlook from the ADBE technical analysis:

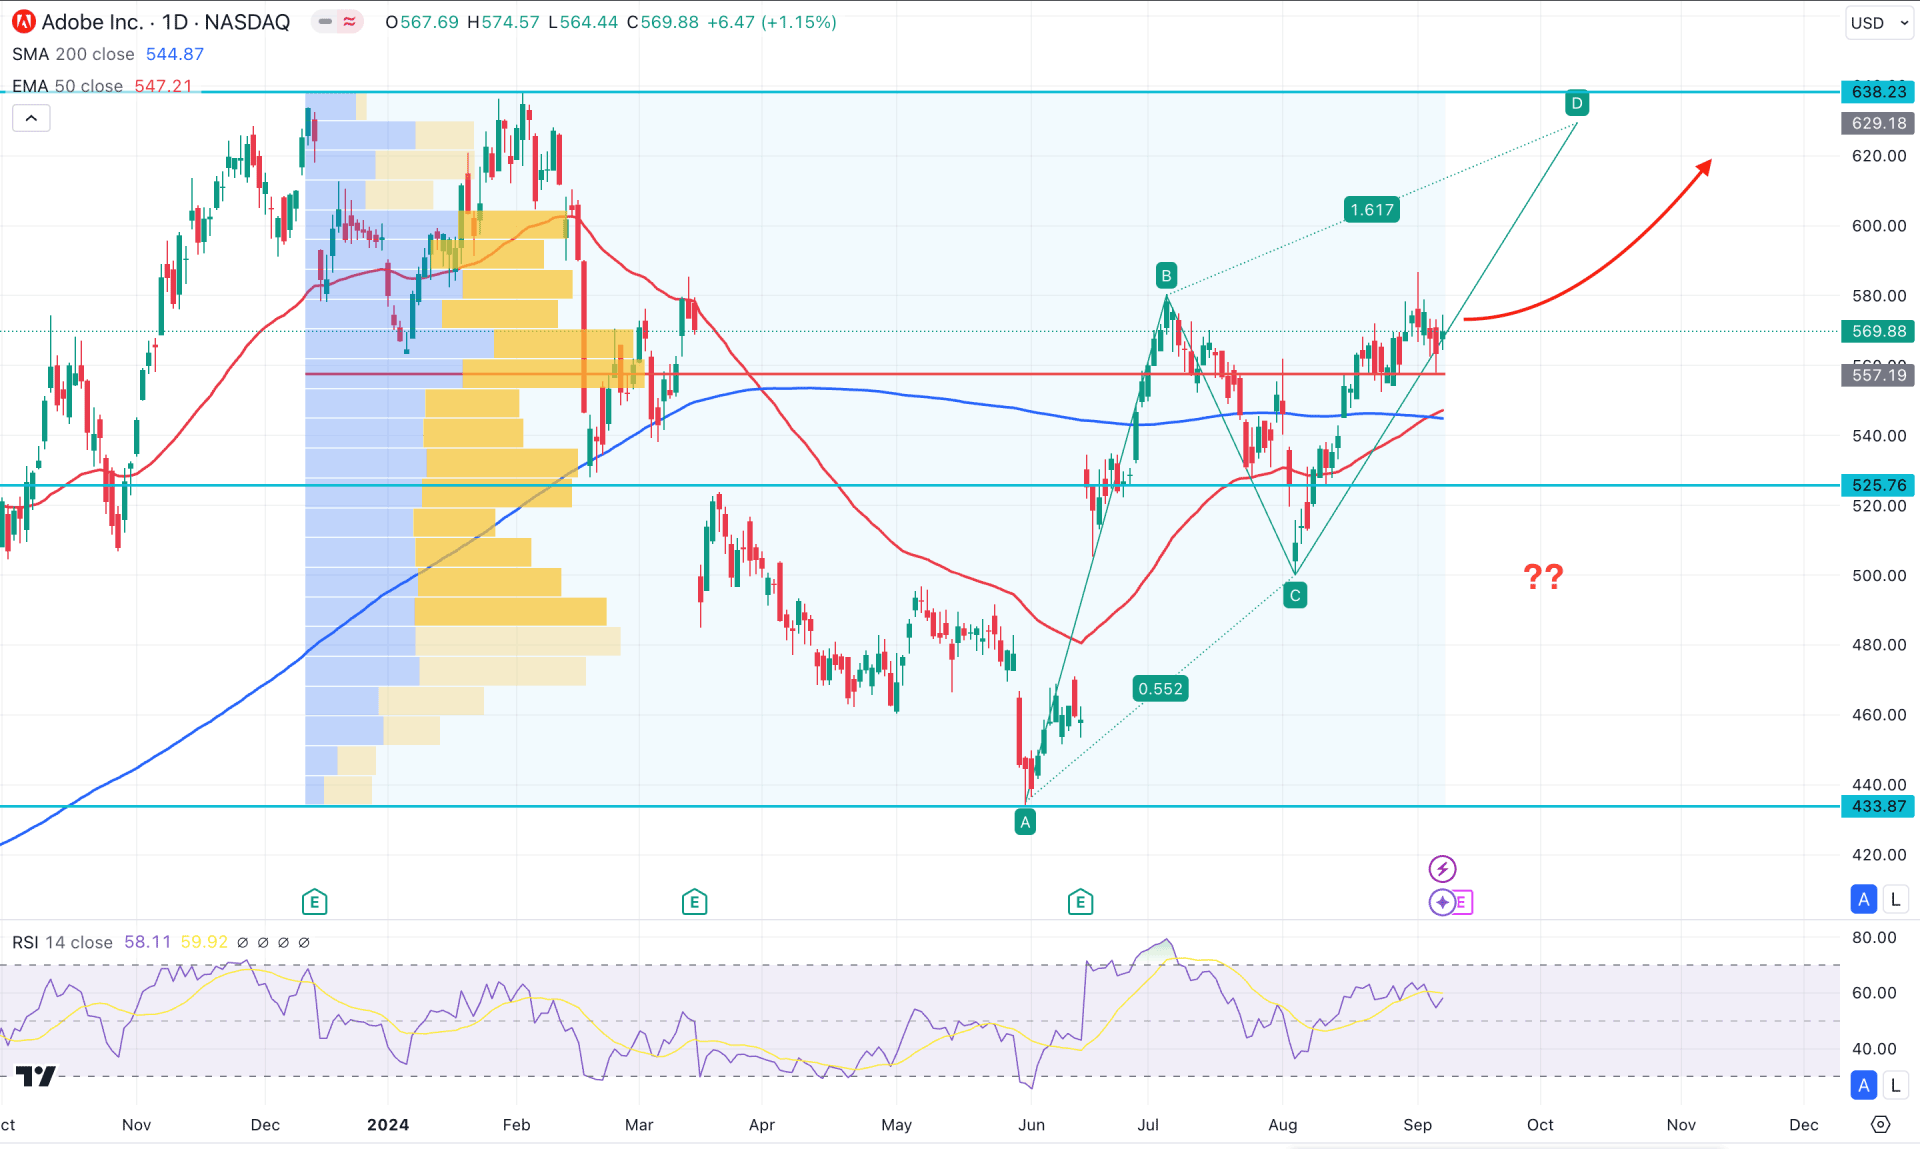
In the daily chart of Adobe (ADBE), a prolonged selling pressure is over as the price found a bottom at the 433.87 level. A bullish counter-impulsive wave is seen from the bottom, suggesting a possible continuation signal.
In the volume structure, the buying pressure is valid as the largest volume level is below the immediate swing low. The candlestick pattern in the higher time frame supports the volume, where the current price trades higher from the continuation of the bullish engulfing pattern formed in May.
In the daily price, the 200-day SMA and 50-day EMA showed confluence bullish signals by remaining below the current price. Moreover, the 50-day EMA crossed above the 200-day SMA, suggesting a long signal from the Golden Cross formation.
Meanwhile, the 14-day Relative Strength Index (RSI) rebounded and moved above the 50.00 level before moving sideways. However, the buying pressure remains active as long as the RSI remains steady above the neutral 50.00 area.
Based on the daily market outlook of ADBE, the recent downside pressure and a bottom formation at the 500.00 level increased the possibility of an upcoming bullish wave to complete the ABCD correction. In that case, an upbeat earnings report could boost the upward pressure and test the key resistance at the 629.18 Fibonacci Extension level.
The alternative trading approach is to look for a failure to breach the 600.00 psychological line and have a daily candle below the 50-day EMA. In that case, a downside correction might extend and test the 500.00 to 480.0 zone as a bottom.

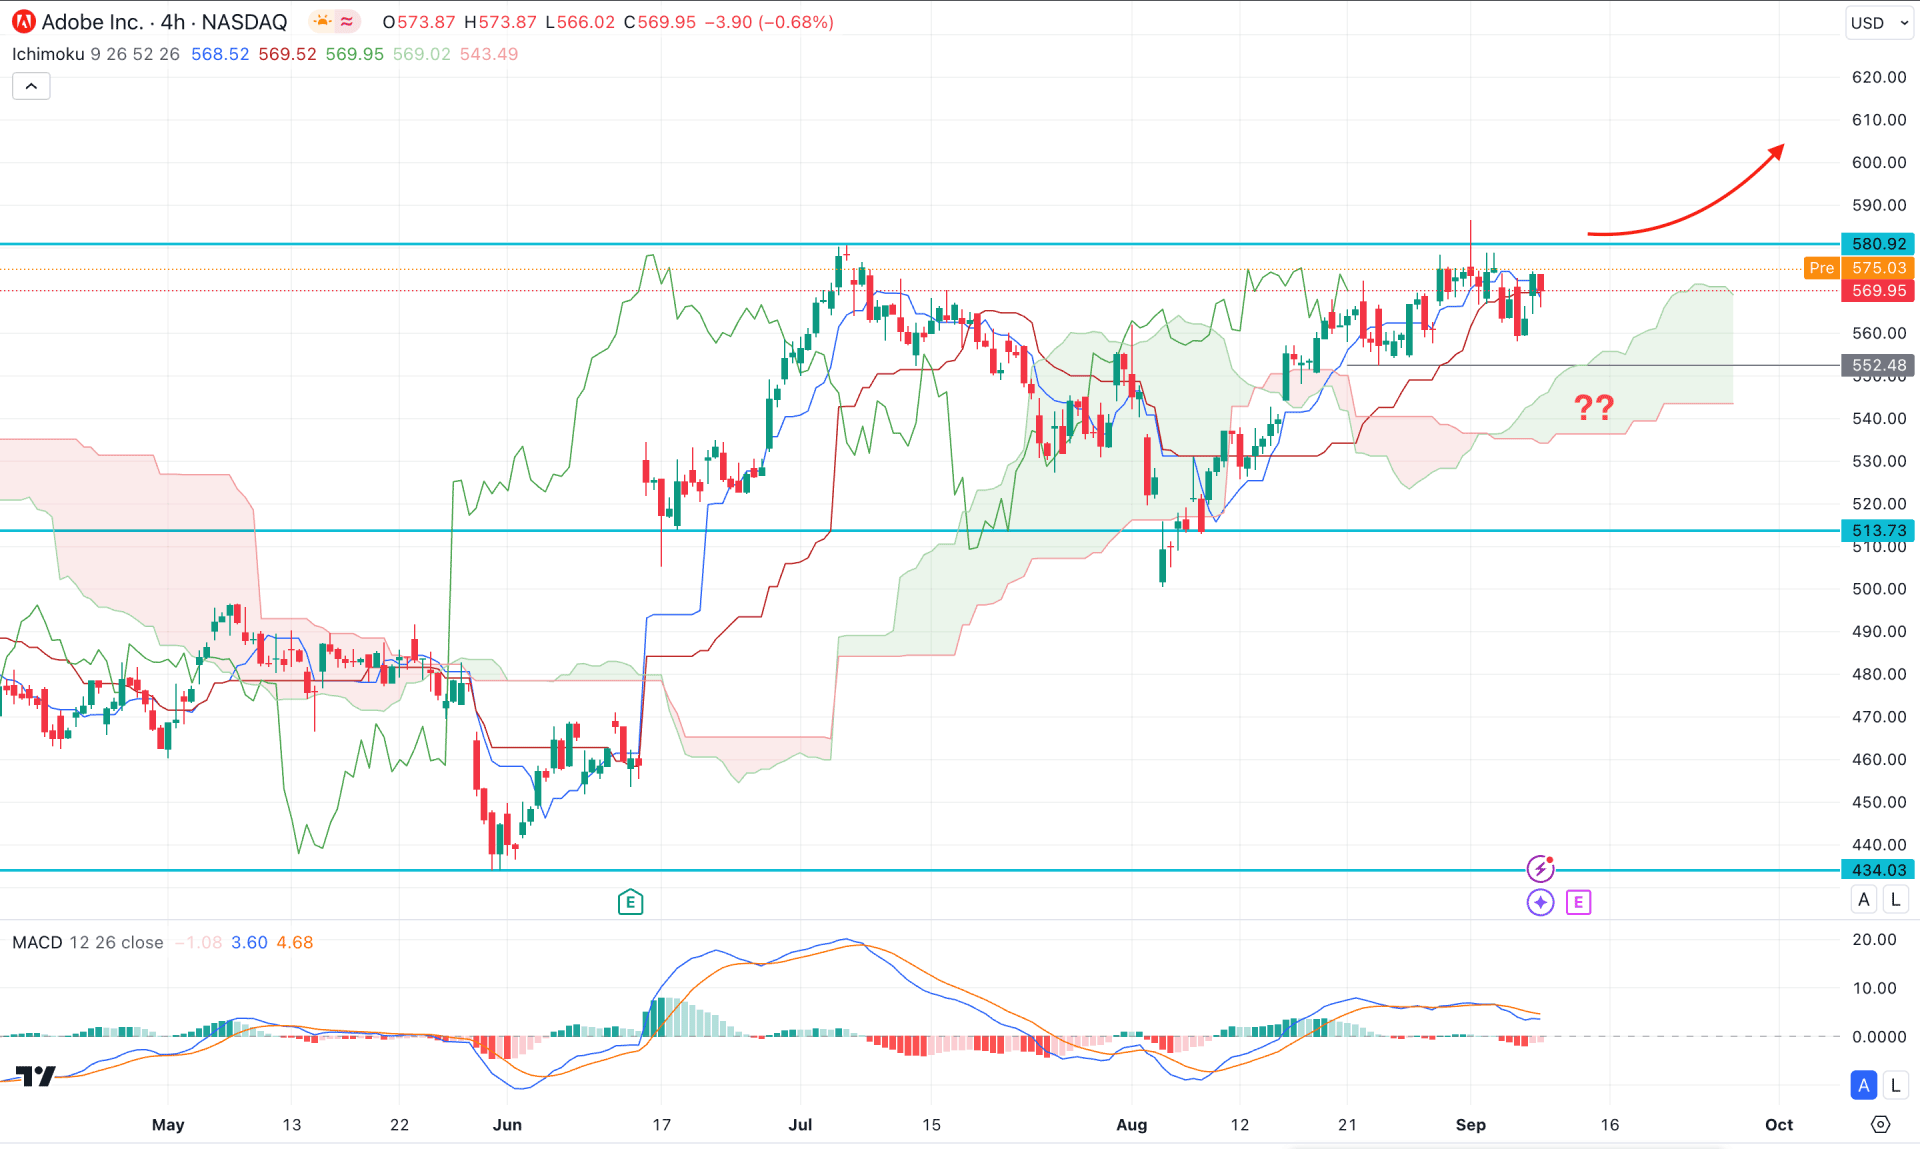
In the H4 timeframe, the recent price shows a corrective pressure above the cloud zone, suggesting a weaker buying pressure at the premium zone. Moreover, the Tenkan Sen and Kijun Sen have become flat, with no clear direction from the candlestick pattern. However, the long-term outlook is still bullish as the Senkou Span A remains steady above the Senkou Span B in the Futures Cloud.
In the indicator window a clear MACD Divergence is seen where the signal line fails to make a new swing high following the price. As the current Histogram is at the neutral position and downside pressure with a bearish reversal candlestick could create a decent bearish opportunity.
Based on the H4 outlook, a considerable downside pressure is present where the main aim would be to reach the cloud support before forming a long signal. However, any immediate bullish price action with a valid H4 close above the 580.92 level could trigger the long signal, ignoring the downside pressure.
On the bearish side, 552.00 to 520.00 would be a potential buy zone, and a failure to hold the price above this area could lower the price and test the 460.00 to 440.00 area.

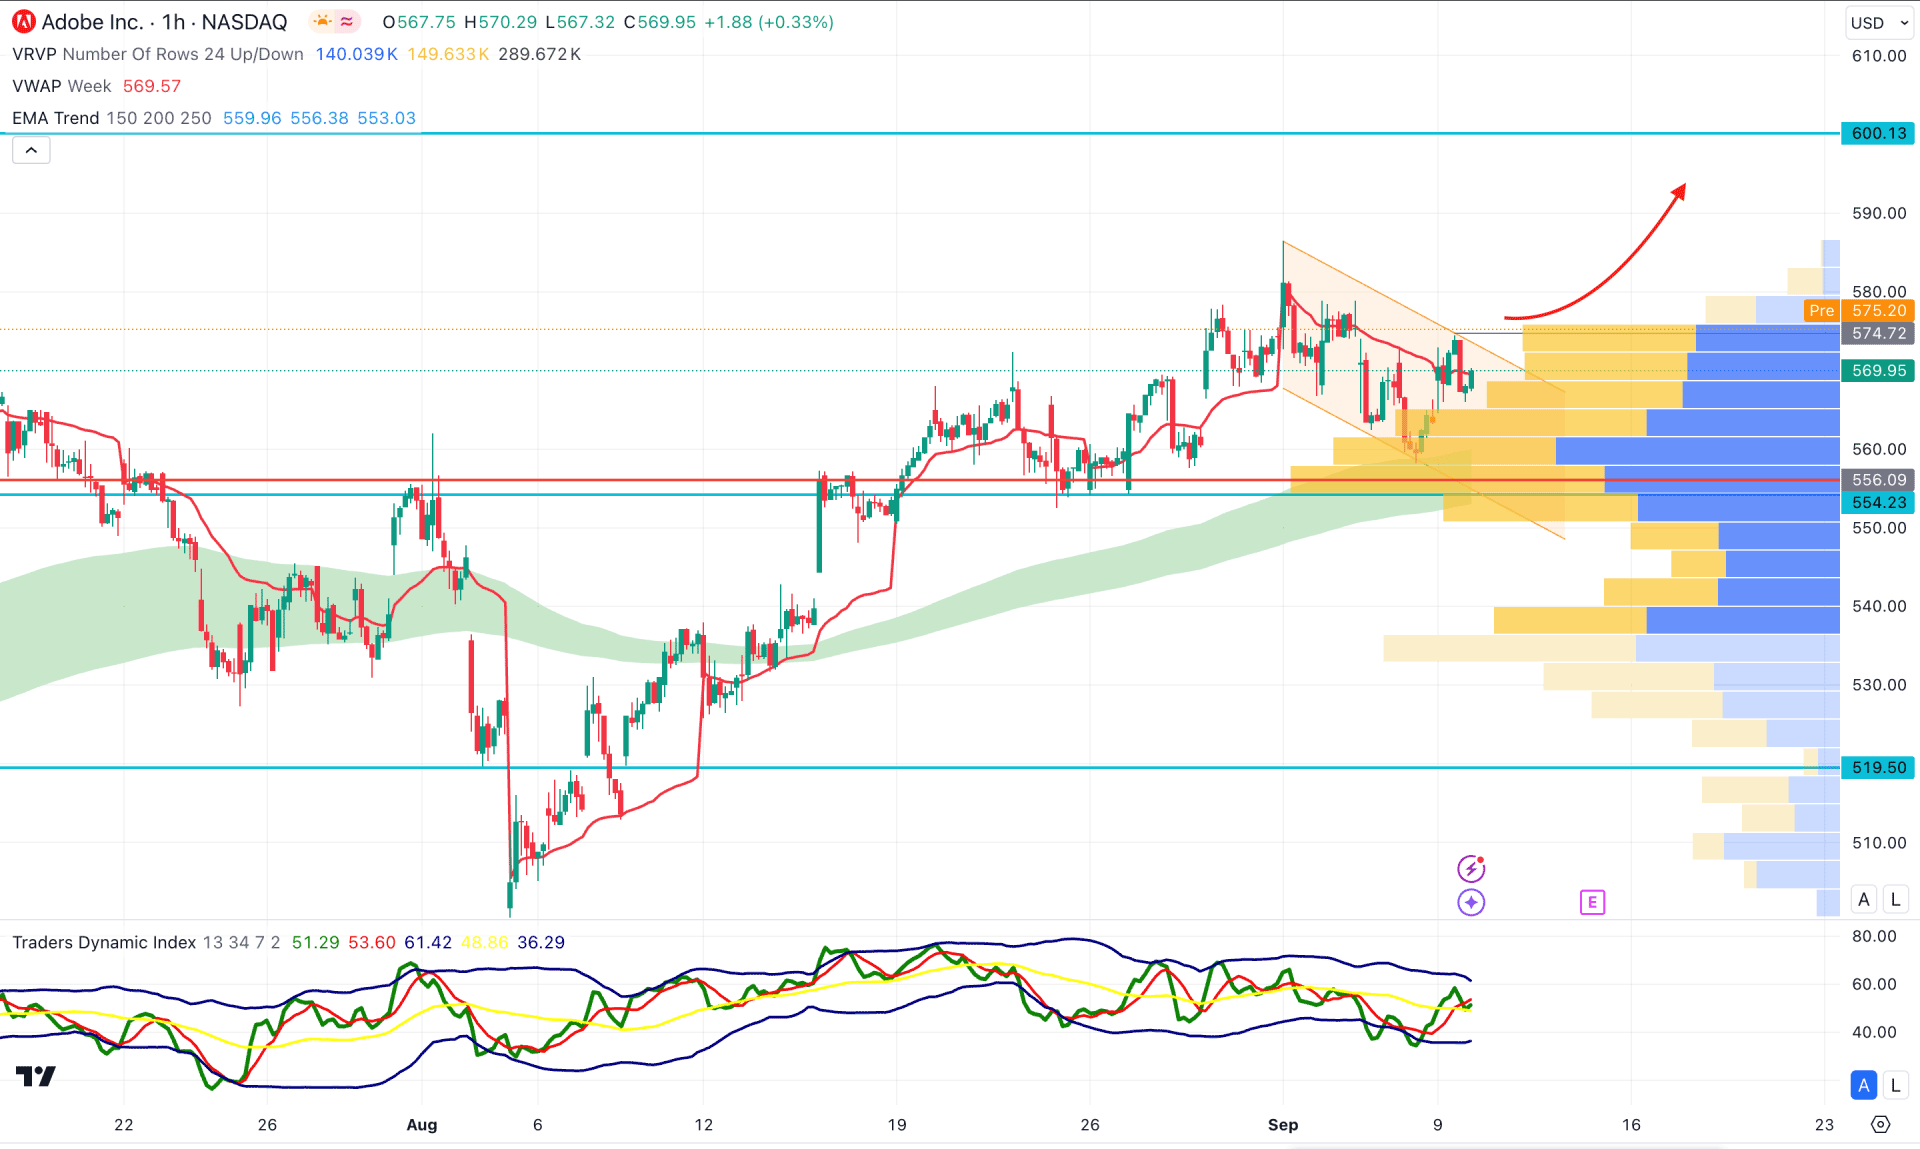
In the hourly time frame, the recent buying pressure is seen to be active as the visible range high volume line is below the current price. Moreover, a valid buying pressure above the weekly VWAP is visible, which is working as an immediate support.
The Moving Average wave consists of MA 150 to 250 remains below the current price with an upward slope, while the Traders Dynamic Index (TDI) reached the 50.00 level after forming a bottom.
Based on the hourly market structure, the first buying attempt might come with an immediate H1 candle above the 574.78 level. However, a downside correction might come within the descending channel before creating another long signal from the 570.00 to 540.00 zone.
A break below the 540.00 level with a daily close could lower the price and extend the selling pressure below the 519.50 support level.
Based on the current market outlook, ADBE is more likely to move higher and complete the pattern as per the daily structure. Investors should monitor the intraday price as a valid breakout is needed before joining the daily rally.