
Published: September 30th, 2025
Acuity Brands reported $1.18 billion in revenue last quarter, up 21.7% year over year and 3.1% over analysts' revenue projections. The company had an outstanding quarter, exceeding analysts' projections for both adjusted operating income and EBITDA by a significant margin.
Analysts predict that Acuity Brands' revenue will climb by 19% year over year to $1.23 billion this quarter, which is better than the 2.2% increase it saw in the same period last year. It is anticipated that adjusted earnings will be $4.84 per share.
Over the past 30 days, the company's analysts have largely reaffirmed their projections, indicating that they expect the business to continue on its current trajectory as it reports its results. Over the past two years, Acuity Brands has failed to meet Wall Street's revenue projections five times.
Let's see the further outlook of this stock from the AYI technical analysis:
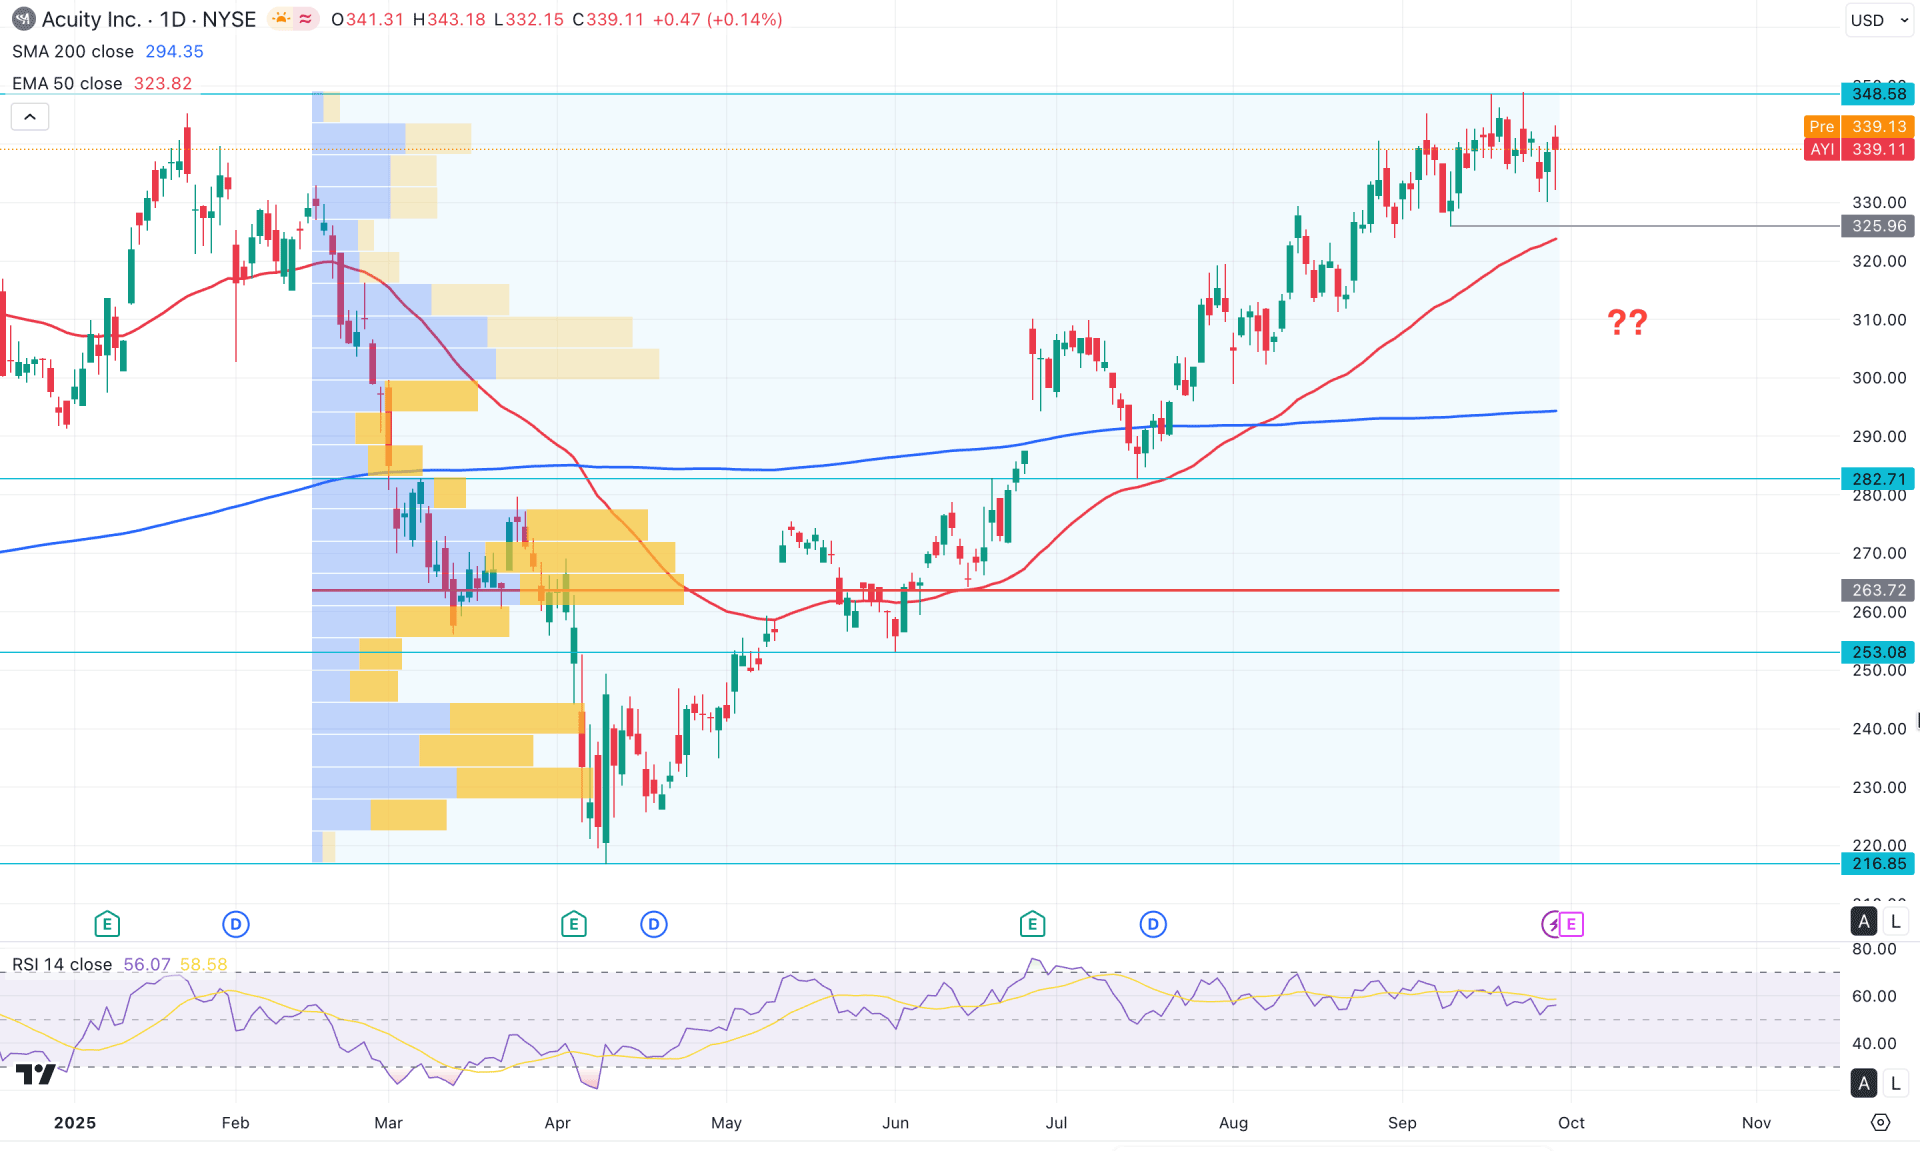
In the daily chart of AYI, the ongoing market momentum remains bullish, initiated from the bottom formed in April 2025. As the most recent price is trading higher and has surpassed the previous all-time high, investors should remain cautious before opening additional long positions.
Looking at the higher timeframe, the bullish continuation is solid, supported by a strong recovery over the past five consecutive months. However, the most recent price has reached a crucial resistance level, suggesting that a potential breakout is required before confirming any further long positions.
The weekly timeframe tells a slightly different story, where the recent candles have turned sideways over the past four weeks, forming multiple gravestone doji patterns that indicate weakened bullish momentum at the top.
In the daily chart, a bullish crossover between the 50-day EMA and 200-day SMA signals a potential Golden Cross continuation, with immediate support located around the 325.59 to 367.00 zone. As the 50-day EMA continues to hover just below this area, we may expect a possible upward continuation soon.
In terms of volume, the highest activity level since February 2025 is observed near the 263.70 area, which is significantly below the current price. This suggests a strong buyer presence, as no notable high-volume clusters are seen in the premium zone to confirm a counter-momentum. Although the overall structure favours the buyers, a healthy bearish correction is still pending as a mean reversion.
In the secondary indicator window, the Relative Strength Index (RSI) has turned sideways, hovering just below the 50.00 neutral line. Moreover, the RSI shows a strong bearish divergence against the main price chart, as it failed to confirm the recent higher high formations. While this divergence signals a possible bearish reversal, further confirmation from candlestick patterns is needed before opening a short position.
Based on the overall market structure, the major momentum remains bullish in the daily timeframe. A minor correction followed by a bullish reversal near the 50-day EMA could present a potential long opportunity, with the ultimate target set beyond the 348.58 level.
On the other hand, if the market extends its consolidation and forms bearish pressure below the 320.00 level, a short opportunity could emerge targeting the 200-day SMA area. Below the 300.00 psychological level, the next support zone is located around 253.08.
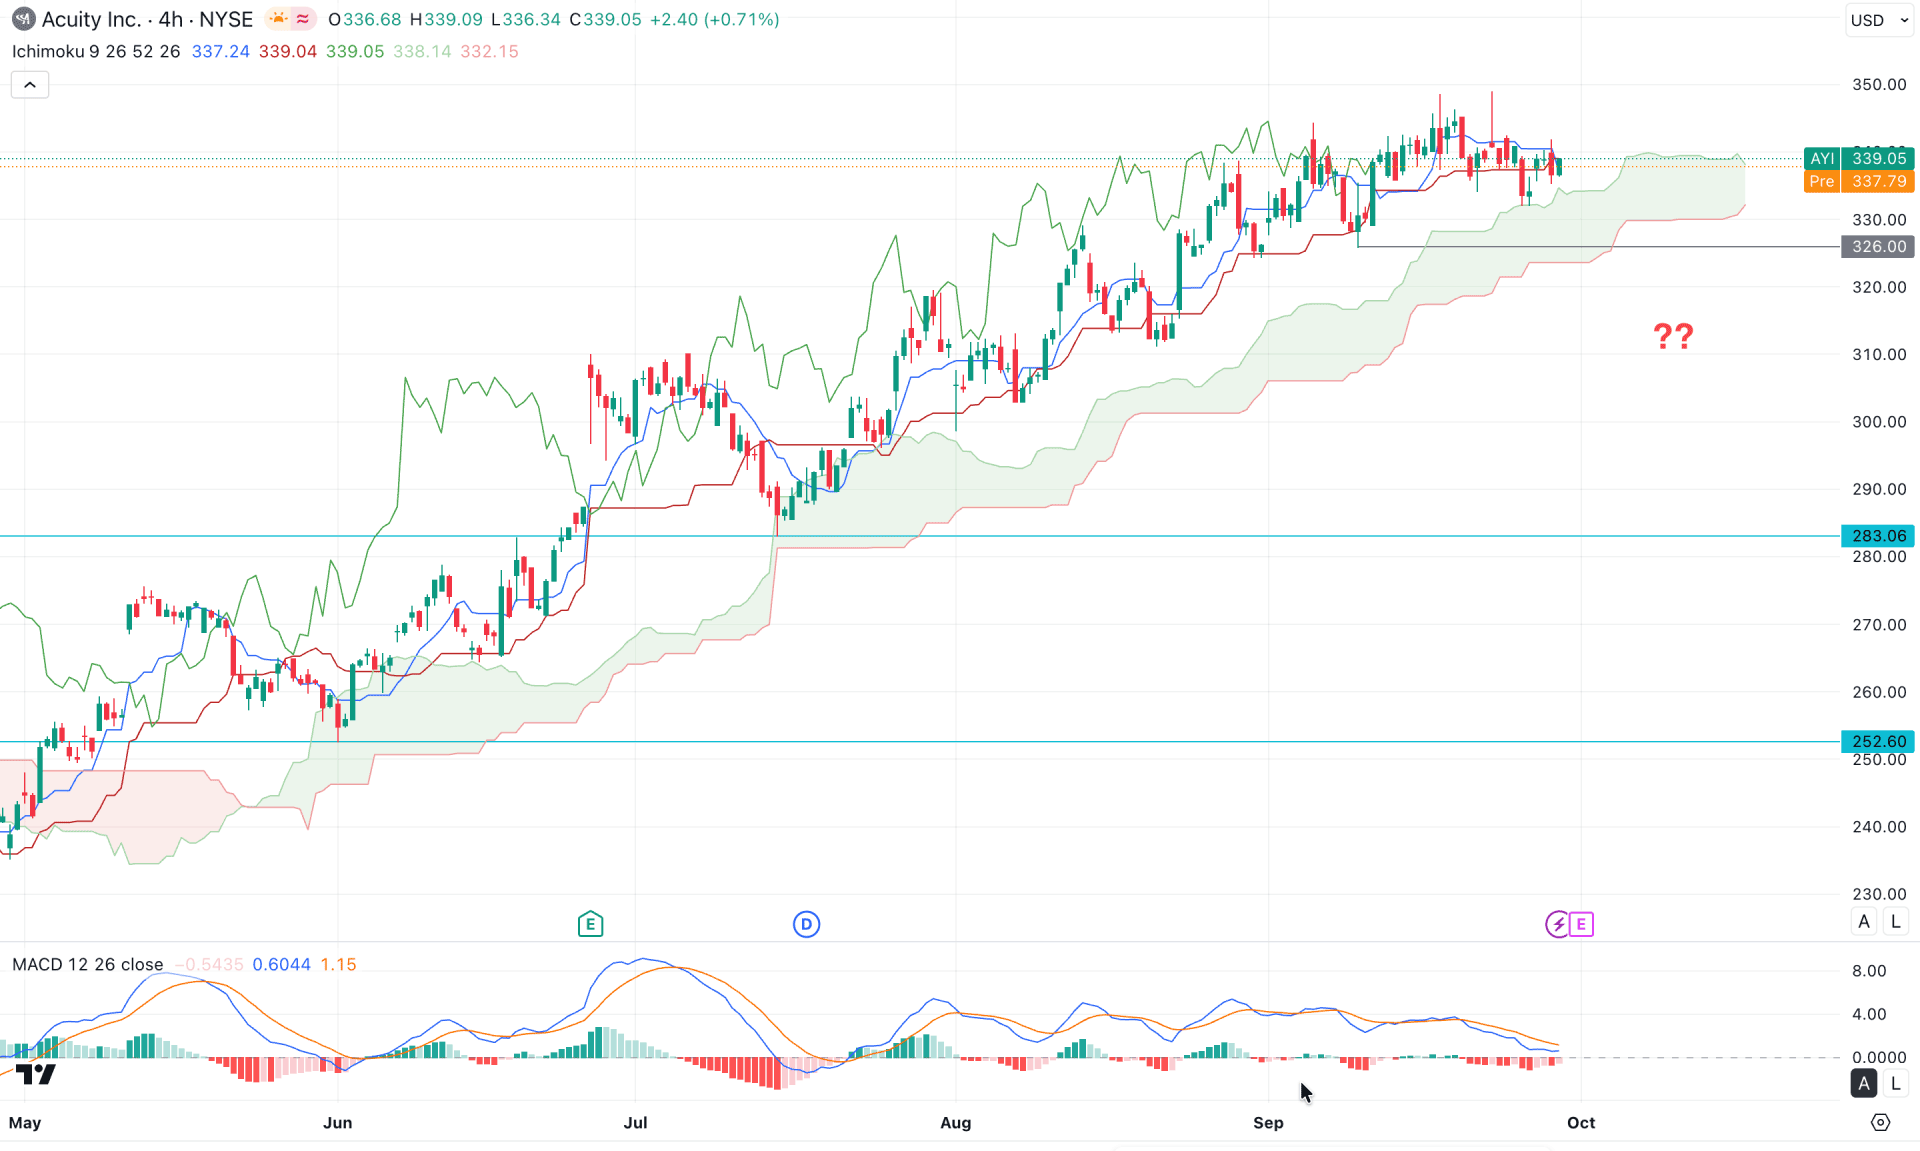
In the four-hour timeframe, the most recent price is trading sideways above the Kumo Cloud area, where the future cloud looks positively biased toward the bulls. Both Senkou Span lines are aiming higher, while the Senkou Span A remains above the Senkou Span B with a bullish slope.
On the other hand, the MACD signal line tells a different story, which has squeezed toward the neutral area after reaching the upper peak zone. However, the MACD histogram has started to lose bullish momentum, indicating that a bullish reversal from the current zone is still possible.
Based on the overall market structure, a bullish continuation may occur soon if the price manages to break above the key swing level. In that case, a bullish four-hour candle closing above the 345.00 level could offer a potential long opportunity, targeting the 360.00 to 380.00 zones.
On the other hand, the sideways movement within the cloud area suggests a possible bearish correction, although a proper confirmation is still needed. A bearish four-hour candle closing below the 326.00 level, followed by consolidation, could increase the likelihood of a bearish extension, with the ultimate target at the 283.06 support level, and possibly extending toward the 250.00 area.
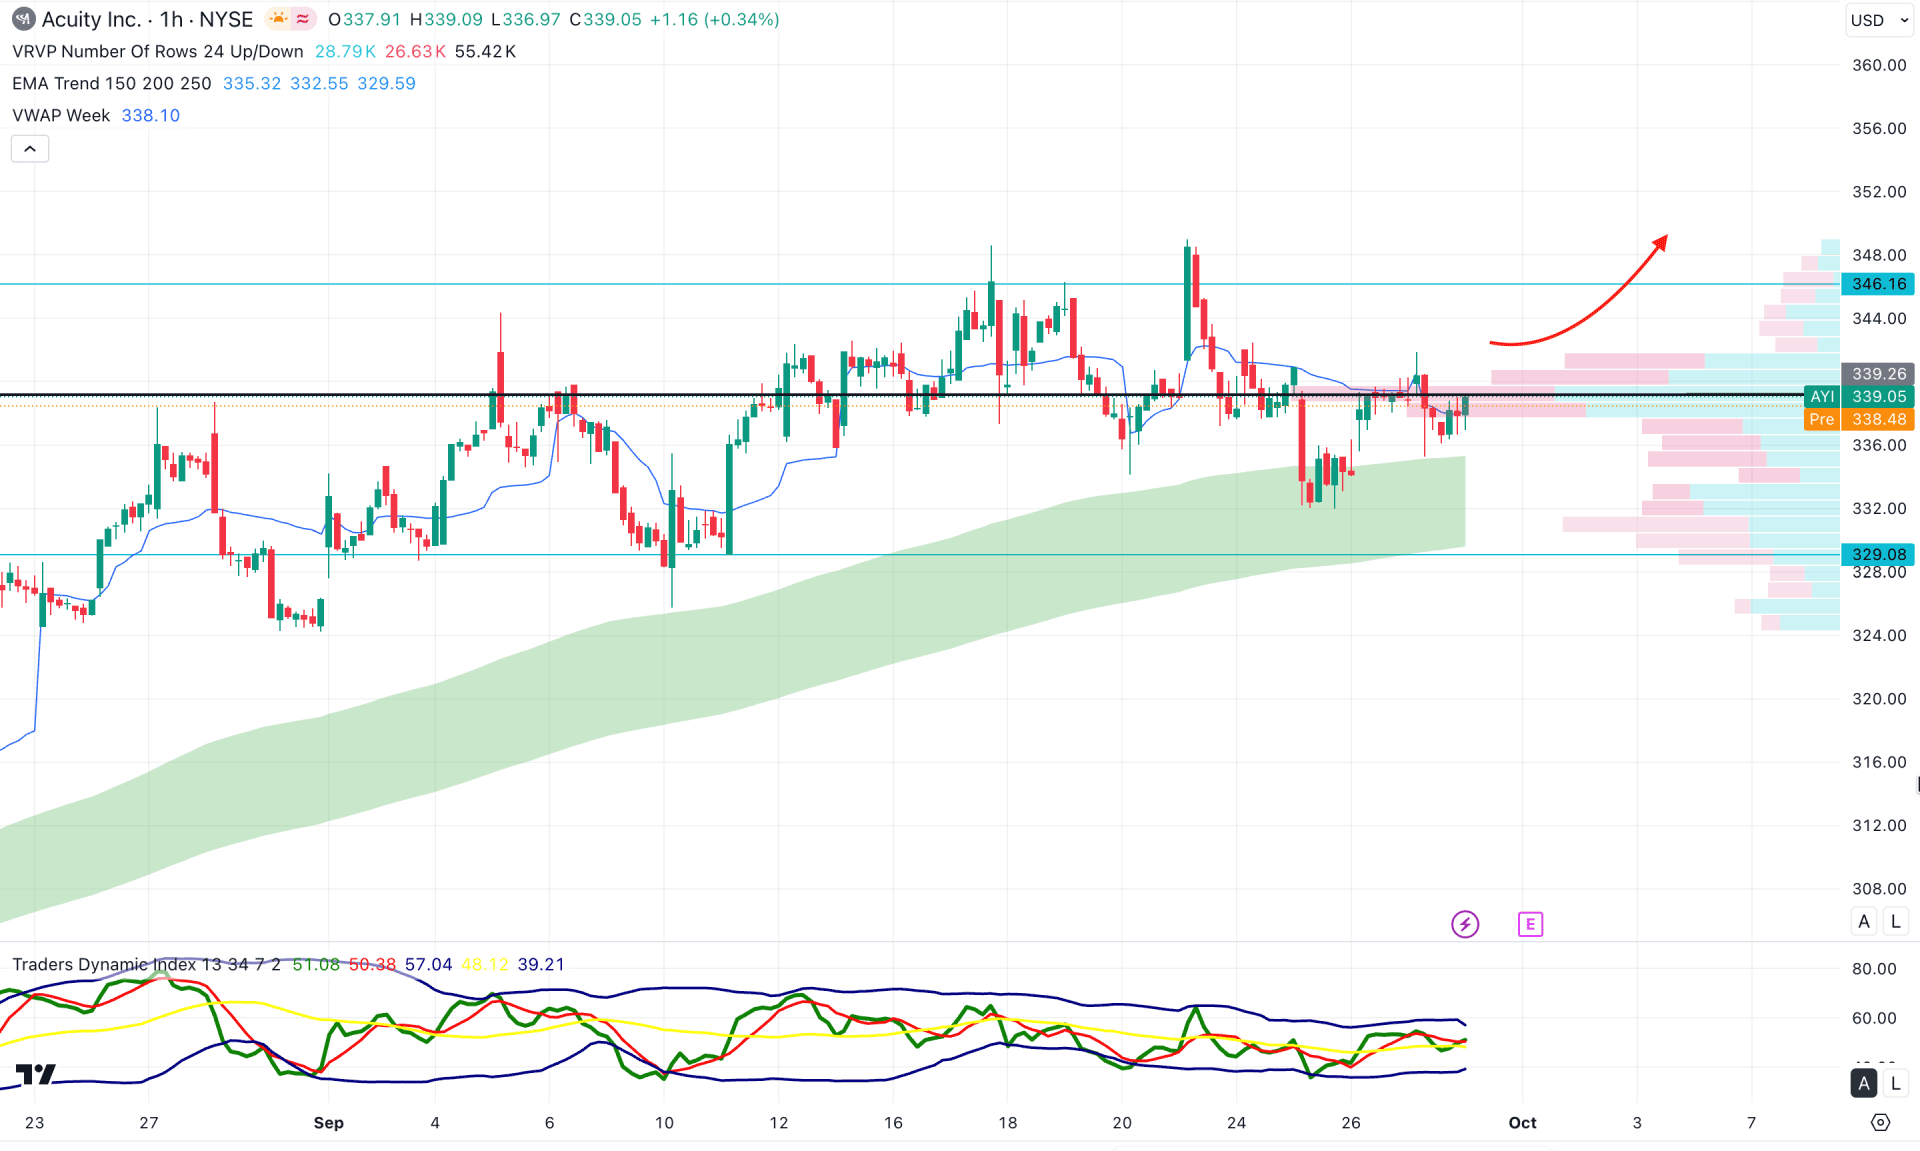
In the hourly timeframe, the recent price is being supported by the exponential moving averages, which are acting as a strong barrier against sellers. Moreover, the intraday high line is close to the current price, indicating increased volatility in the market.
In the secondary indicator window, the Traders Dynamic Index (TDI) remains sideways, with the most recent line moving below the 50.00 neutral level. The weekly VWAP is positioned below the current price, acting as the nearest dynamic support.
Based on the broader market structure, a bullish breakout and stable price action above the 341.75 swing high could offer a high-probability long opportunity, targeting the 350.00 level.
An alternative trading approach would be to wait for a deeper correction toward the 332.00 level before considering another long entry, ideally after a positive hourly candle close above the weekly VWAP.
However, an extended bearish move with a break below the 329.08 level could invalidate the bullish outlook and potentially push the price lower toward the 312.00 area.
Based on the broader market structure and the extended bullish rally, a short-term correction still appears pending. Therefore, investors should closely monitor the lower timeframes to identify entries near discounted areas. However, the major market trend remains bullish, and a positive earnings report could trigger a strong bullish breakout at any time.


