
Published: June 18th, 2025
Prior to the market opening on June 20, Accenture plc (NYSE: ACN) is expected to report its earnings for the third quarter of the financial year 2025. Over the last four quarters, the company has had a mixed profit record, exceeding forecasts in two and missing them in the other two. Accenture's earnings surprises have been positive by 1.5% on average.
Accenture is expected to generate $17.2 billion in total revenue for the third quarter, a 4.5% rise over the similar period last year. Within its primary business segments, consulting revenue is anticipated to reach $8.7 billion, a 2.4% increase over the previous year, while service management revenue is projected to reach $8.5 billion, a 6.1% increase.
Revenues are anticipated to increase steadily across all of the company's operating sectors. Projected revenue for the Products category is $5.2 billion, a 4.5% increase over the same period last year.
Revenue from the Health & Public Services sector is expected to expand by 5.7% to $3.7 billion, while revenue from the Financial Services segment is expected to climb by 5.3% to $3 billion. The Communications, Media & Technology segment is projected to generate $2.8 billion in revenue, a 2.6% increase. The Resources section is anticipated to provide $2.4 billion, representing a 1.8% rise from the previous year.
Accenture is anticipated to report third-quarter earnings of $3.29 in terms of profitability, indicating a 5.1% increase over the previous year. As investors search for indications of sustained strength across Accenture's many business areas and international markets, the following results will be eagerly monitored.
Let's see the upcoming price direction from the ACN multi-timeframe analysis:
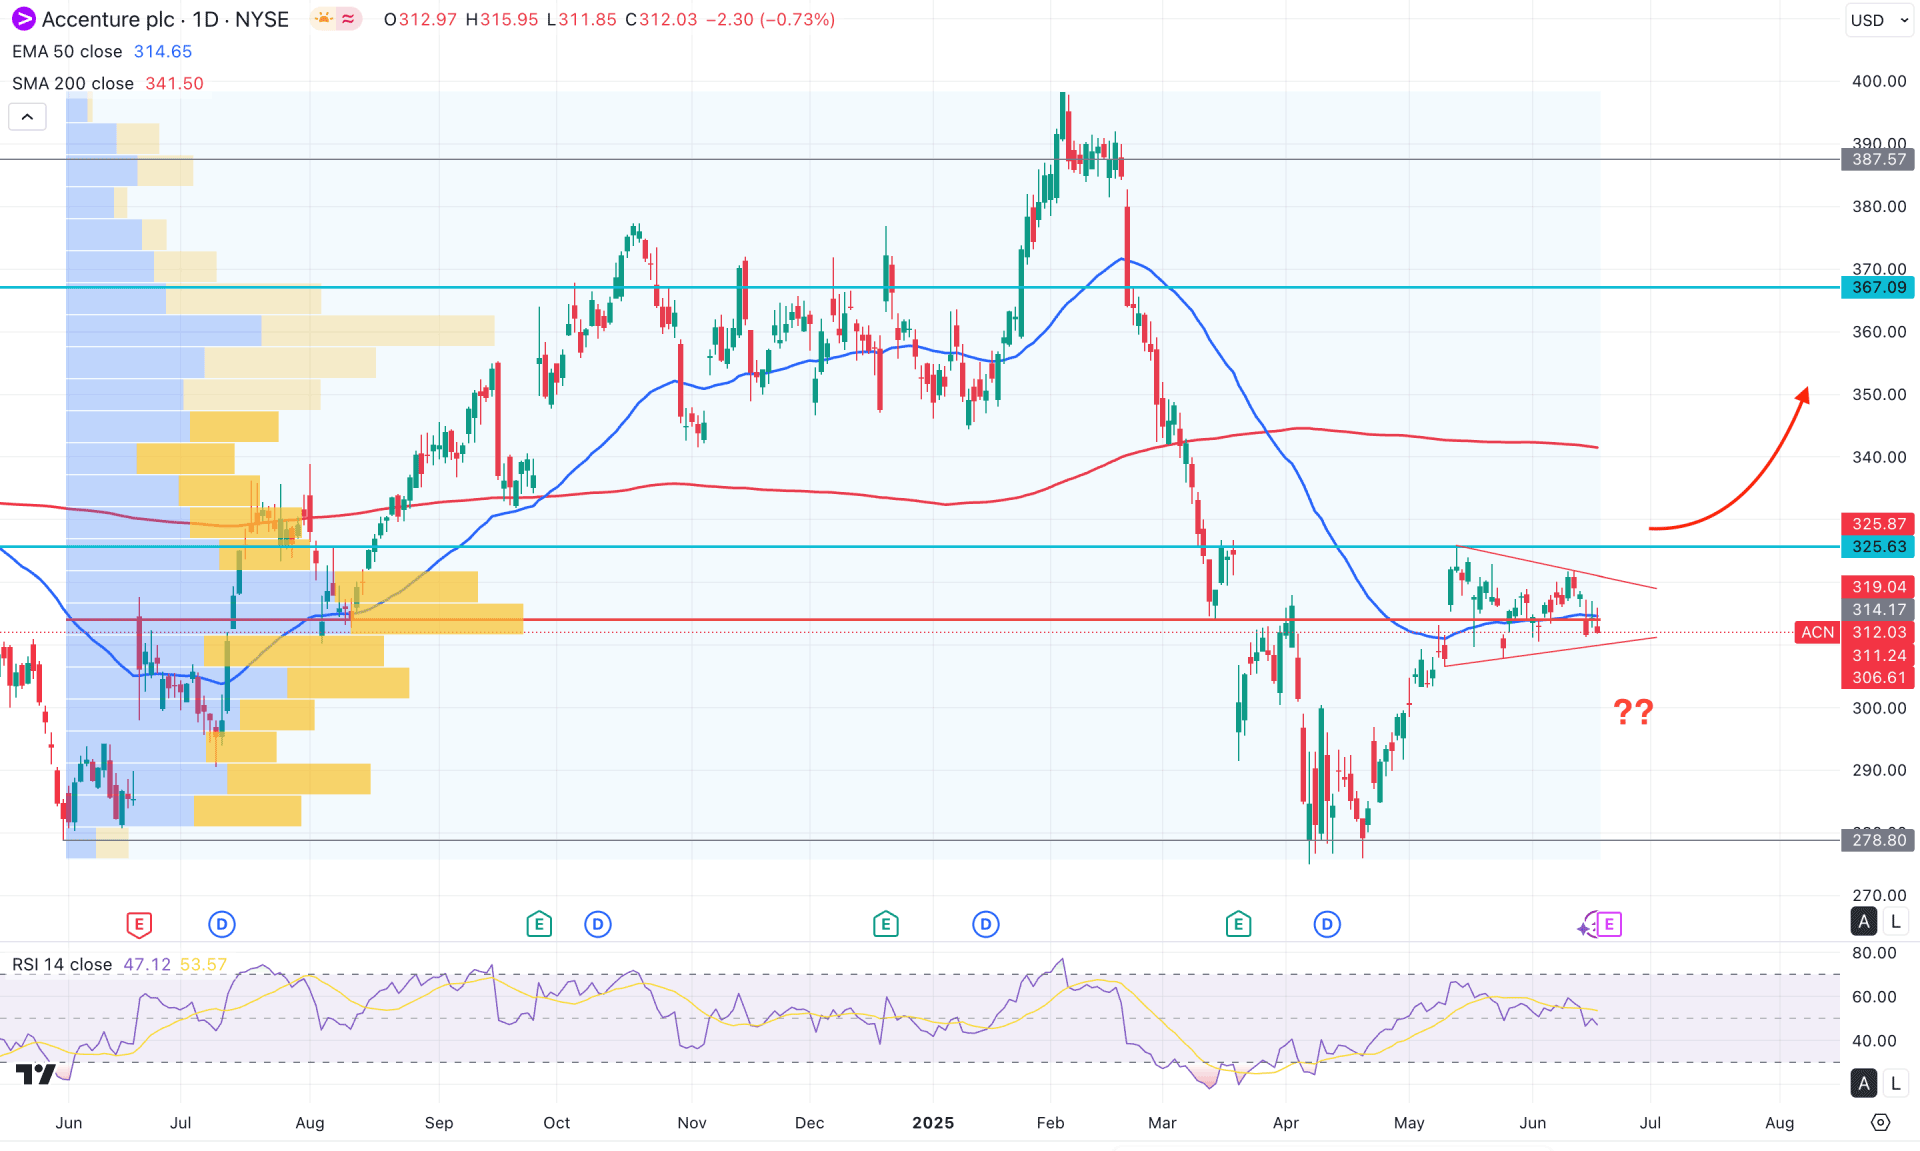
In the daily chart of ACN, the overall market momentum is sideways, with the recent price action showing some buying pressure from the yearly low. Investors should closely monitor how the price reacts within this consolidation phase, as a strong fundamental catalyst could provide bullish momentum.
In the higher timeframe, a strong bullish reversal is visible from the May 2024 low, followed by an upward recovery that surpassed the April 2025 high. This is primarily a sign of a long-term bullish signal, although confirmation from the lower time frames is still necessary.
On the weekly chart, the price has remained sideways for six consecutive weeks, indicating a potential trend formation that could follow a valid breakout.
Looking at the volume structure, the price is currently trading near a critical zone, as the most active level observed last year lies just below the current price. With the price consolidating in this area, investors might anticipate a range breakout supported by high volume, likely to define the next trend direction.
On the main price chart, the price is aligned with the 50-day Exponential Moving Average, signalling a medium-term sideways bias. The 200-day Simple Moving Average is still above the current price, but the wider gap between the price and this dynamic line suggests a potential upward correction.
The Relative Strength Index (RSI) reflects a similar sentiment, with the current RSI line hovering near the 50.00 neutral mark. Given this momentum, a downside break could offer a high-probability short opportunity, particularly since the RSI has already retraced from the 70.00 overbought zone.
Based on this outlook, the primary focus should be on identifying a potential short opportunity, particularly if the price forms a daily candle below the 306.61 level, with a downside target at 278.80.
Conversely, the price has already rebounded from the June 2024 low, indicating strong sell-side liquidity absorption. Moreover, before entering the current sideways phase, it formed a higher swing low above the 318.31 level. In this case, a bullish breakout with a stable price above the 325.63 level could offer a potential long opportunity, though resistance may be encountered near the 200-day Simple Moving Average.
Another bullish scenario could emerge if the price completes a sell-side liquidity sweep below the symmetrical triangle and recovers above the 50-day Exponential Moving Average. In both cases, the 340.00 level will be the primary upside target before aiming for the 387.57 high.
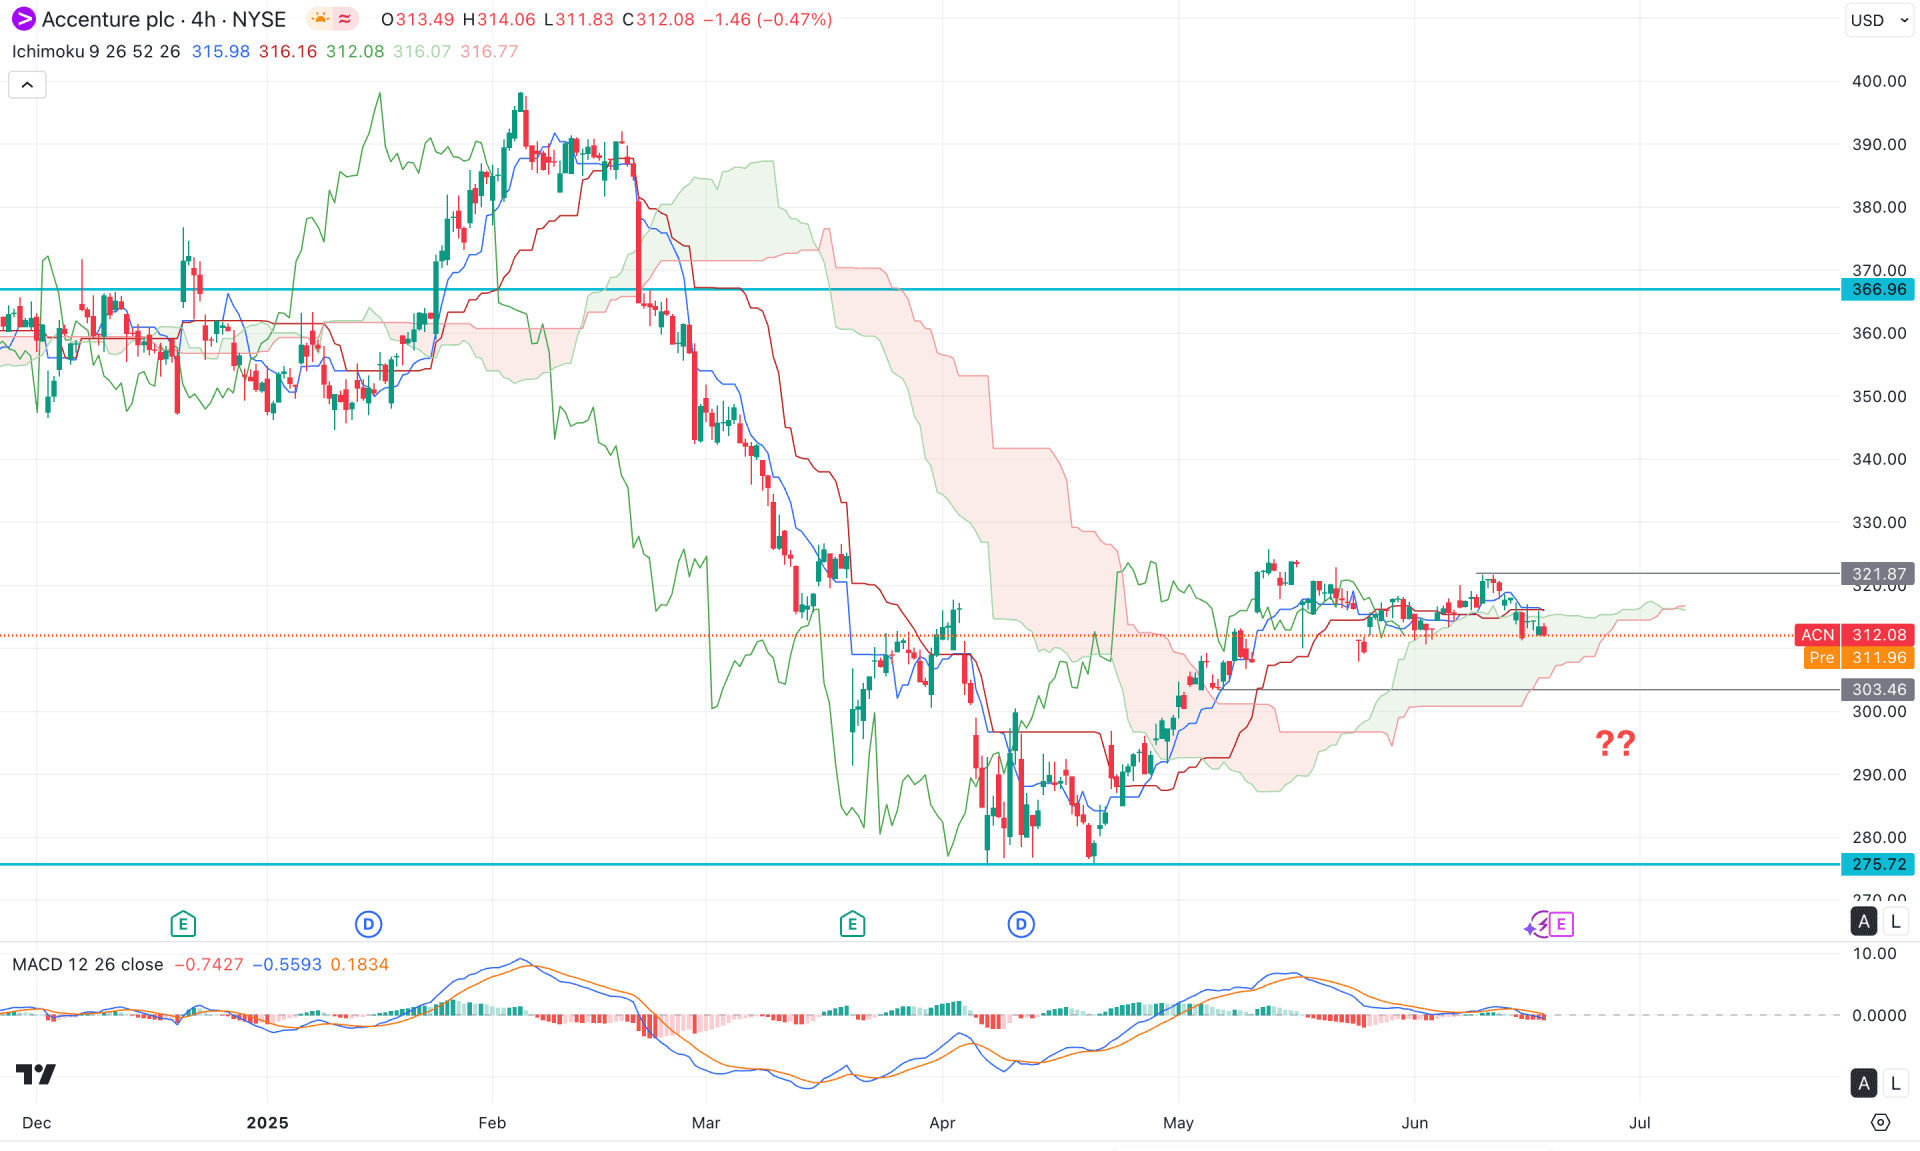
In the H4 timeframe, the recent price shifted the market trend above the Ichimoku Cloud for a considerable time. However, the most recent price action above the Cloud support is sideways, from where more clues are needed before anticipating a bull run.
In the Futures Cloud, the Senkou Span A and Senkou Span B are closer together, signalling an indecision. More congestion comes from the secondary indicator window, where the MACD Histogram is in a bearish zone.
Based on this outlook, the ongoing buying pressure is limited as the recent price has reached the Ichimoku Cloud zone. Investors should monitor how the price holds the momentum at the Cloud zone, as a bearish break below the 300.00 psychological level could be a bearish opportunity.
The alternative trading approach is to look for a bullish continuation after having a new swing high above the 321.87 level. A consolidation above this line could validate the long opportunity, aiming for the 366.96 resistance level.
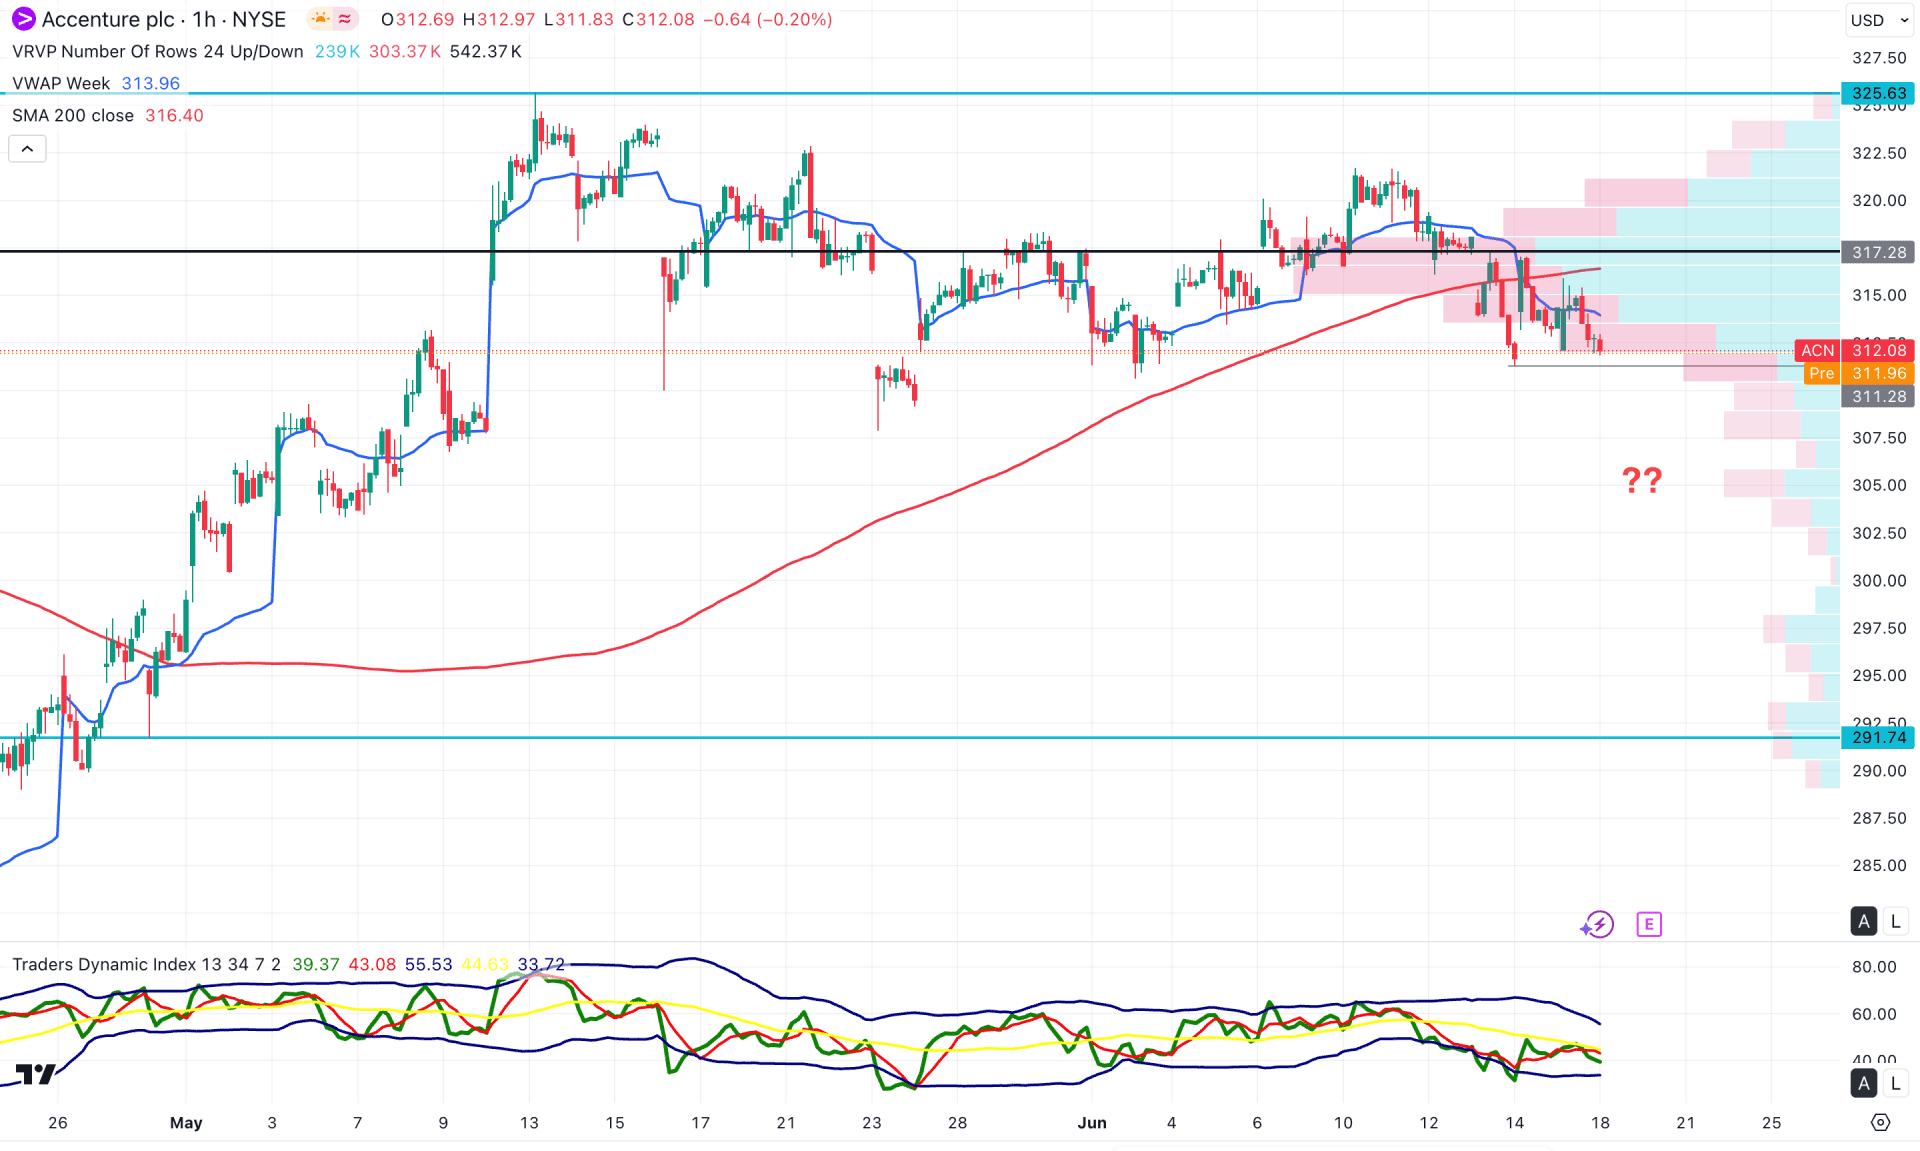
The current price trades under selling pressure in the hourly time frame, as the intraday market structure indicates a potential top formation. Investors should monitor how the price behaves below the high-volume line, as a short-term bearish opportunity could emerge.
In the secondary indicator window, the Traders Dynamic Index (TDI) is heading lower, with the most recent line positioned below the 50.00 neutral point, suggesting bearish momentum.
Based on this outlook, a bearish hourly candle closing below the 311.28 level could increase the probability of a move toward the 291.74 support level.
On the other hand, a bullish rebound above the VWAP is required before anticipating an extended position. In that scenario, a bullish breakout from the trendline resistance, with the price stabilizing above the 320.00 level, might extend the bullish momentum toward the 328.00 area.
Based on the current market outlook, Accenture stock has rebounded from a crucial yearly low, indicating a possible bottom formation on the higher timeframe. While the price currently appears bearish, a bullish rebound from any significant support level could present an early long opportunity, mainly if supported by the broader bullish structure.
The upcoming earnings report could play a critical role. A better-than-expected result and a bullish breakout from the current symmetrical triangle formation could signal a long-term investment opportunity in this stock.


