

Published: September 29th, 2026
Over the last three months, Accenture ACN's stock has increased 37.6%, greatly above the industry's 15.9% growth.
As workplace AI use moves from pilot programs to scaled production, Accenture is reaping the benefits. While the average project size increased, 100 more clients started advanced AI projects in the third quarter of fiscal 2026.
Notably, at least one of the two advanced AI initiatives generates associated data work, increasing demand for cloud, data, and digital-core modernisation. The scale of long-term transformation programs is increasing, and client relationships are strengthening amid this broader AI-led demand.
Accenture introduced several enterprises to pursue new growth opportunities in September 2026. Accenture Construct focuses on significant capital and infrastructure projects related to energy transition, infrastructure replacement, and AI data centers.
Accenture continues to demonstrate strong profitability and robust cash flow generation. In the third quarter of fiscal 2026, operating cash flow reached $3.79 billion, up from $3.68 billion in the same period last year. Free cash flow was $3.60 billion after $186 million in capital expenditures.
The company distributed $2.2 billion to shareholders during the quarter, comprising $1.2 billion in share buybacks and $1 billion in dividends. Its quarterly dividend also increased by 10% year over year to $1.63 per share.
Let's see the full price projection from the ACN technical analysis:
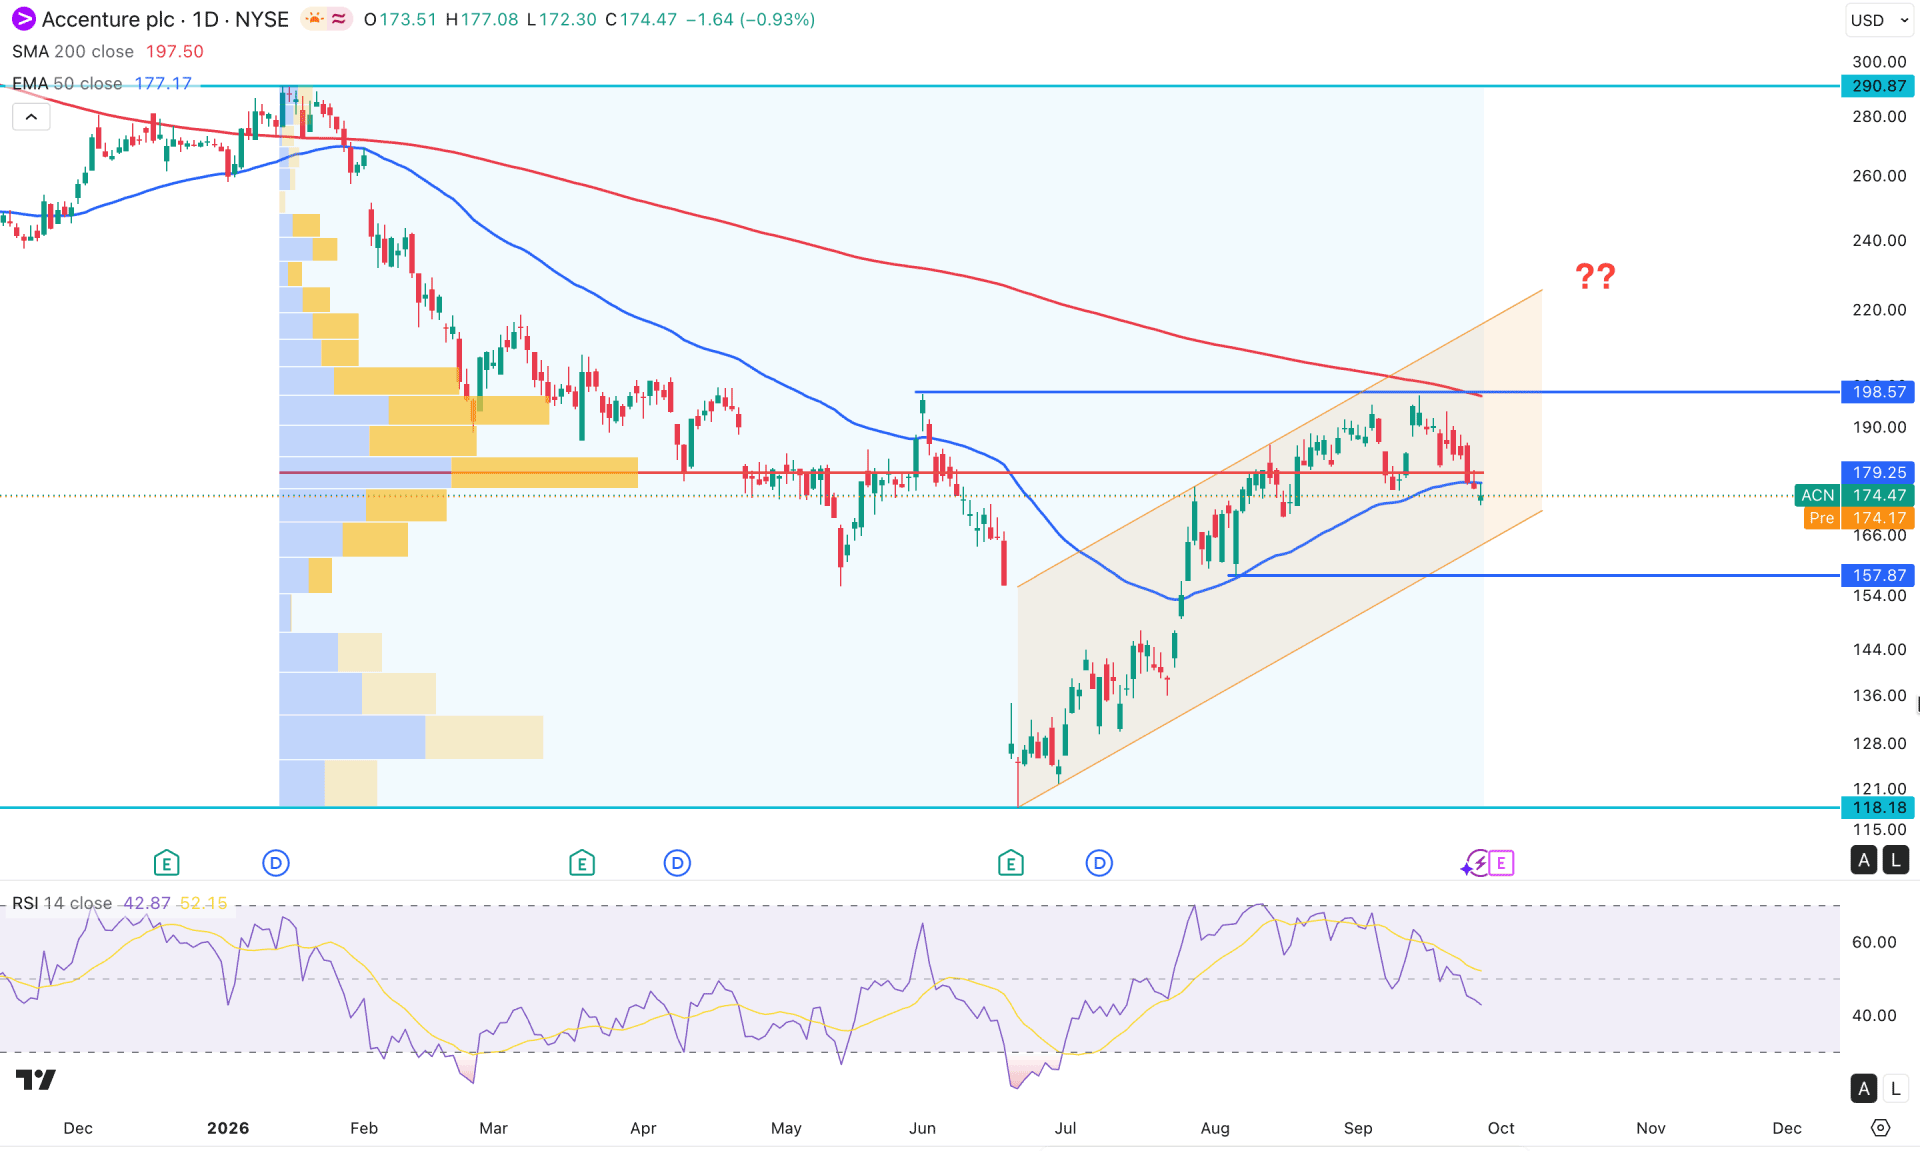
On the daily chart of Accenture (ACN) market momentum is sideways after a bullish rebound. However, recent price action failed to overcome the crucial resistance at 198.57 and turned sideways. It signals a lack of buying pressure from where a decent downside correction is possible.
Looking at the higher timeframe, the monthly chart suggests an immediate bullish rebound, with two consecutive bullish candles since June 2021. However, price has failed to create a new swing high, and current action remains sideways near the resistance area. The weekly chart shows a similar structure, where a bullish V-shaped recovery is present with no sign of a new swing high forming.
On volume, price is trading within a consolidation zone, as the largest activity level since January 2026 is at 179.25, just above the current price. Primarily, consolidation signals a possible upper-boundary violation, from which a breakout could offer a promising trend-trading opportunity.
On the main price chart, the 50-day EMA is just above the current price, acting as immediate resistance alongside the high-volume resistance level. Moreover, the 200-day simple moving average is acting as major resistance, in line with the 198.57 resistance level.
The indicator window shows a divergence formation, with the relative strength index recovering below the neutral 50.00 level.
Based on the overall market structure, the recent recovery below the 50-day EMA signals a lack of buying pressure. It creates an opportunity to test the key support at 157.87. Moreover, a break below this level with a daily close could validate the ascending-channel breakout, creating the possibility of testing the 118.18 bottom.
On the bullish side, the immediate double-top resistance to watch is 198.57, a crucial level. A bullish close above this level could increase buying pressure and open the way for a test of the 290.87 resistance level. Moreover, a minor pullback followed by a recovery from the ascending-channel support could create another long opportunity as a bullish pre-breakout structure.
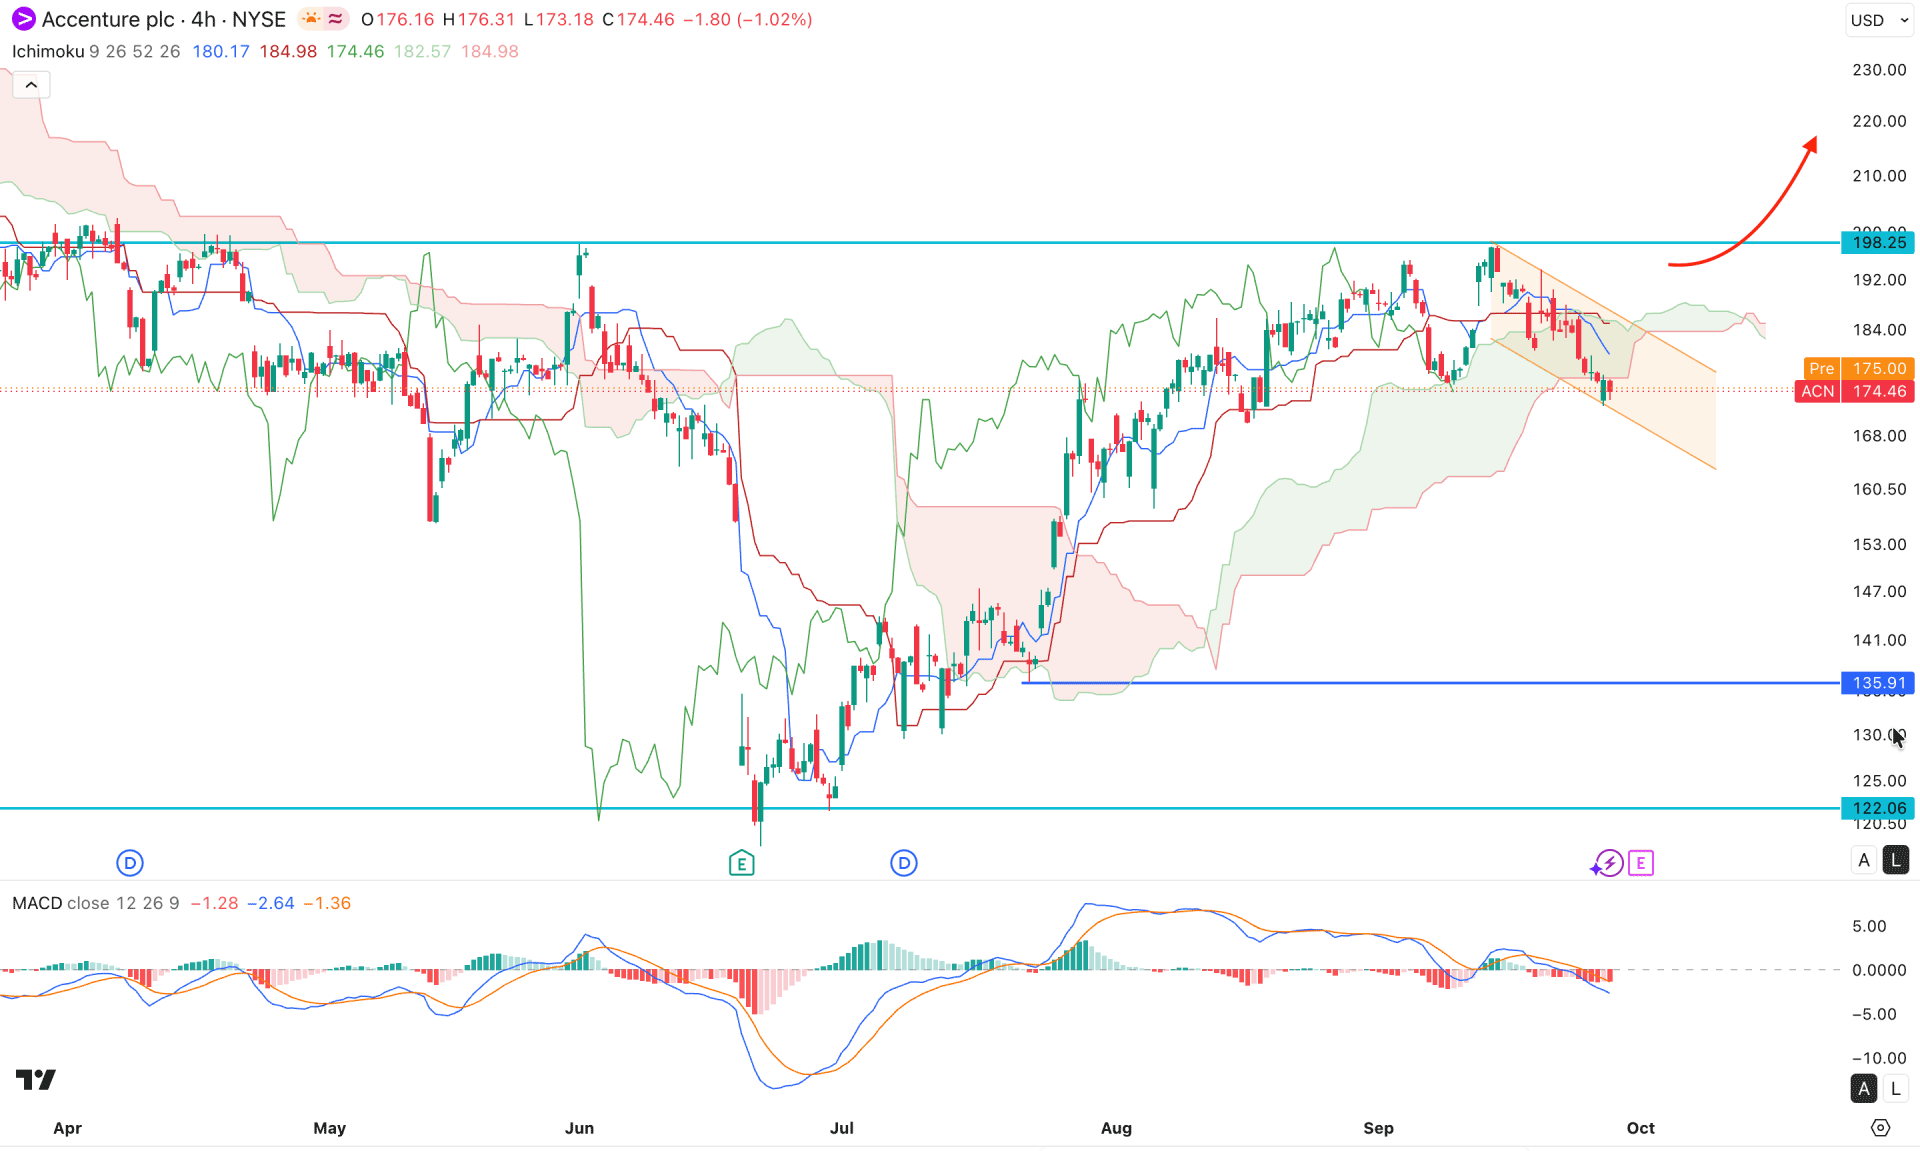
On the four-hour timeframe, ACN is trading in the premium price area, where consolidation is visible. As a result, the price crossed the dynamic line multiple times before moving below the cloud support area. Currently, the price is trading below the Kumo cloud, with a bearish flip in the future cloud signalling further downside pressure.
In the indicator window, the MACD histogram has remained bearish for a considerable time, while the signal line hovers below the neutral level, signalling a possible bottom formation.
Based on the market structure, ongoing momentum is sideways within a descending channel. A bullish recovery above the cloud, with a four-hour close above the 190.00 area, could present a potential long opportunity targeting 220.00.
On the other hand, consolidation around the current price could put pressure on buyers over time. In that case, the immediate support to watch is 135.91, before a deeper move toward 122.06.
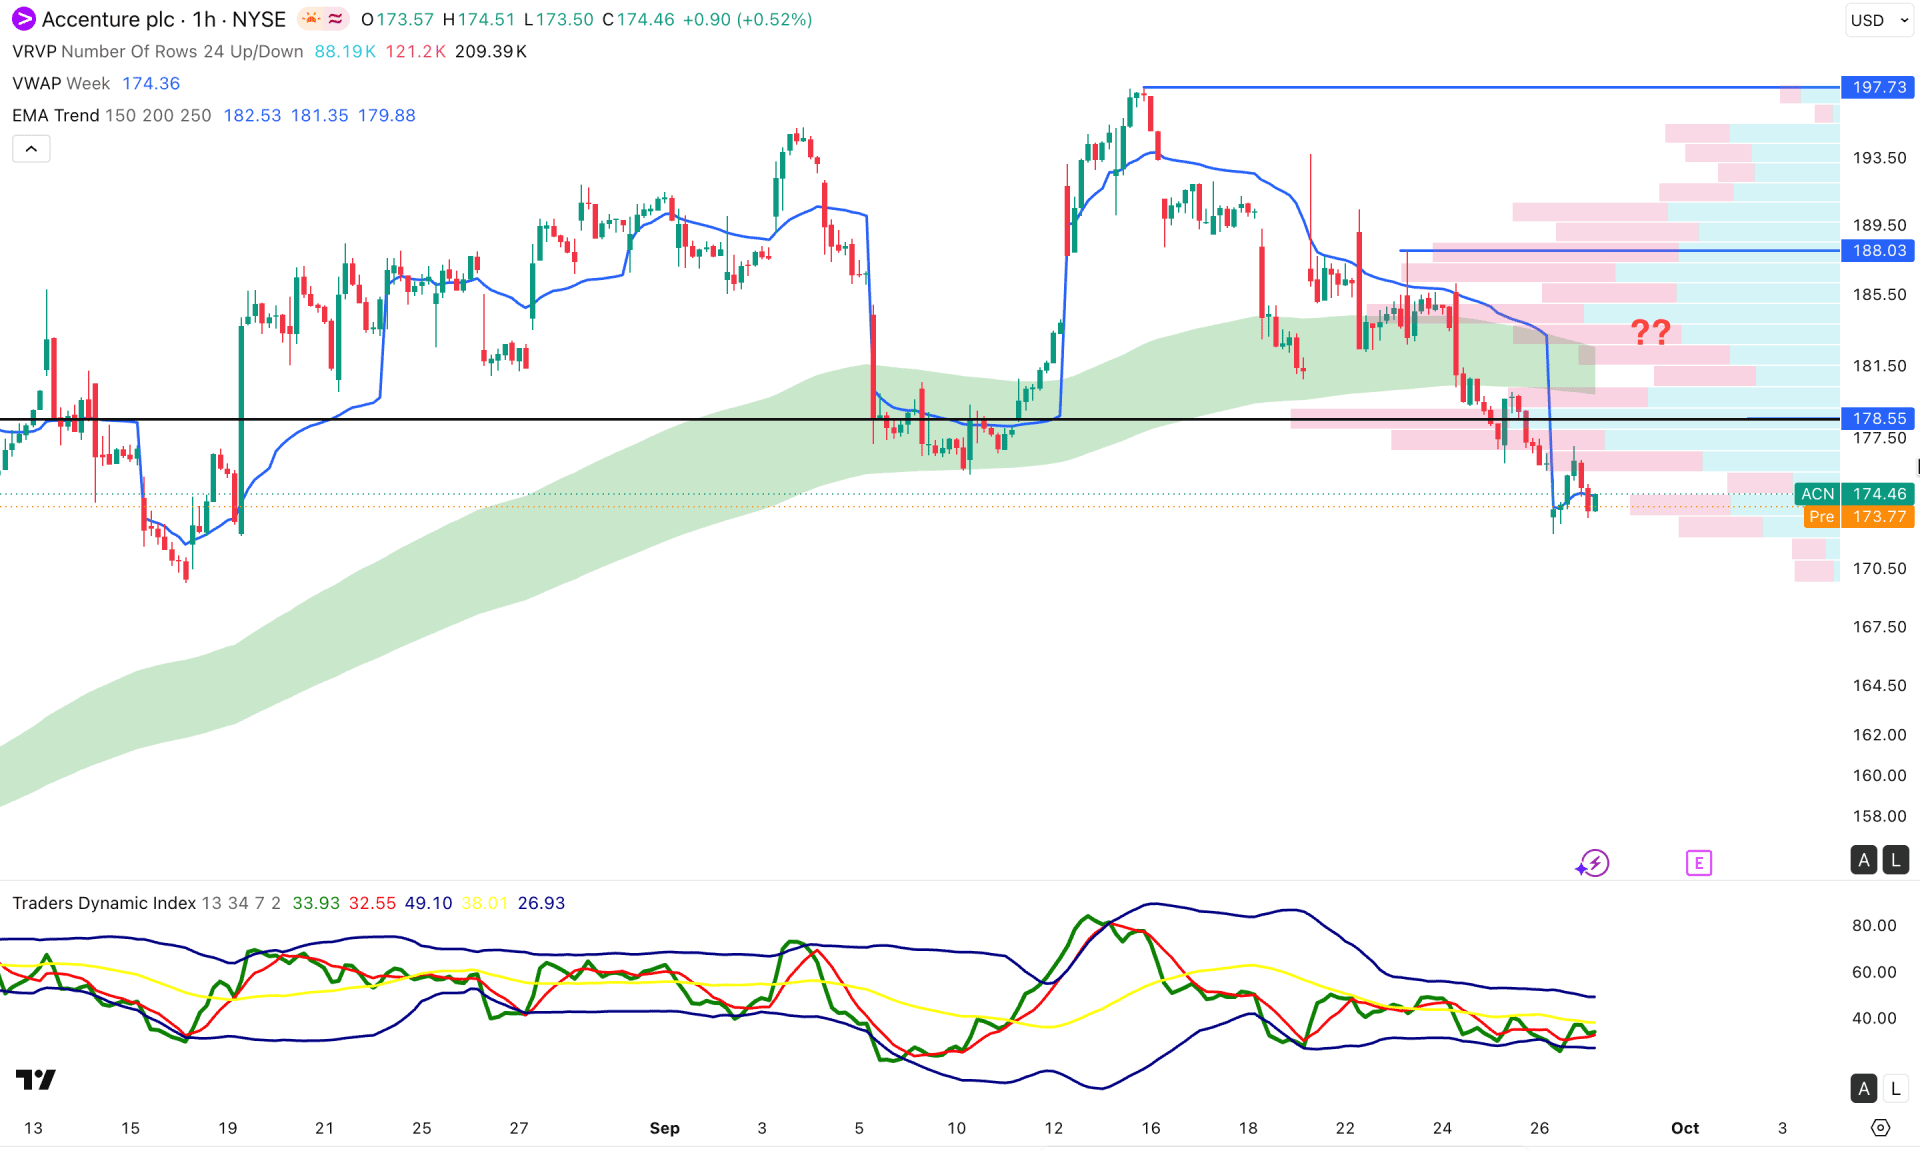
On the hourly timeframe, the price is trading at the bottom of the consolidation, with the intraday high-volume level and weekly VWAP above the current price. Moreover, a bearish move below the exponential moving average is visible, signalling an early short opportunity.
In the indicator window, the market is sideways, while the Traders Dynamic Index has remained flat for a long time.
Based on the hourly market structure, the price is trading in a bearish liquidity zone, from where an immediate rebound above 188.03 could present a high-probability long opportunity targeting 197.73.
On the other hand, the ongoing selling pressure remains valid as long as the price stays below the 178.55 high-volume resistance level.
Based on the overall market structure, ACN is trading within a consolidation zone that followed a long bullish move. With no sign of buying pressure at the daily double-top resistance area, the primary expectation is a moderate downside move in the days ahead. However, the upcoming earnings report is a key event to watch, as it could confirm a bullish technical breakout.


