Published: April 18th, 2023
According to my valuation model, Accenture's current share price appears fairly priced. The stock is trading at a premium of approximately 14.08% over its intrinsic value.
Consequently, purchasing the stock at the current price appears to be a good bargain. Even if the company's true value is estimated to be $246.92, the downside risk is minimal if the price falls beyond its true value level. Nevertheless, given the high beta of Accenture's stock, there might be a price fluctuation in the coming days, where a deeper discount could offer an investment opportunity.
However, investors should consider the future prospects of any stock before putting money into it. While value investors may focus on the intrinsic value of a stock, a more compelling investment opportunity is to seek out high growth potential.
With a projected 26% increase in earnings over the next few years, Accenture appears to have a bright future, which could result in increased cash flows and share prices.
Moreover, stock buying needs a proper understanding of technical structure and outlook. An increased demand for a stock could be potential if any buying opportunity comes from technical levels.
Let’s see the upcoming price direction of Accenture PLC (ACN) from the ACN technical analysis:

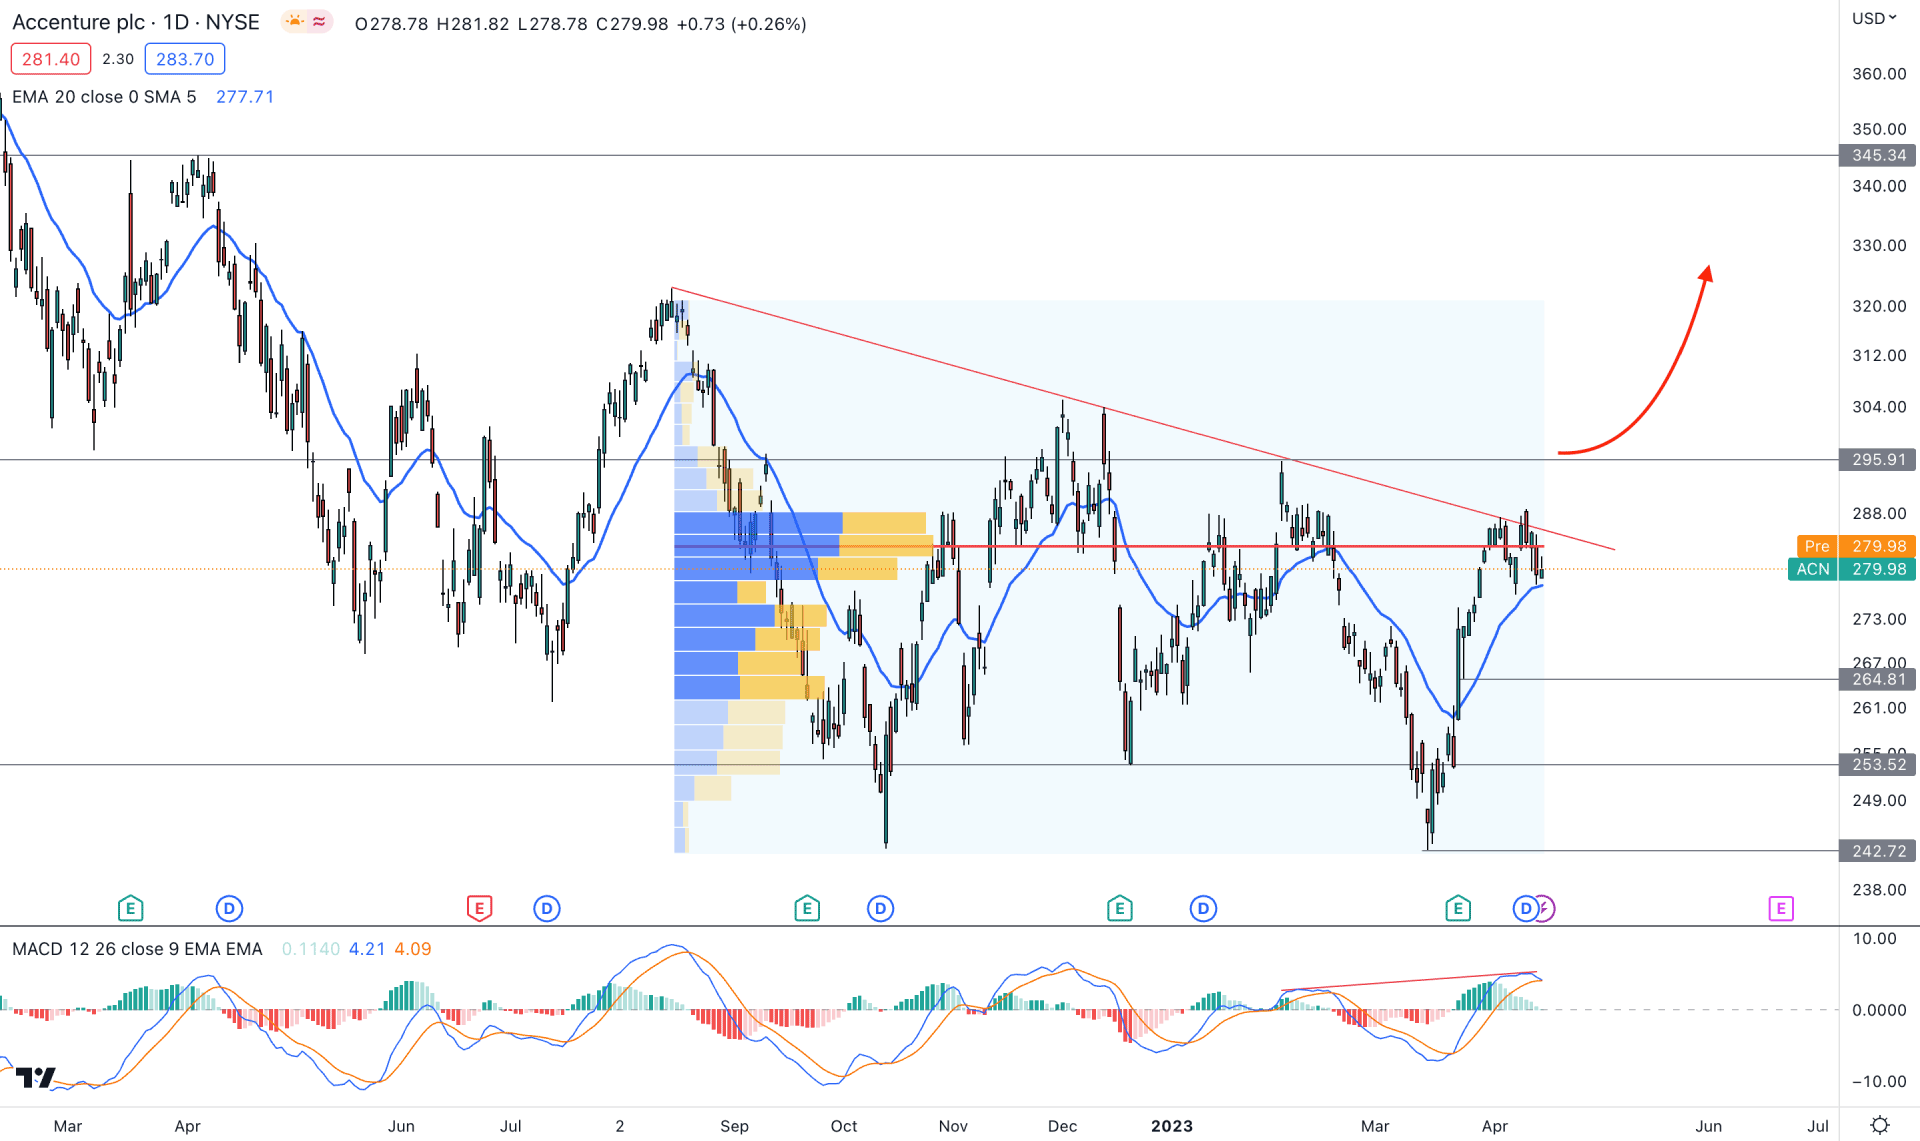
Accenture PLC Stock (ACN) has traded within a downside pressure since 2022, but the recent price action shows a sign of a bullish breakout.
Although the current trend is bearish, the momentum is not strong. The price formed a new swing low at 242.95 on 13 October 2022. Later on, the low was protected until a sell-side liquidity sweep came on 15 March 2023. As a result, a strong bullish pressure came with a V-shape recovery. The primary signal is that bears are weakening in this market, and bulls are gaining momentum.
Now identify the tradable zone- the liquidity sweep below the 13 October high came with a bullish Quasimodo formation in the intraday chart. Therefore, we can consider the 242.72 low as the bottom of the current tradable range. On the upside, a trend line liquidity is yet to grab where the top of the range will be at the 345.34 level. As the current price trades below the 50% Fibonacci Retracement level of this zone, we can consider the price as discounted, which is a strong bullish signal.
A different story is present at the main chart window, where a potential divergence is visible with MACD EMA’s. Moreover, a bearish crossover is seen at MACD EMA’s, while the current price is trading below the high volume level.
Based on the current price behavior, the first buying approach is to wait for a bullish break and a daily candle close above the 295.91 resistance level. Any intraday bullish rejection from dynamic levels could be a buying opportunity, targeting the 345.34 level.
However, the buying opportunity is valid as long as the price trades above the 253.52 event level, and breaking below this level could lower the price toward the 240.00 area.

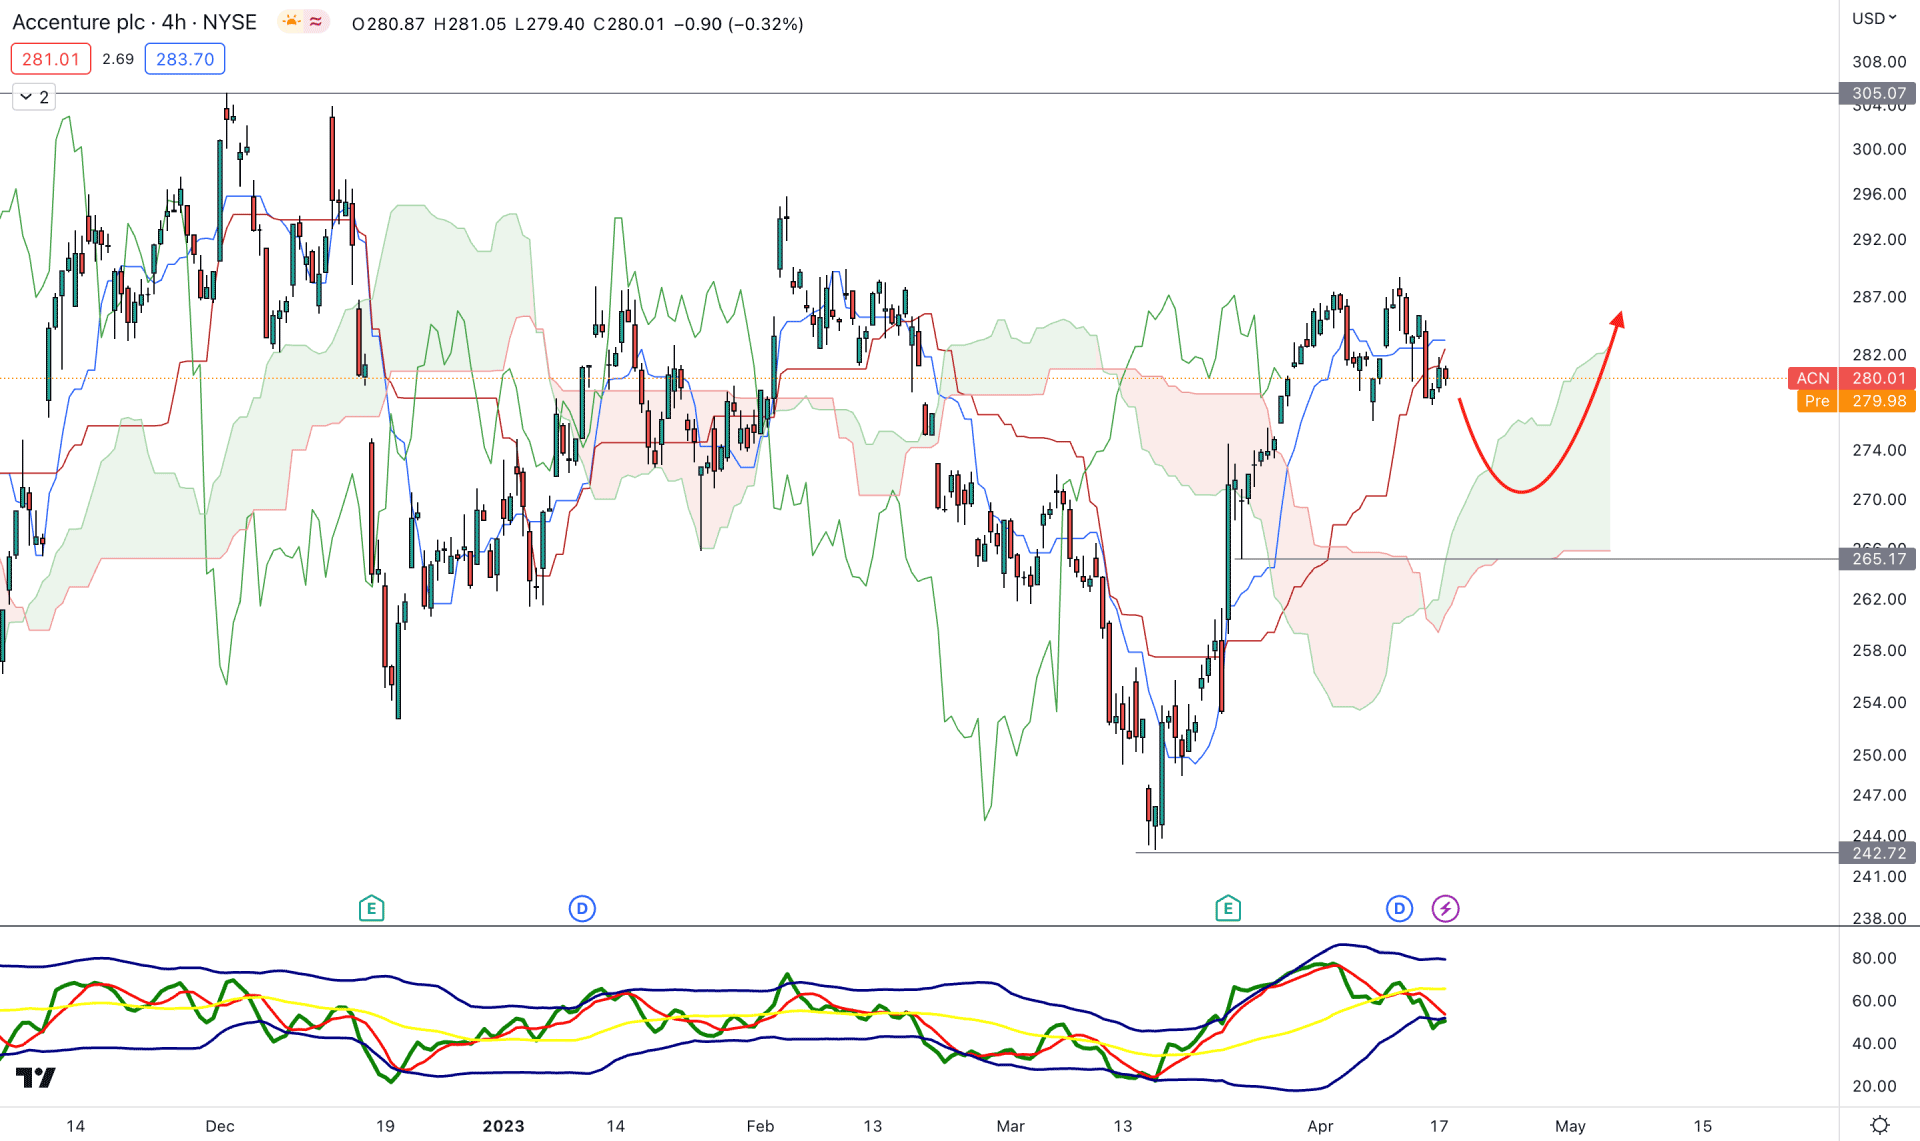
In the H4 chart, the current market outlook is bullish as a strong bullish recovery is seen above the Kumo Cloud area. Moreover, the thickness of the Future Cloud is solid, which signals a strong buying pressure in the market.
On the other hand, a minor downside correction is possible as the recent price moved below the dynamic Kijun Sen support with a bearish H4 close. The indicator window also shows the same story, where the current TDI level reached a lower band.
Based on the H4 price structure, downside pressure is potent as long as the price trades below the dynamic Kijun Sen support. However, an immediate bullish recovery from Kijun Sen or 265.17 static level could open a long opportunity, where the ultimate target is to test the 305.07 level.
Breaking below the 264.00 level with a bearish daily candle could lower the price toward the 242.00 area.

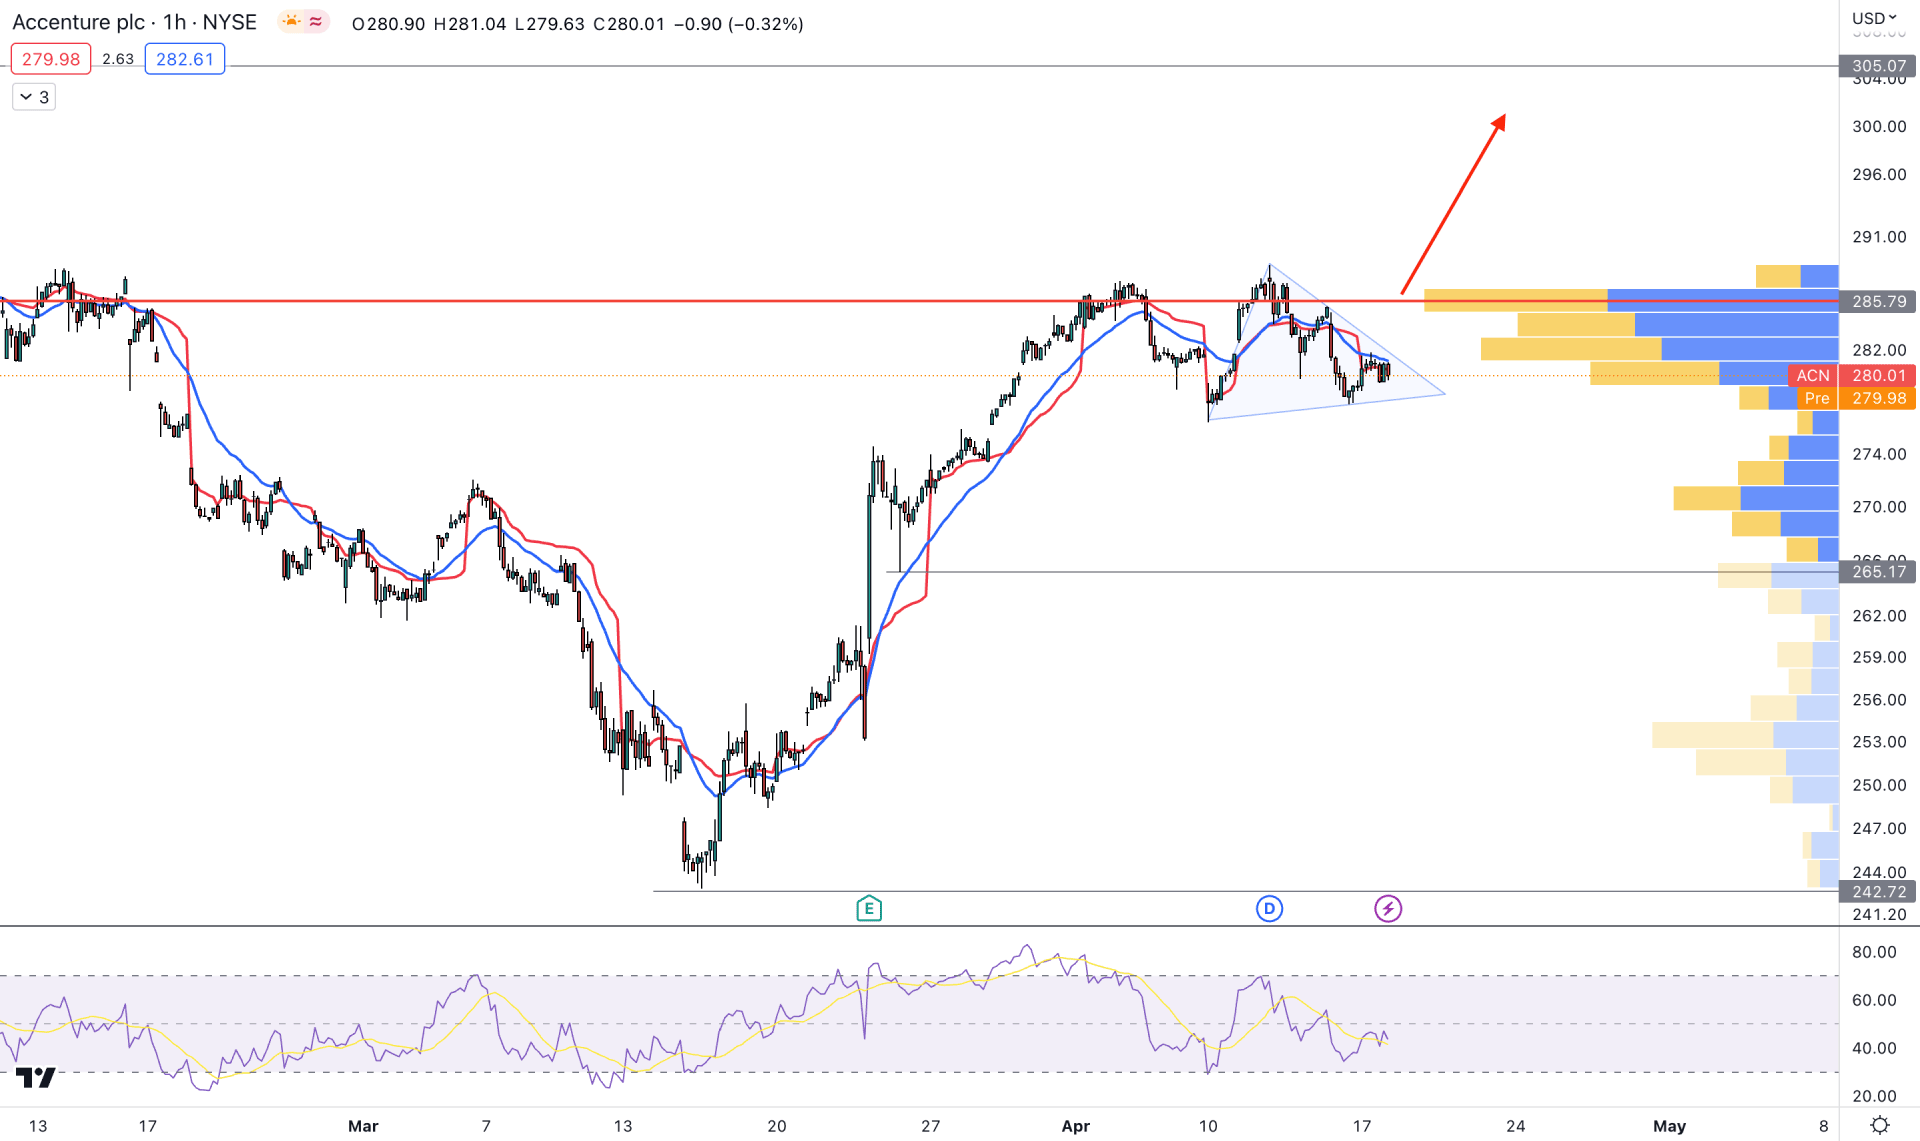
A potential symmetrical triangle formed at the top of the bullish swing in the hourly time frame. It is a sign that the buying pressure has faded, and an indecisive momentum can result in a potential breakout.
The latest Visible Range high volume level is above the current price at 285.79, which is a strong barrier for bulls. Moreover, the dynamic 20 EMA and weekly VWAP are above the current price, working as resistance.
Based on the H1 structure, investors may expect a bullish trend continuation opportunity after overcoming the 285.79 high volume level. However, a break below the triangle support with a candle close could lower the price toward the 265.17 level.
Based on the current price outlook, ACN could increase once the intraday correction is over. Investors should closely monitor H4 static and dynamic levels to find the best place to join the bullish rally.