Published: September 11th, 2024
To increase weETH/stablecoin liquidity, Aave DAO has launched the newly established EtherFi market to support its v3 protocol.
The growing adoption of wrapped ether (weETH) as security on Aave has increased the need for stablecoin lending, which this launch addresses.
Aave DAO claimed in an open declaration that borrowing caps are being reached in minutes because of the tremendous demand for weETH loans. As a result, this alternative market relieves pressure on the primary Aave market by giving stablecoins, including USDC, PYUSD, and Frax leverage.
By providing a dedicated environment for weETH and stablecoin combination, the EtherFi market improves the effectiveness and accessibility of borrowing. The market's emphasis on stablecoin liquidity may increase users and improve Aave's overall lending experience.
This development is anticipated to reinforce the Aave ecosystem, bringing in $12.5 million annually. The EtherFi market is a "significant step forward," according to Stani Kulechov, the founder of Aave Labs, who highlighted that it gives customers more alternatives while focusing on liquidity issues.
Following the debut, market observers are upbeat about Aave's potential. Prominent analyst Daan Crypto pointed out that Aave is trying to break through the previous cycle peak of $154. Goals of $200 and $260 may become more likely if Bitcoin's price moves positively.
Let's see the future outlook of this coin from the AAVE/USDT technical analysis:

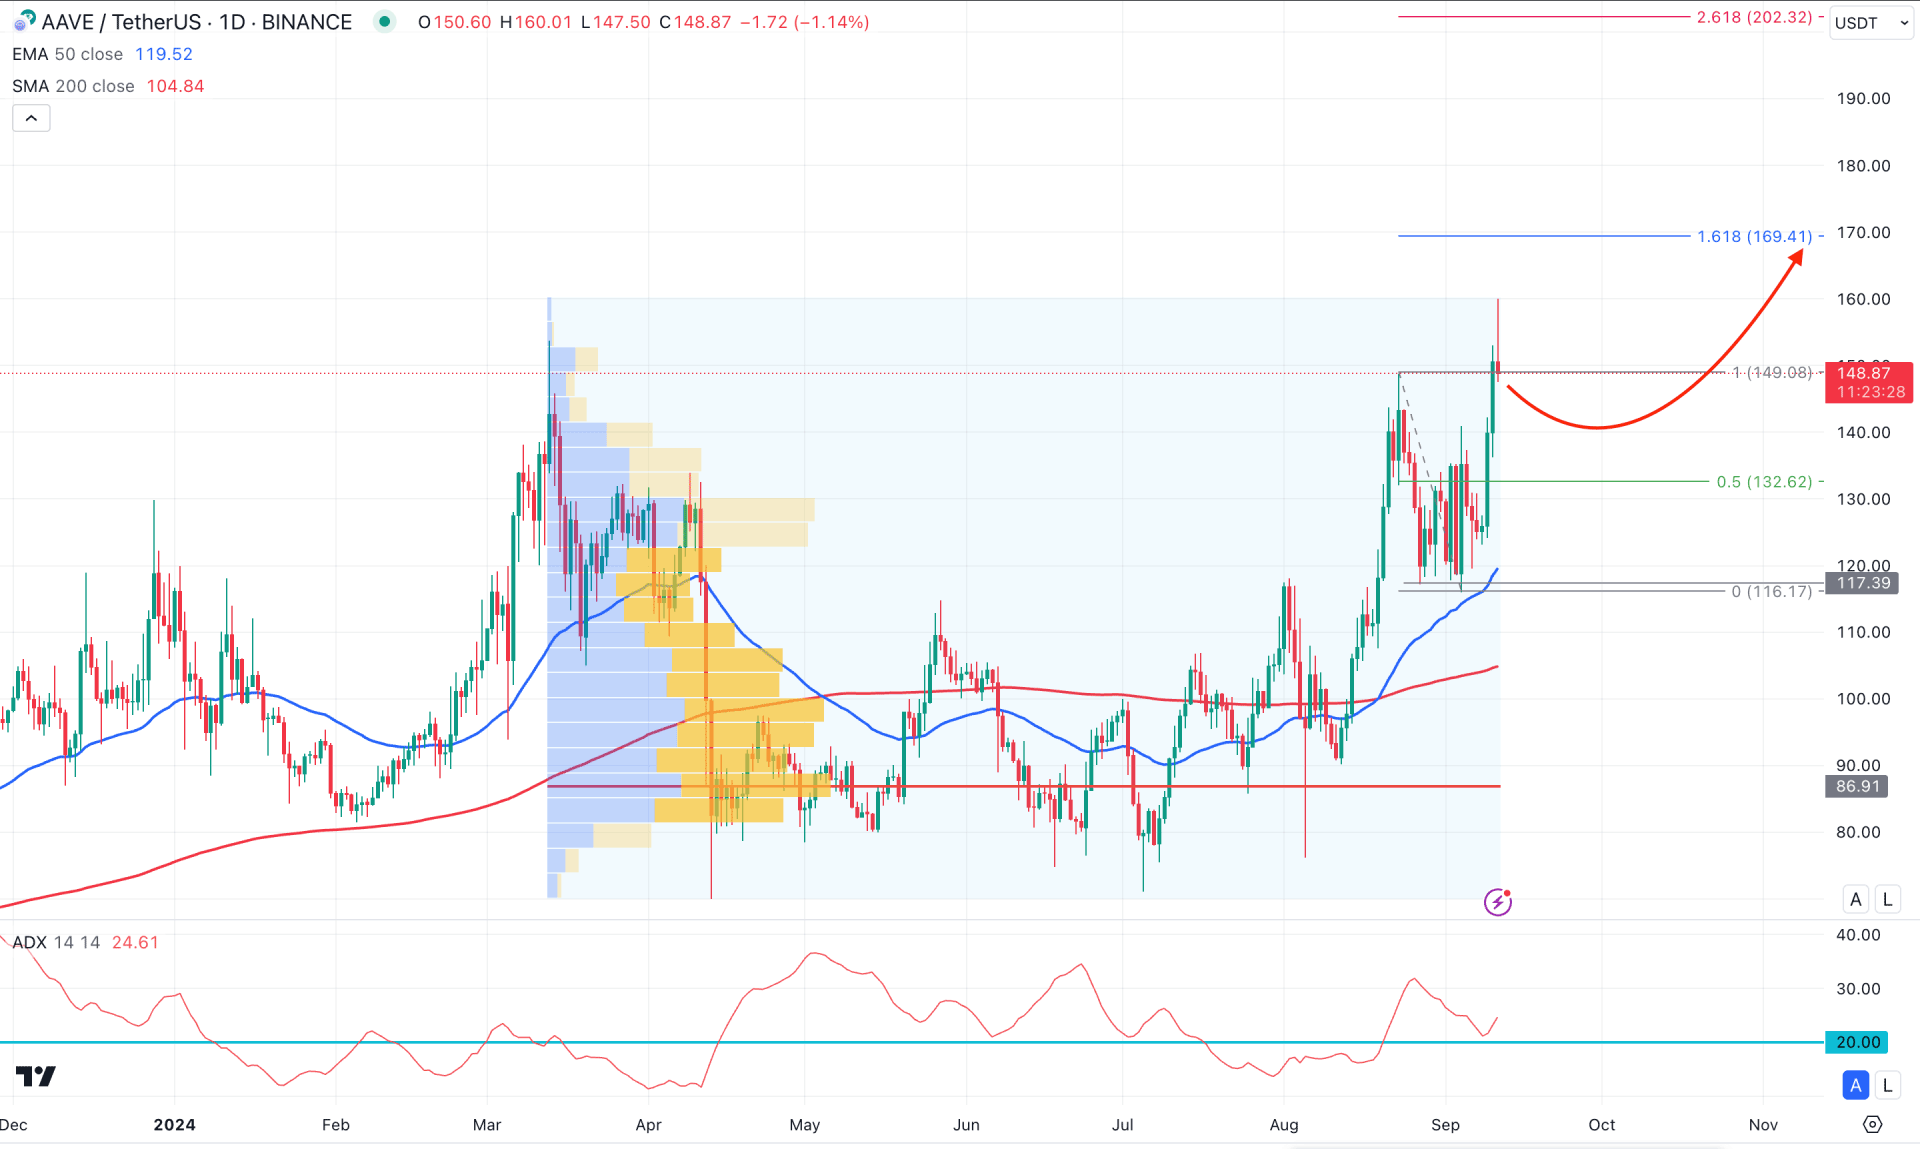
In the daily chart of AAVE, a U-shape recovery is seen in the higher timeframe, indicating a possible bull run in the coming months. Moreover, the corrective price action since 2023 came to an end as the recent price reached the highest level since June 2022.
In the volume structure, the current buying pressure is valid as it is hovering above the 86.91 high volume line. However, the price is trading at a record high with a gap from the high volume line. It is a sign of an overextended price action, which might need a sufficient downside correction as a mean reversion.
In the daily price, the 200-day SMA remains just above the 100.00 psychological line, while the 50-day EMA crosses above the 117.39 support level. As both dynamic lines are below the current price, we may expect the buying pressure to resume soon after the downside correction.
The Average Directional Index (ADX) hovers above the 20.00 psychological line in the indicator window, suggesting a corrective price action.
Based on the daily market outlook, the ADX below the 20.00 level with a downside pressure in the main price could increase the possibility of bullishness. In that case, a valid long signal with a candlestick formation from the 132.62 to 117.00 zone could extend the buying pressure at the 169.41 level before moving beyond the 200.00 psychological line.
On the bearish side, an immediate selling pressure below the 132.00 level might lower the price towards the 117.00 level, where the secondary support is at the 100.00 level.

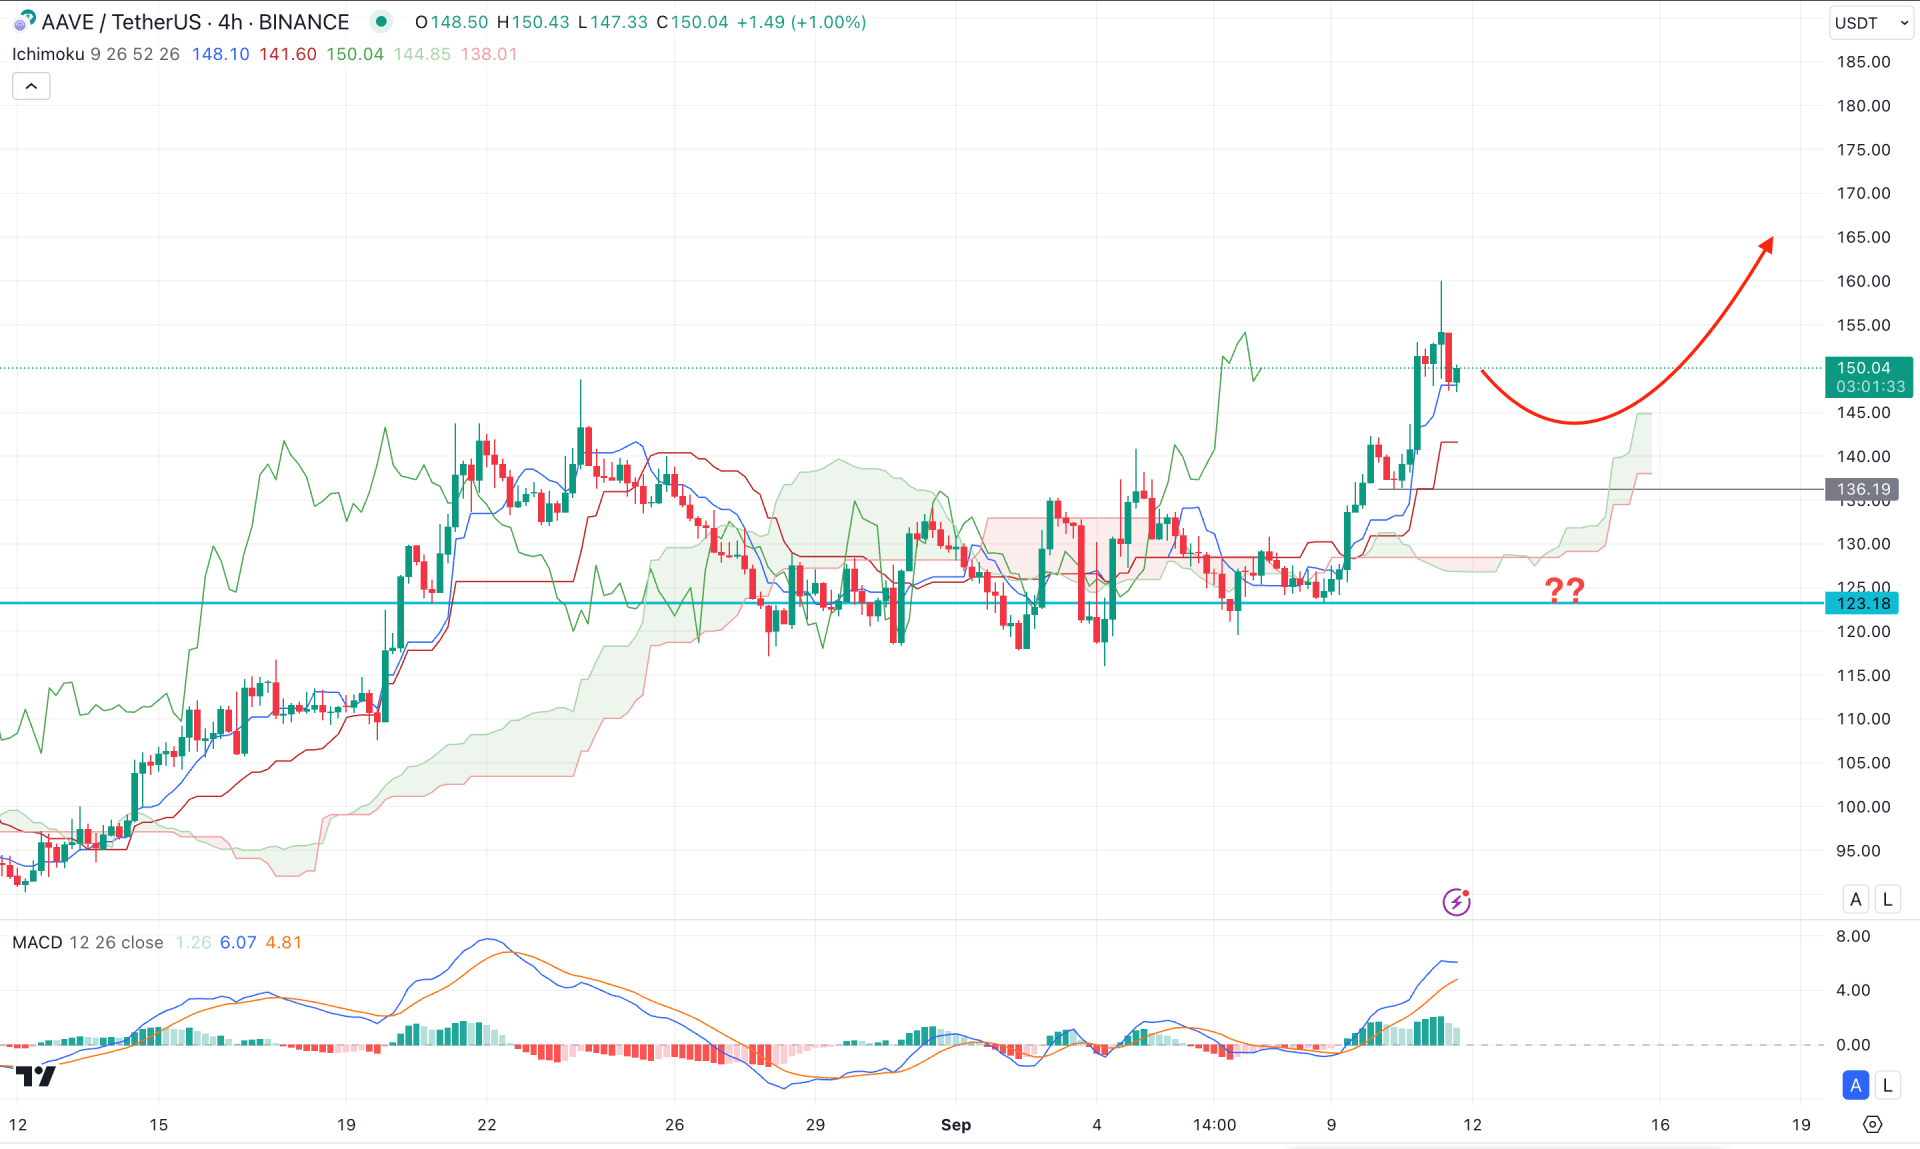
In the H4 timeframe, the recent price consolidates at the cloud zone before forming an impulsive bullish breakout. As a valid order-building phase backs the current bullish pressure, we may expect the upside pressure to be sustained in the future.
In the secondary window, the MACD Signal line reached the overbought zone, suggesting a pounding downside correction in the main price.
Based on the H4 Ichimoku Outlook, the recent bullish breakout might extend in the coming hours. However, a downside correction with valid buying pressure from the dynamic Kijun Sen line might offer a continuation signal.
On the other hand, a prolonged selling pressure with an hourly close below the cloud zone might resume the consolidation before forming a stable trend.

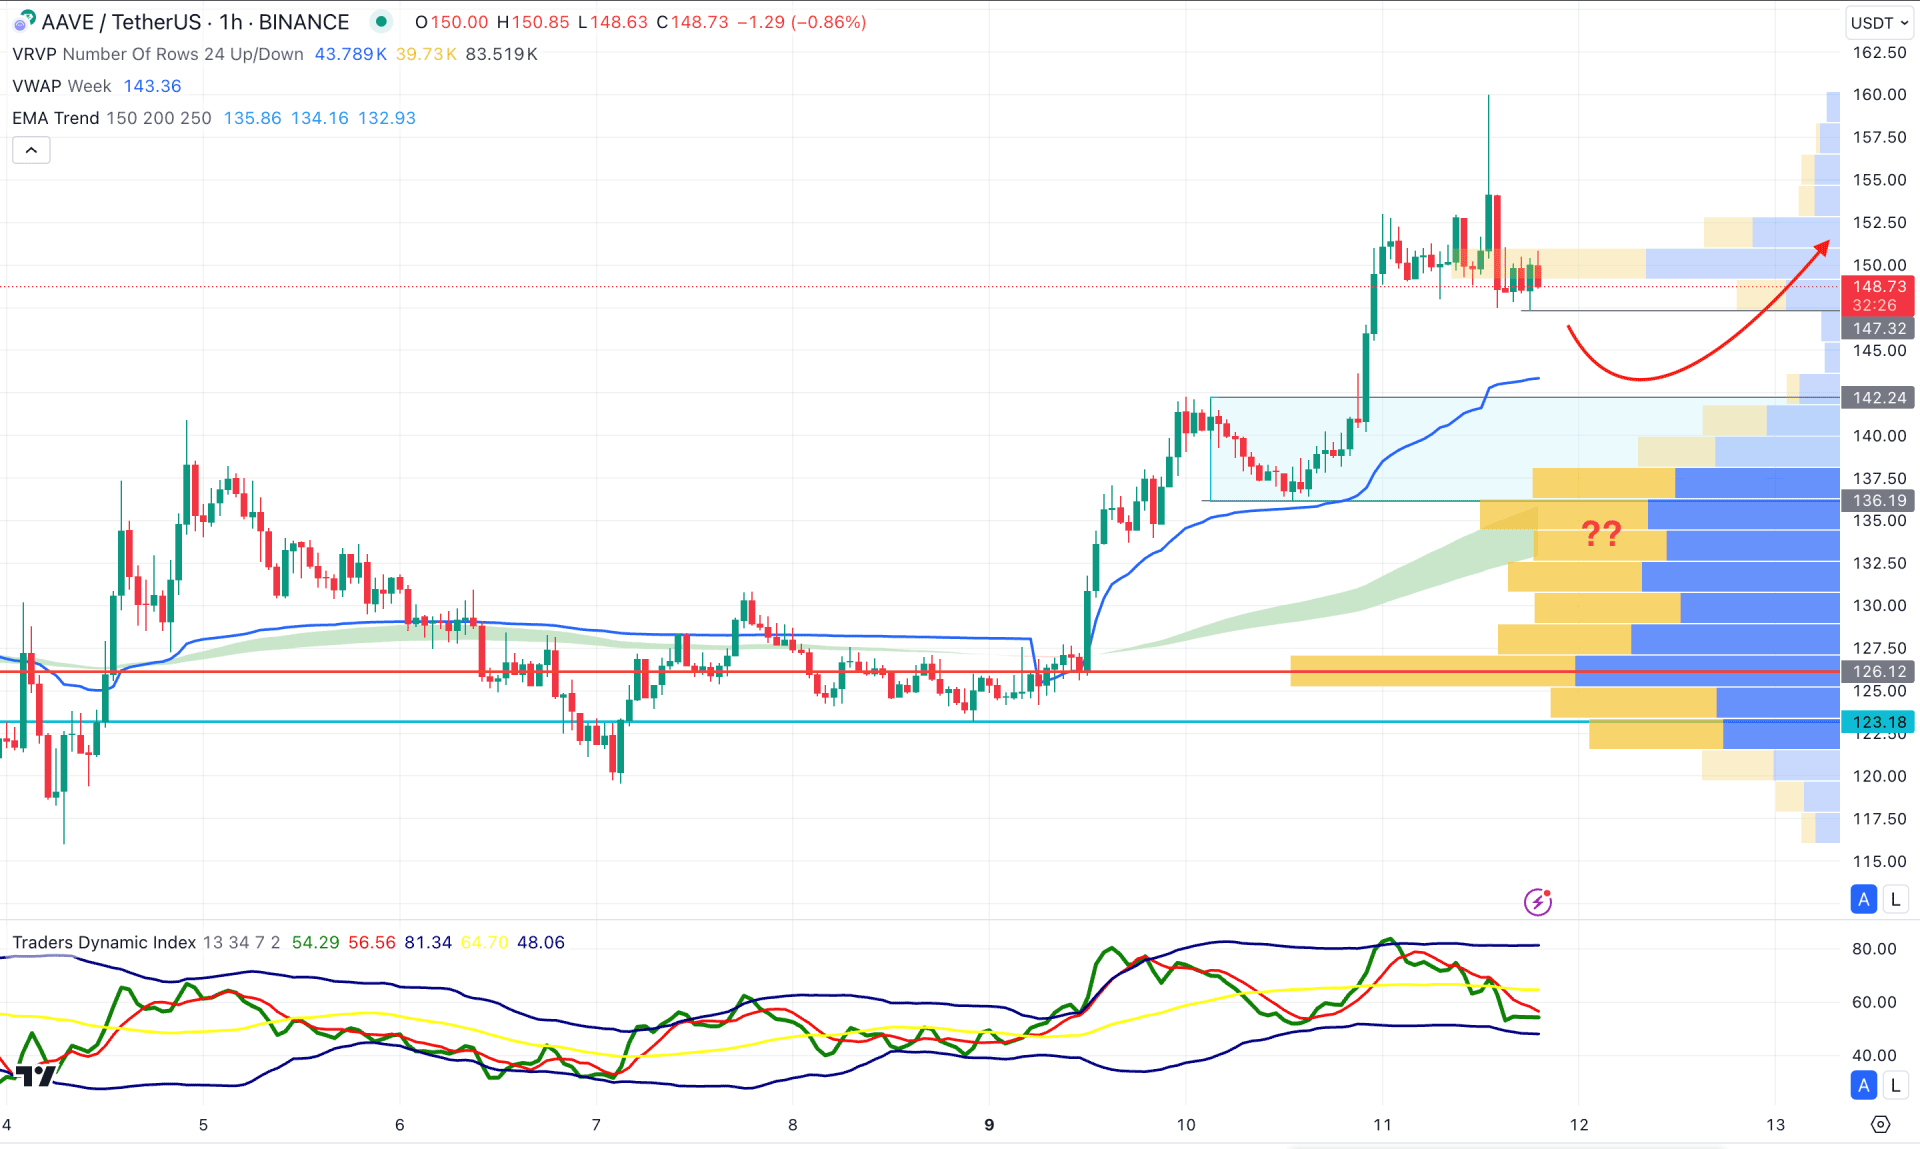
In the hourly time frame, the current buying pressure is seen in the AAVE price, where the visible range high volume line is below the current price. Moreover, the price is overextended from the high volume line and becomes volatile at the top. In that case, investors should monitor how the price trades in the recent time as the 147.32 low could be an immediate barrier to bulls.
Although the EMA wave and weekly VWAP are below the current price with an upward slope, the Traders Dynamic Index (TDI) moved below the 50.00 line.
In that case, a downside pressure below the 147.00 low might offer a long signal from the 142.24 to 136.19 zone. In that case, the upward possibility might move above the 160.00 level in the coming hours.
On the other hand, a prolonged bearish pressure with an hourly candle below the 135.00 level might lower the price towards the 126.12 high volume line.
Based on the current market structure, AAVE has a higher possibility of ending the multi-year consolidation and moving beyond the 200.00 psychological level. Investors might find a reliable long opportunity from the valid rebound in the intraday price.