
Published: March 18th, 2021
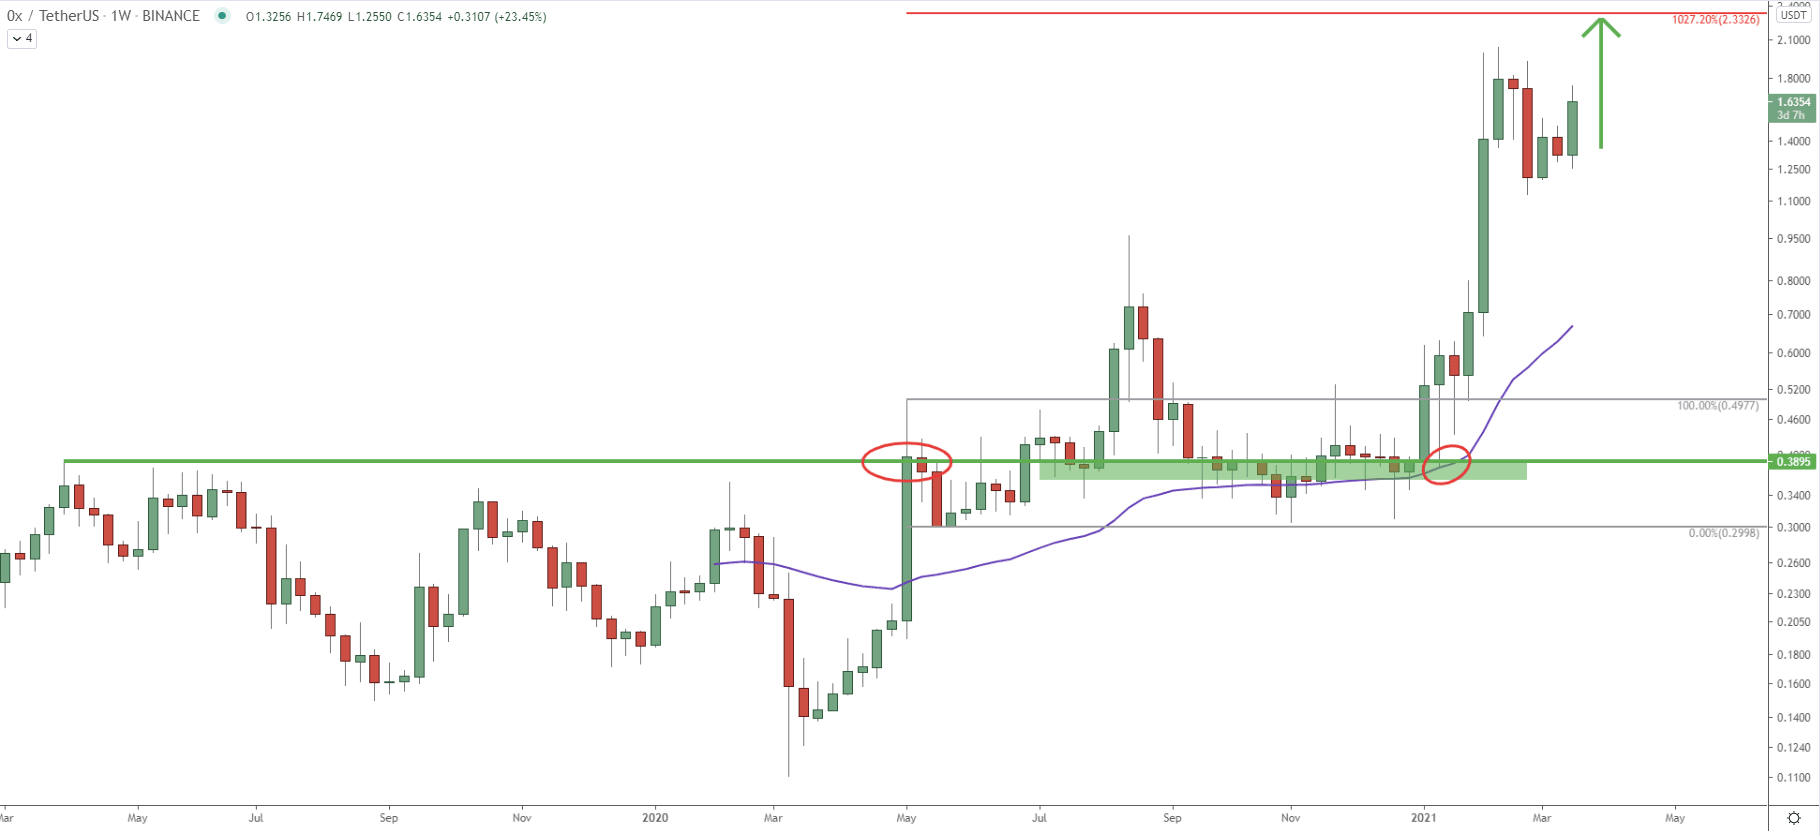
On the weekly chart, ZRX/USDT is clearly showing strong bullish momentum. But let’s go back to the past, where it can be seen, that near 0.389 price has formed a resistance, which eventually became the support area. The resistance was broken back in May 2020, where a huge green candle also broke the 50 Exponential Moving Average. This was the first strong bullish sign provided by the price action. However, after reaching the 0.800 resistance area, the price has been mostly consolidating without any major price move.
At the beginning of 2021, ZRX cleanly rejected the 0.389 support along with the 50 EMA, and this was yet another confirmation that the trend remains bullish. Although this time it was truly a substantial price increase by over 4 times. Price has traveled from 0.389 support up to nearly 2.000 resistance in a matter of just a few months.
Currently, there are no signs that the trend is about to reverse, and therefore the probability remains in favor of an uptrend continuation. The key resistance could be located at 2.332, which is a 1027.2% Fibonacci retracement level, where Fibs were applied to the pullback after ZRX/USDT broke above the key resistance. In the following charts, we’ll show why this resistance level could be the strong supply area.
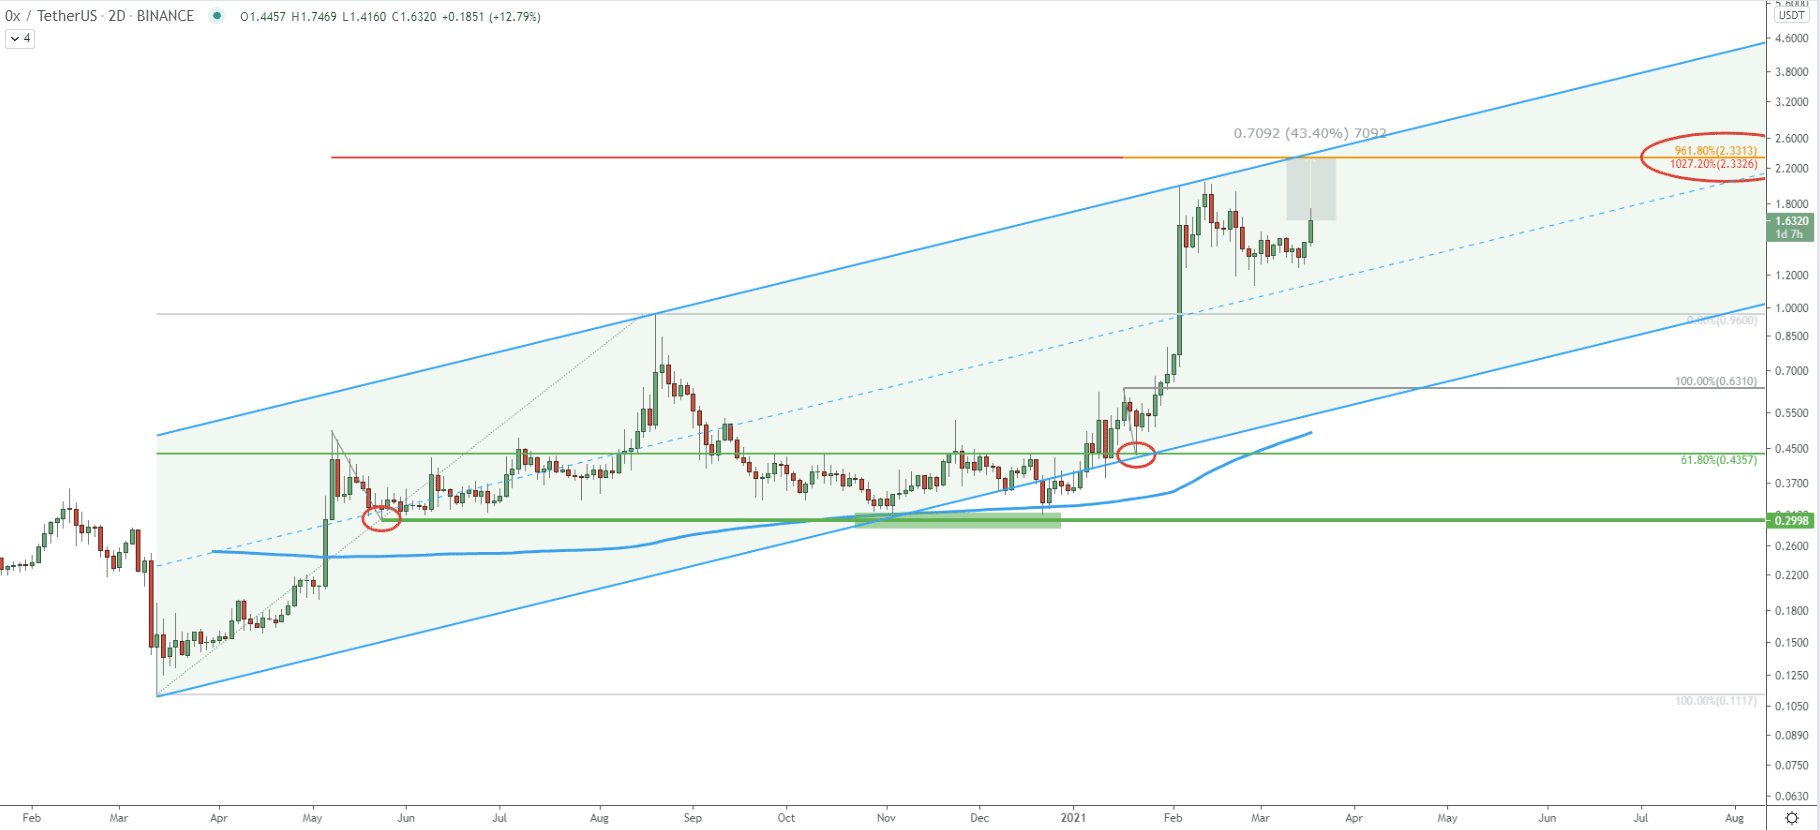
Price is moving within the ascending channel since March 2020. After the formation of the double bottom at 0.30 support, the uptrend did accelerate and went up sharply. Price has reached the top of the ascending channel suggesting a potential correction. And in fact, correction took place, which seems to have ended, based on the analysis on the lower timeframe which you will see below. But currently, the price is still in a bullish phase and could be heading towards the top of the channel once again.
On this chart, the upside target corresponds to two Fibonacci retracement levels. The first is 1027.2 as per the weekly chart. But the second is 961.8% Fibs, applied to the most recent bounce of the uptrend trendline. Therefore, another 43% growth could be expected by ZRX/USD in the next days or weeks. This could or should be a relatively fast price increase, based on the crossing of the Fibonacci resistance with the top of the ascending channel.
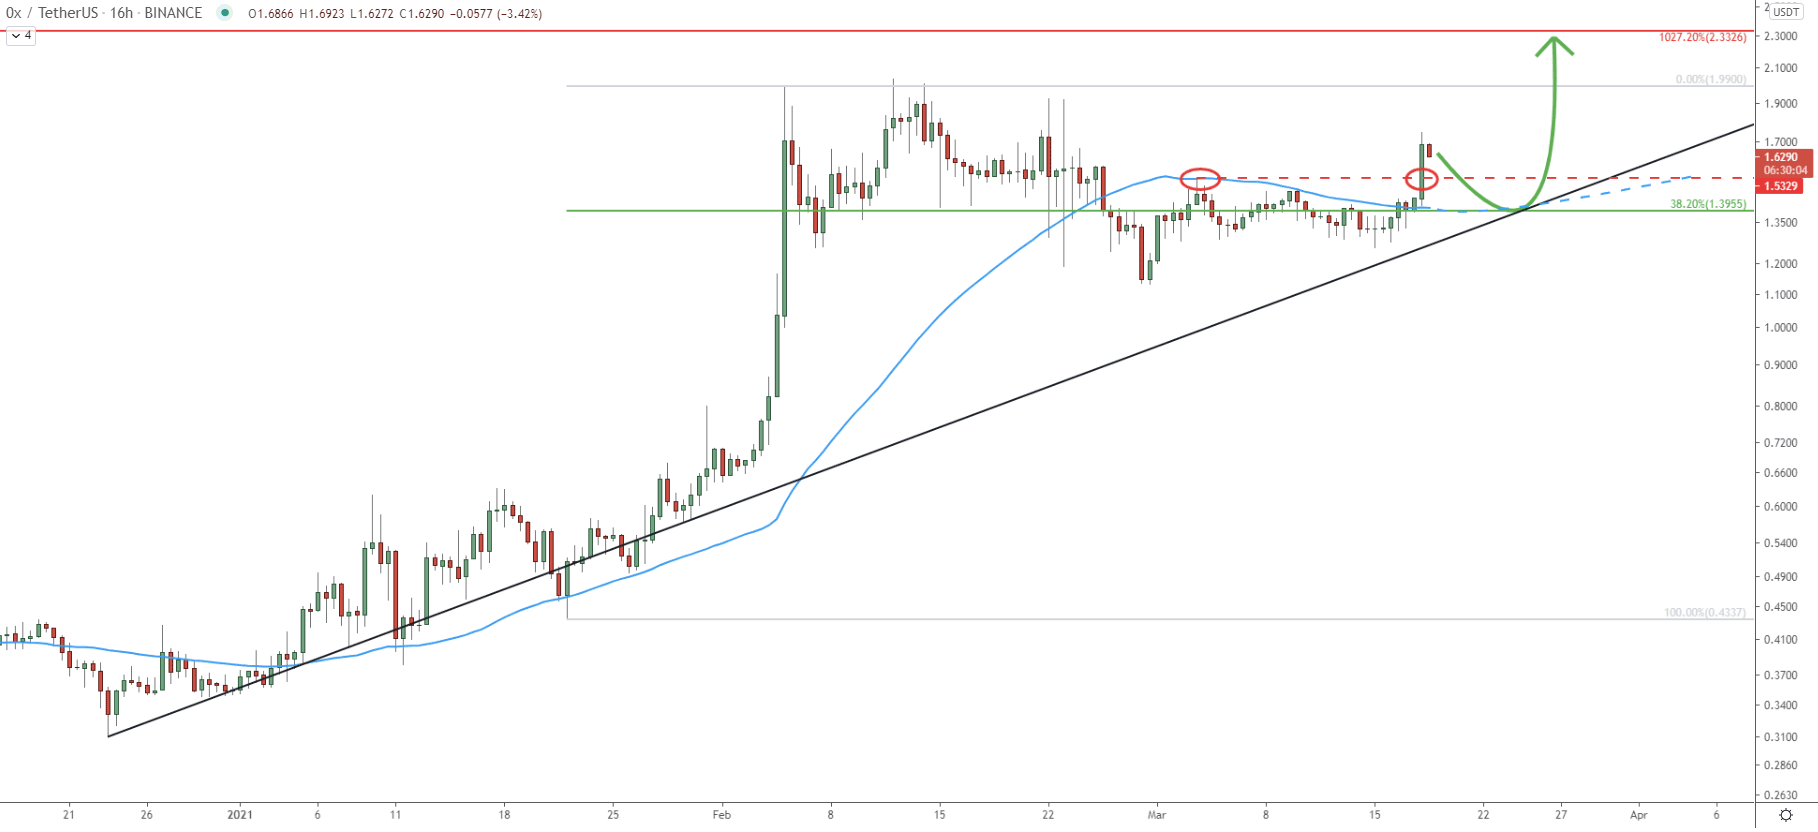
Based on the Fibonacci retracement indicator, applied to the last wave up, the nearest support is located at 1.39. This is the 38.2% retracement level, which is the strong demand area based on the previous price action. Considering that ZRX broke above the 50 EMA, and then above the previous high at 1.53, the uptrend is still intact. Nonetheless, the pullback should be expected, where the price could be heading down, to test the uptrend trendline.
Along with the uptrend trendline, ZRZ/USDT is likely to test the 50 EMA, which this time will act as the support. This makes the 1.39 support area extremely attractive for buyers and investors.
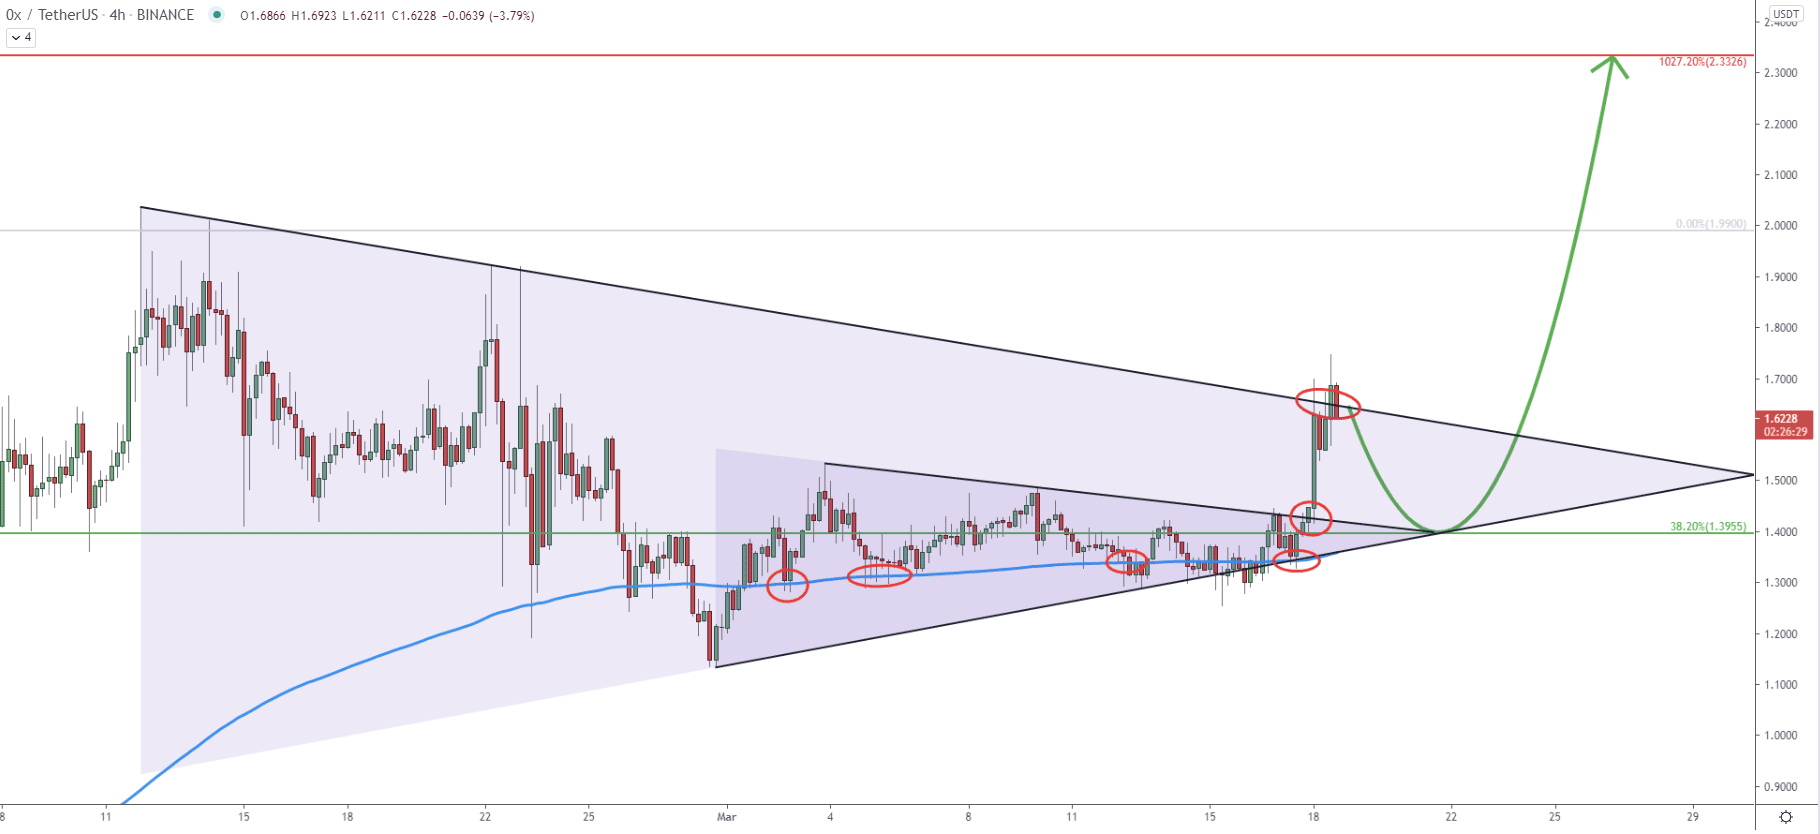
This is one of the most interesting charts in terms of the price action. We can see that there are two triangle patterns, where one formed within the second one. At first, the price has been consolidating and there were multiple bounced off the 200 EMA. Then there was the break above the first triangle, followed by the break above the second. Most traders would have entered upon the break above the large triangle. But, there was no clear break and close above, This implies there the correction is likely to follow, which might bring along attention by the buyers.
The key support is located at 1.39 or perhaps 1.40 psychological area, where the most interest could be concentrated. If the price will get back to this price area, it will be certainly a very attractive level for buyers. Besides, this price area corresponds to the minor downtrend trendline, which is likely to act as the support.
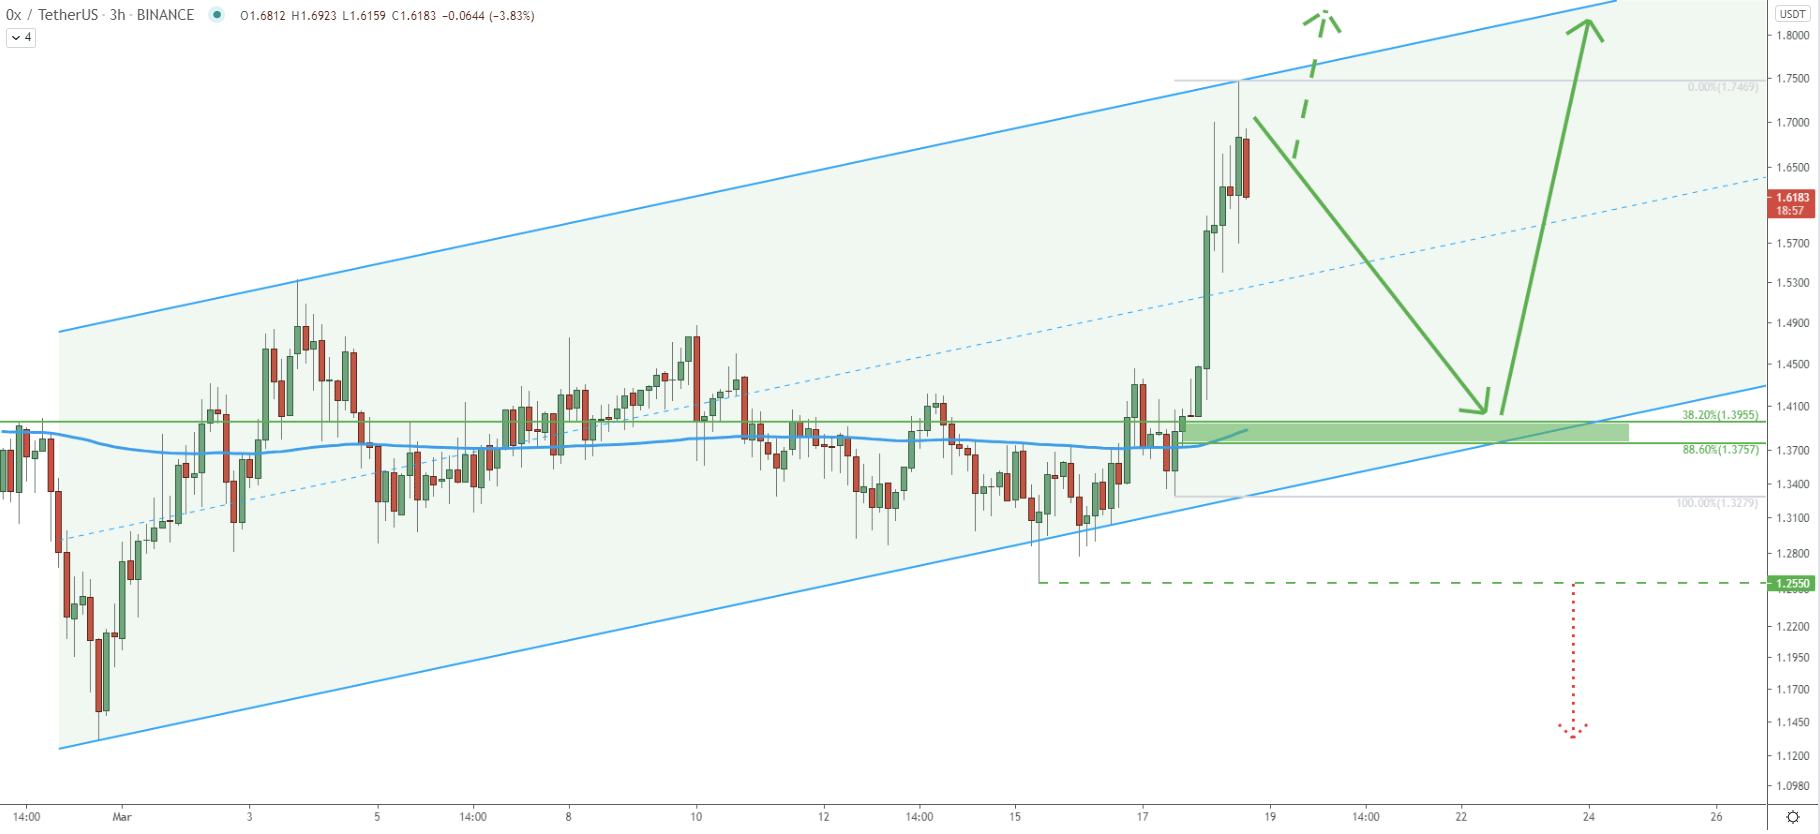
Here we can observe the rejection of the top of the ascending channel, which usually results in a strong downside move. In this case, the price could be heading towards the 1.40 support area, which is located between 38.2% and 88.6% Fibonacci retracement levels. This is certainly the most attractive zone for bulls because it provides the best risk to reward buying opportunity. Having said that, ZRX/USD price might continue to increase without any corrective move, but only if it manages to break the recently printed high at 1.74.
The altcoin season seems to be ongoing, and there will be multiple coins moving up strongly one by one. One of the next big movers could be the ZRX, especially if the price will correct down tears the 1.40 support area. Such a pullback might offer a perfect risk/reward opportunity for short-term buyers as well as long-term investors.
As per the daily and 2-day chart, the key resistance is located at 2.33, which is confirmed by two Fibonacci retracement levels.
As per the 3-hour chart, the key support is located near 1.25. As long as the price is above, the trend will remain strongly bullish. On the other hand, a break below the 1.25 level will completely invalidate the bullish outlook and ZRX/USDT price should be expected to decline towards the 1.00 psychological support.
Support: 1.39, 1.37
Resistance: 1.74, 2.33


