Published: February 26th, 2021
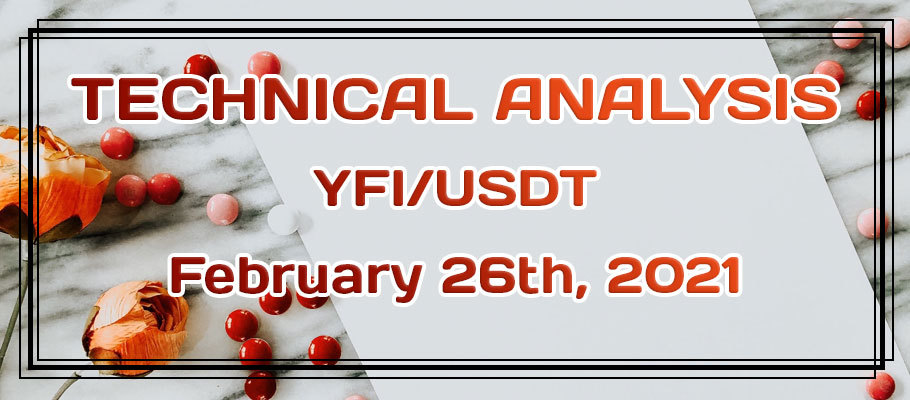
Starting off with the daily chart, we can clearly see that the uptrend has been developed. This is because higher highs and higher lows are being produced. Besides, there was a clear break and close above the previous all-time high, established in 2020. Current downside correction might result in a great opportunity for the buyers and in this analysis, we’ll try to understand why.
The YFI/USDT price has been rising since November 2020, after forming the bottom at 7450. While rising, the price has been breaking above Fibonacci resistance levels, which then became support. The first was the 38.2% Fibs at 21388, which got rejected In November, along with the 50 Simple Moving Average. Next was the 61.8% Fibs at the key psychological level, which is 30000. It got broken, and on the recent pullback acted as the support, which up until now is being respected by the market participants. Along with the Fibonacci support, YFI also bounced off the 50 SMA along with the uptrend trendline.
Such price action goes to show, that bull is still in complete control, and as long as the price remains above the 30k level, especially the daily closing price, the uptrend continuation is imminent. In the medium, to long run, it might result in the price increase towards one of the Fibonacci resistance levels. The first is 161.8% Fibs at 66500 resistance area. If it will be broken, the next resistance becomes at 103000, which is extremely close to the key psychological level at 100k. Moreover, this resistance is confirmed by two Fibs, the 261.8% as well as 727.2% retracement level as can be seen on the chart.
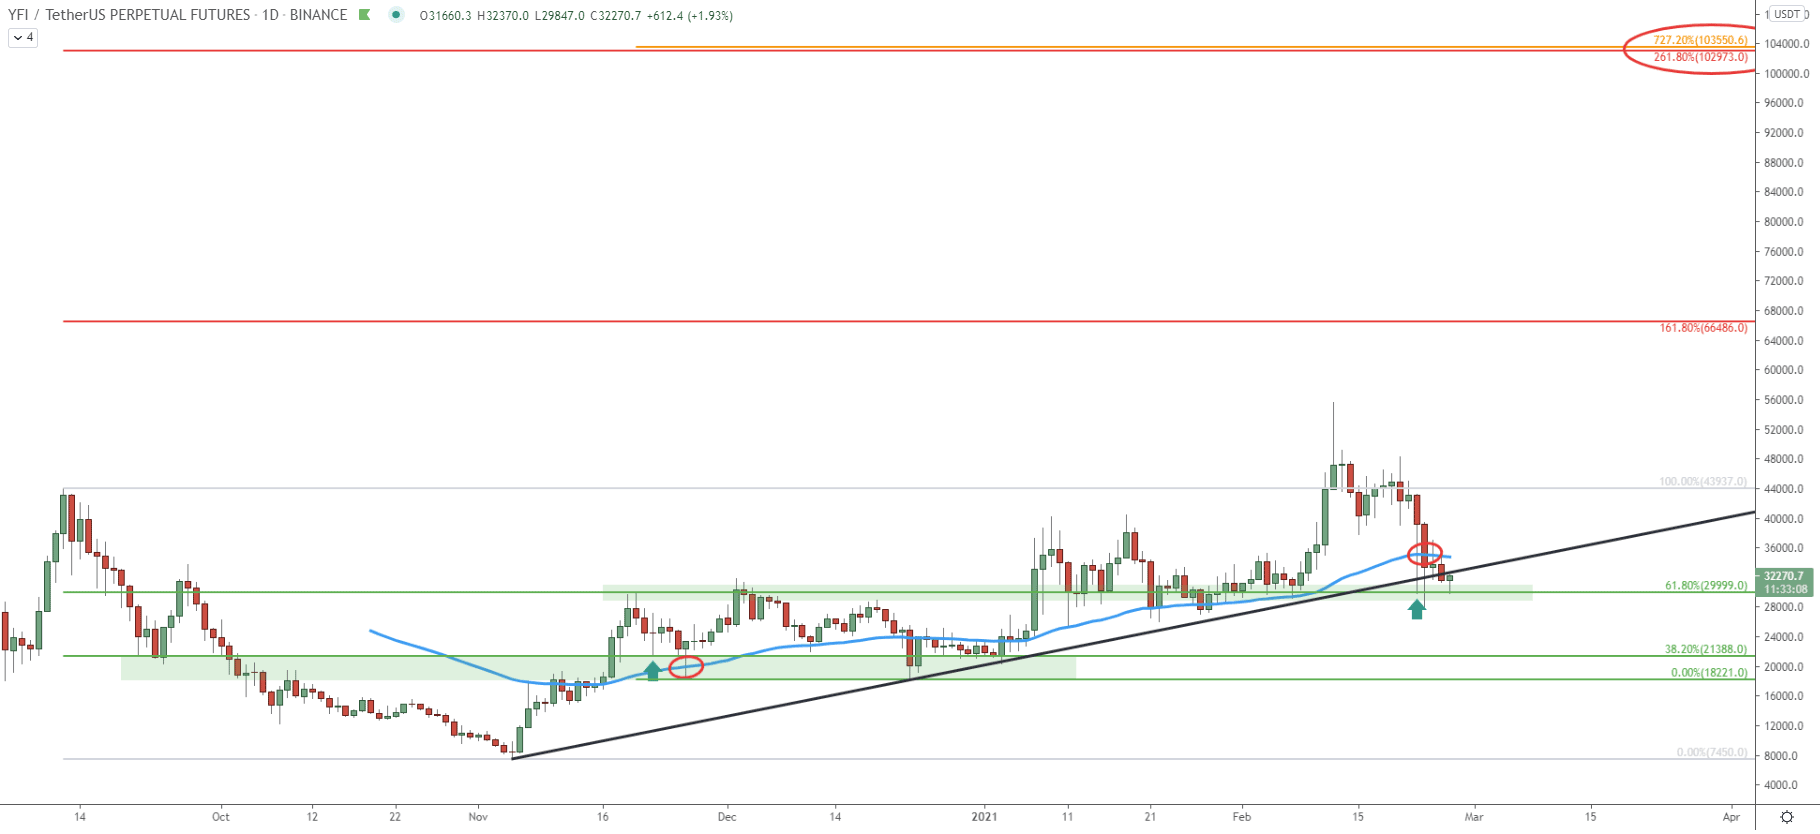
On this chart, it is very obvious how the previous resistance area near the 30k psychological level has become the support. The current decline was stopped by the average-price uptrend trendline, which got rejected along with the 200 SMA. At the same time, the price has reached and rejected the bottom of the extended ascending channel, and of course, bounced off the 30k support area. Even the 50 EMA hasn’t been broken with confidence as price only produced a spike below, without a confirmed close below the bottom of that spike.
This is a very bullish pattern, and the current pullback will certainly be of great interest to the long-term buyers and investors. While the price can be expected to hit the 100k, which is the final upside target, the nearest resistance must be watched. This is the 66500 level, which on this chart corresponds to the crossing of the Fibonacci level and the top of the ascending channel.
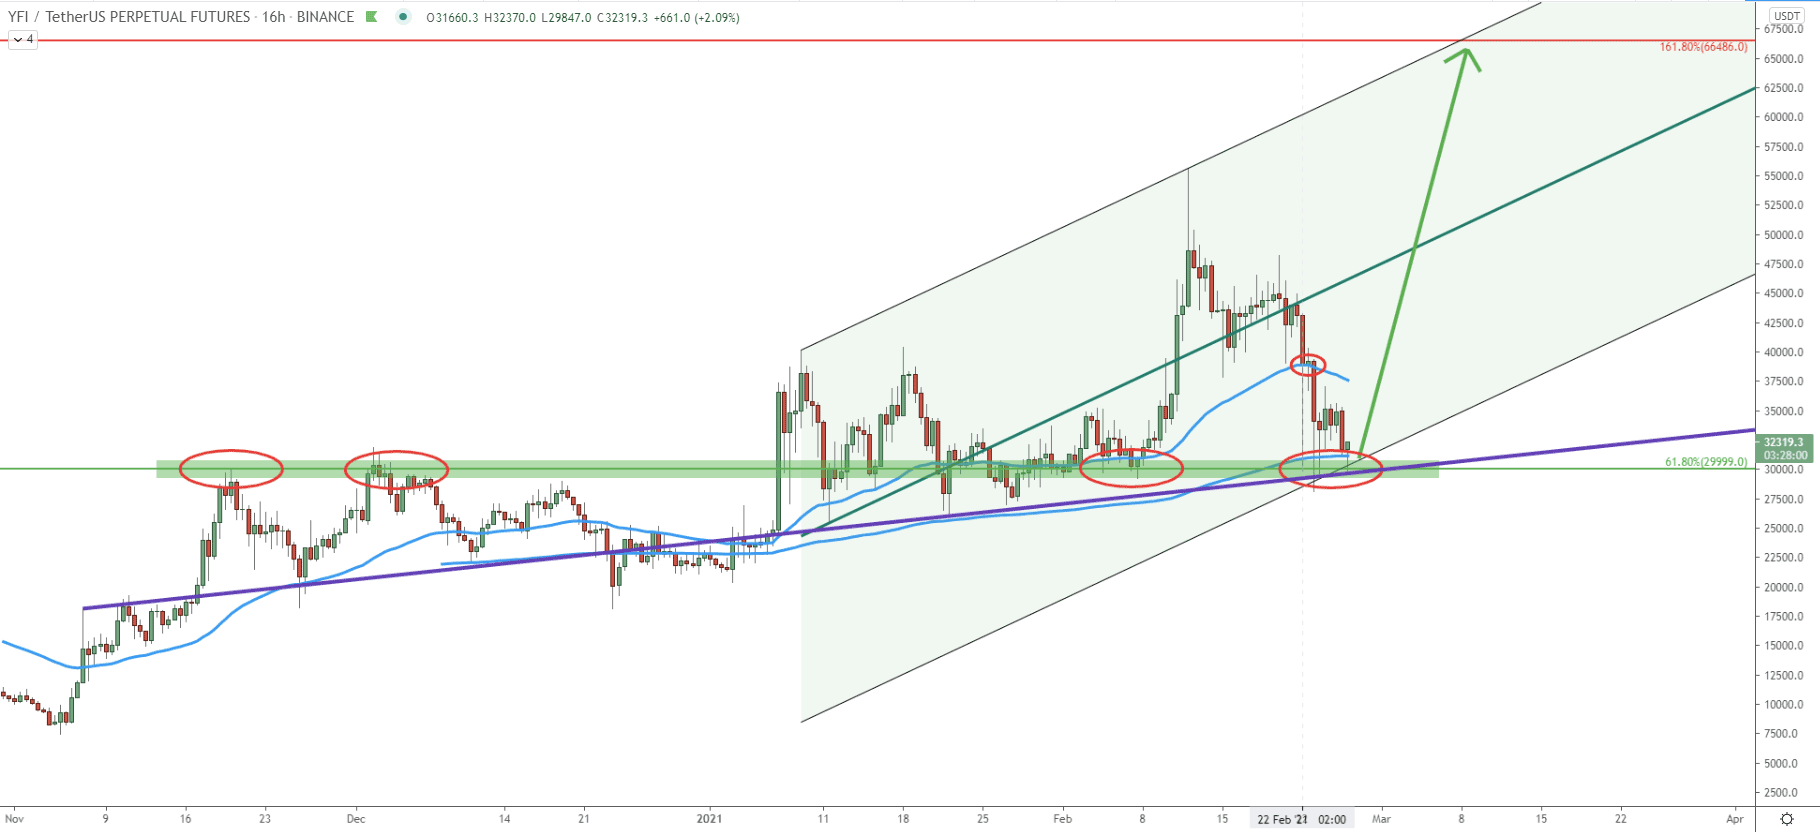
Right now, YFI is trading in the key supply/demand area, which is also an area, where the most trading volume was recorded since the beginning of 2021. Clearly, the 30000 is an extremely important price, which right now is acting as a huge support. Therefore, as long as the price is above the recently printed low at 28072, buyers are likely to start actively getting into the YFI. And sooner, rather than later it should send the price up substantially. It seems that the time to act is now, but only if the recent low will remain to be respected.
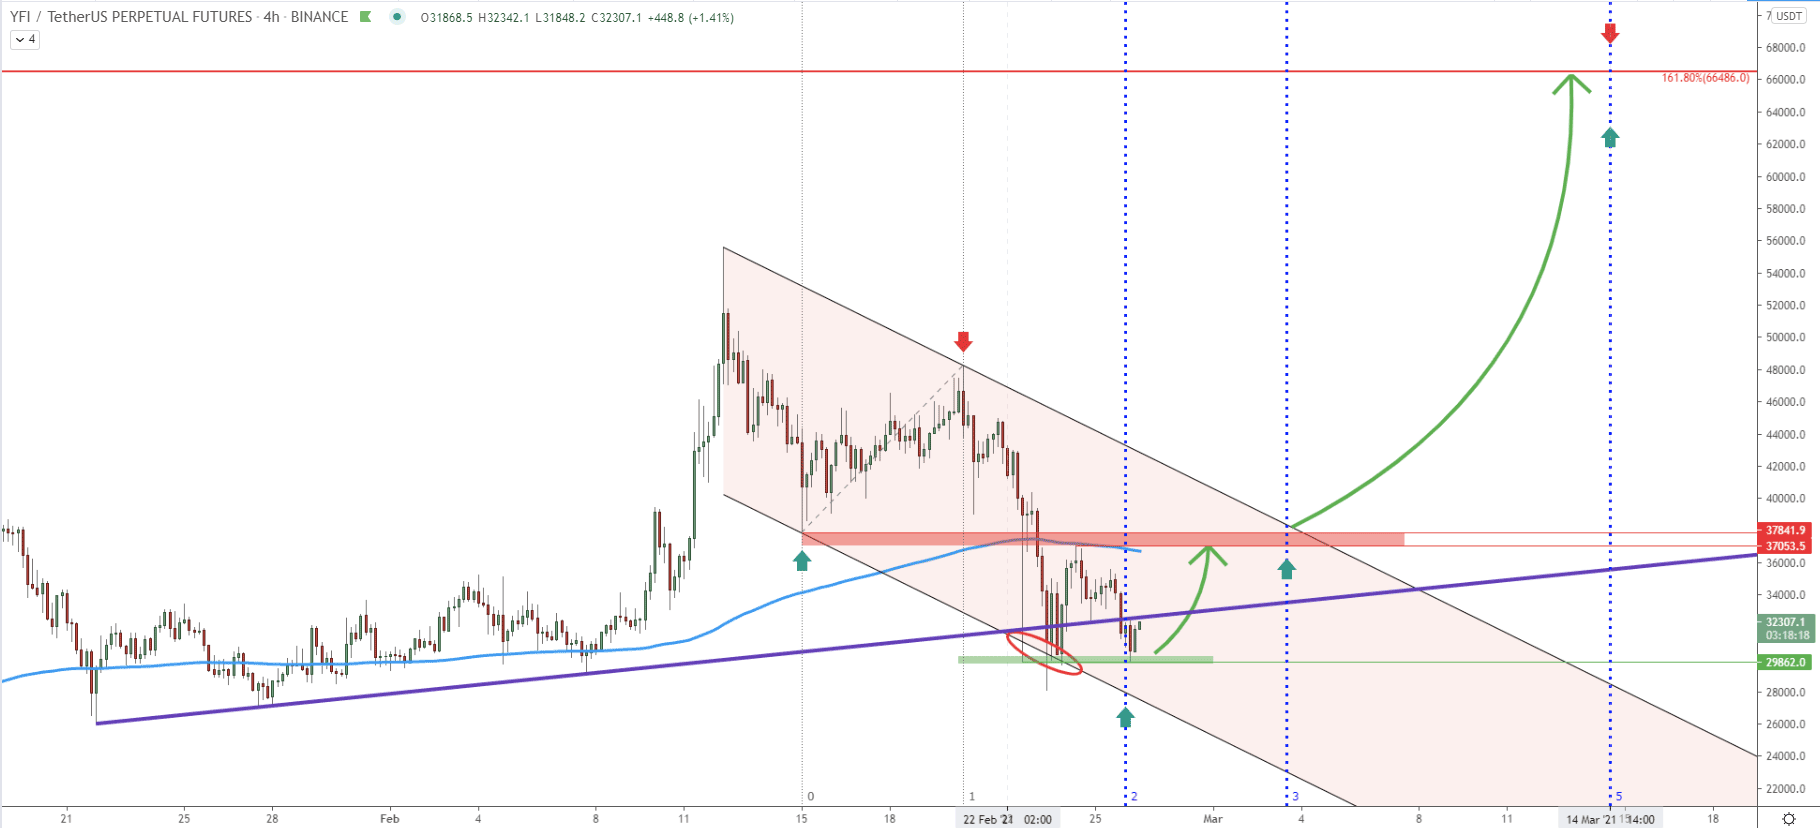
On the 4-hour chart price has reached and rejected the bottom of the descending channel and at the same time bounced off the simple uptrend trendline. Also, the 200 EMA was rejected, considering the fact that there was no 4h closing below the 28862 support. At this level, YFI has produced a double bottom, which is yet again a very attractive price action for buyers. Based on the Fibonacci cycle indicator, a new cycle has started just today. Clearly, it is likely to be a bullish cycle, which should send the price towards the nearest resistance area between 37-38k. This is the price area where YFI previously found the support and then resistance. For this reason, in order to confirm a strong bullish momentum, this resistance area must be taken out by the buyers, and perhaps with the next Fibonacci cycle, which is on March 3, the price will start an exponential growth. The rise of the YFI/USDT might be ending on March 14, which is the following Fibonacci cycle. But at the same time, it might be the time when a new bullish wave will begin.
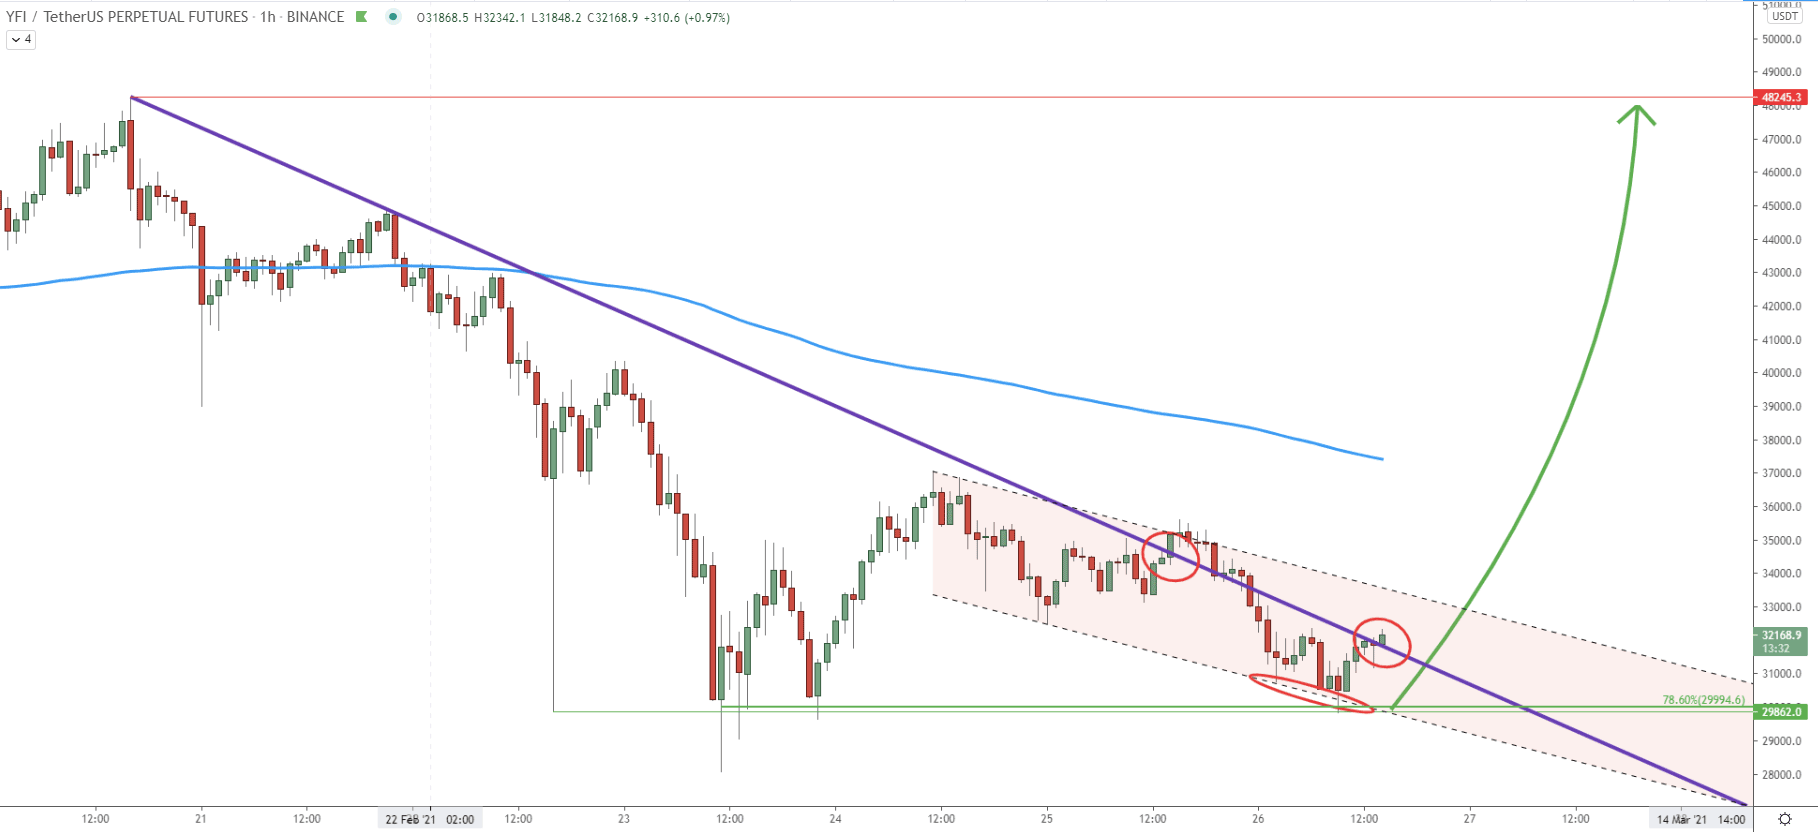
On the hourly chart, the simple uptrend trendline was broken, suggesting the beginning of a potential trend reversal. Since the breakout, YFI continued to move down and today produced a double bottom near 30k support. The price rejected the bottom of the descending channel, and right now YFI is yet again breaking above the trendline. Obviously, YFI/USDT price has a good chance to start reversing to the upside, providing an excellent risk/reward opportunity for buyers.
The cryptocurrency market has been going through a strong downside correction. But this pullback might have already ended. Maybe not for all coins, but the Yarn.finance does provide some strong indications that the bottom has been tested, and now price is heading towards a new all-time high.
As per the daily chart, there are two resistance areas to be monitored. The nearest seems to be 161.8% Fibs near the 66500 area, while the second and the key resistance is at 103000, which is confirmed by two Fibonacci levels.
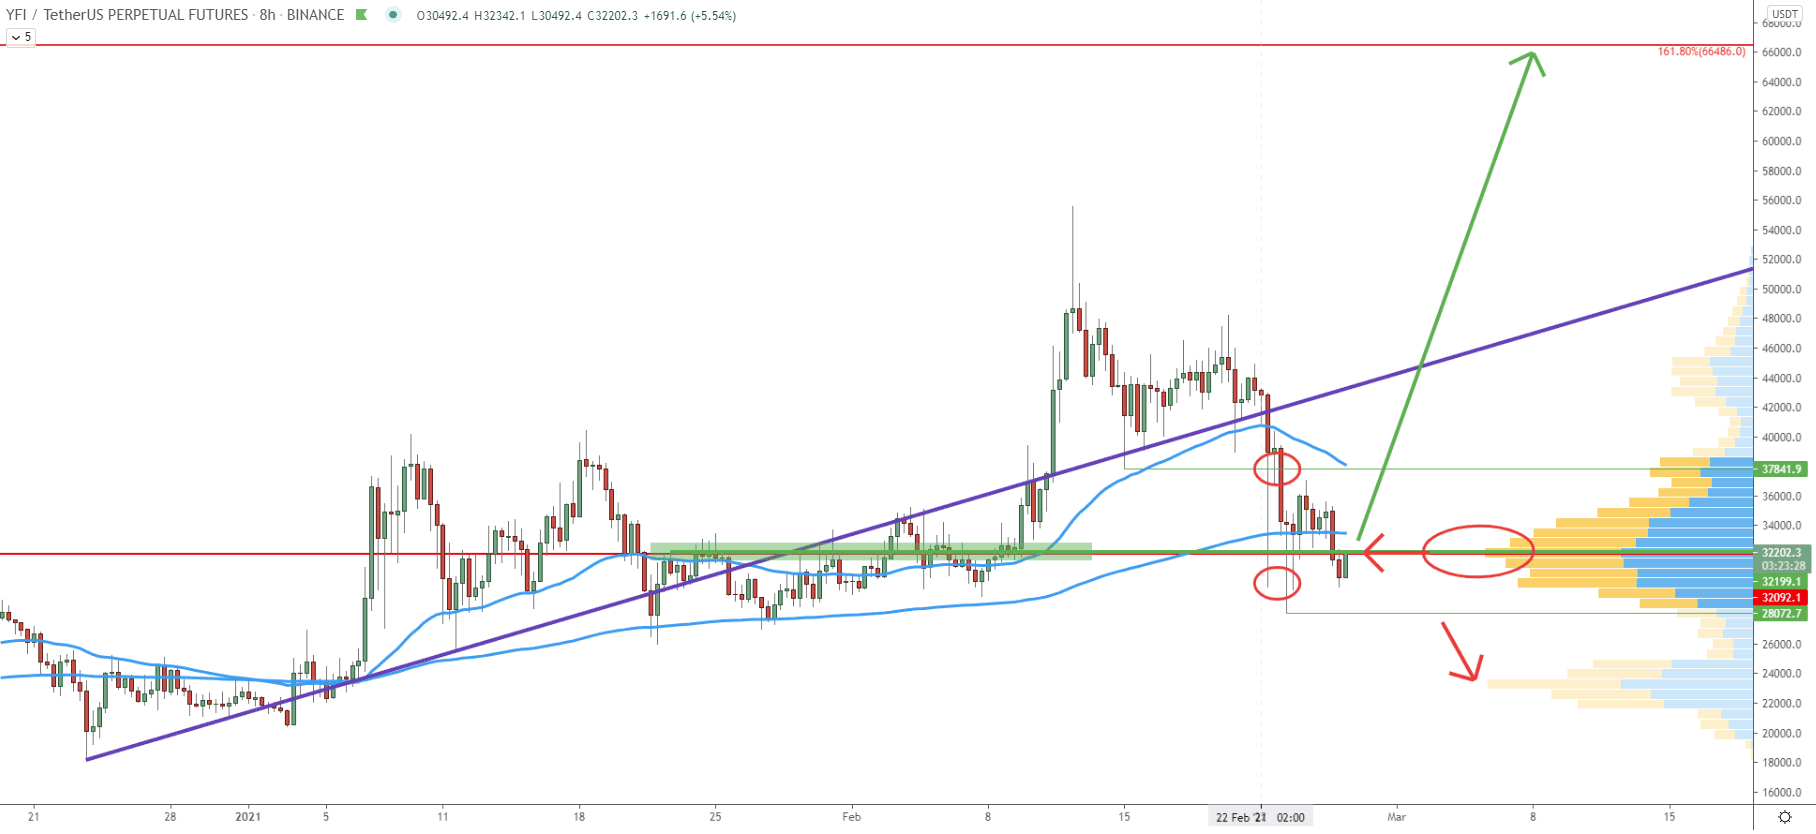
As per the 8-hour chart, the key support is at 28000, and as long as the price remains above this level, YFI/USD long-term uptrend should be expected to continue. However, a break below the 28000, should result in a price decline towards the 23000 support, which is confirmed by the Volume Profile indicator.
Support: 30000, 28000
Resistance: 66500, 103000