Published: August 24th, 2021
This Tuesday, Gold is trading higher above the psychological level of $1800 per ounce. However, the more upside pressure is questionable as the US Food and Drug Administration (FDA) approved the Pfizer/BioNTech vaccine.
In the meantime, the fast-spreading Delta variant may halt the global economic recovery with a possibility of an imminent tapering of asset purchase programs by the Fed. Therefore, investors should closely monitor how the Fed expresses the US economy during the Jackson Hole summit.
Still, there is a lack of indicators to show price direction for XAUUSD. The current market sentiment is towards the clarity of virus conditions and geopolitical concern regarding Afghanistan and China. Currently, Australia’s COVID-19 infection moved lower from the record high while the New Zealand Prime Minister warned about the spread of the Delta variant.
Right now, the calendar is ahead of the speeches from Jackson Hole Symposium that may work as a critical price driver for Gold. Besides, there are multiple US Data’s to release where a better than expected result may put selling pressure on XAUUSD.
Let’s see the upcoming price direction from the XAUUSD technical analysis:
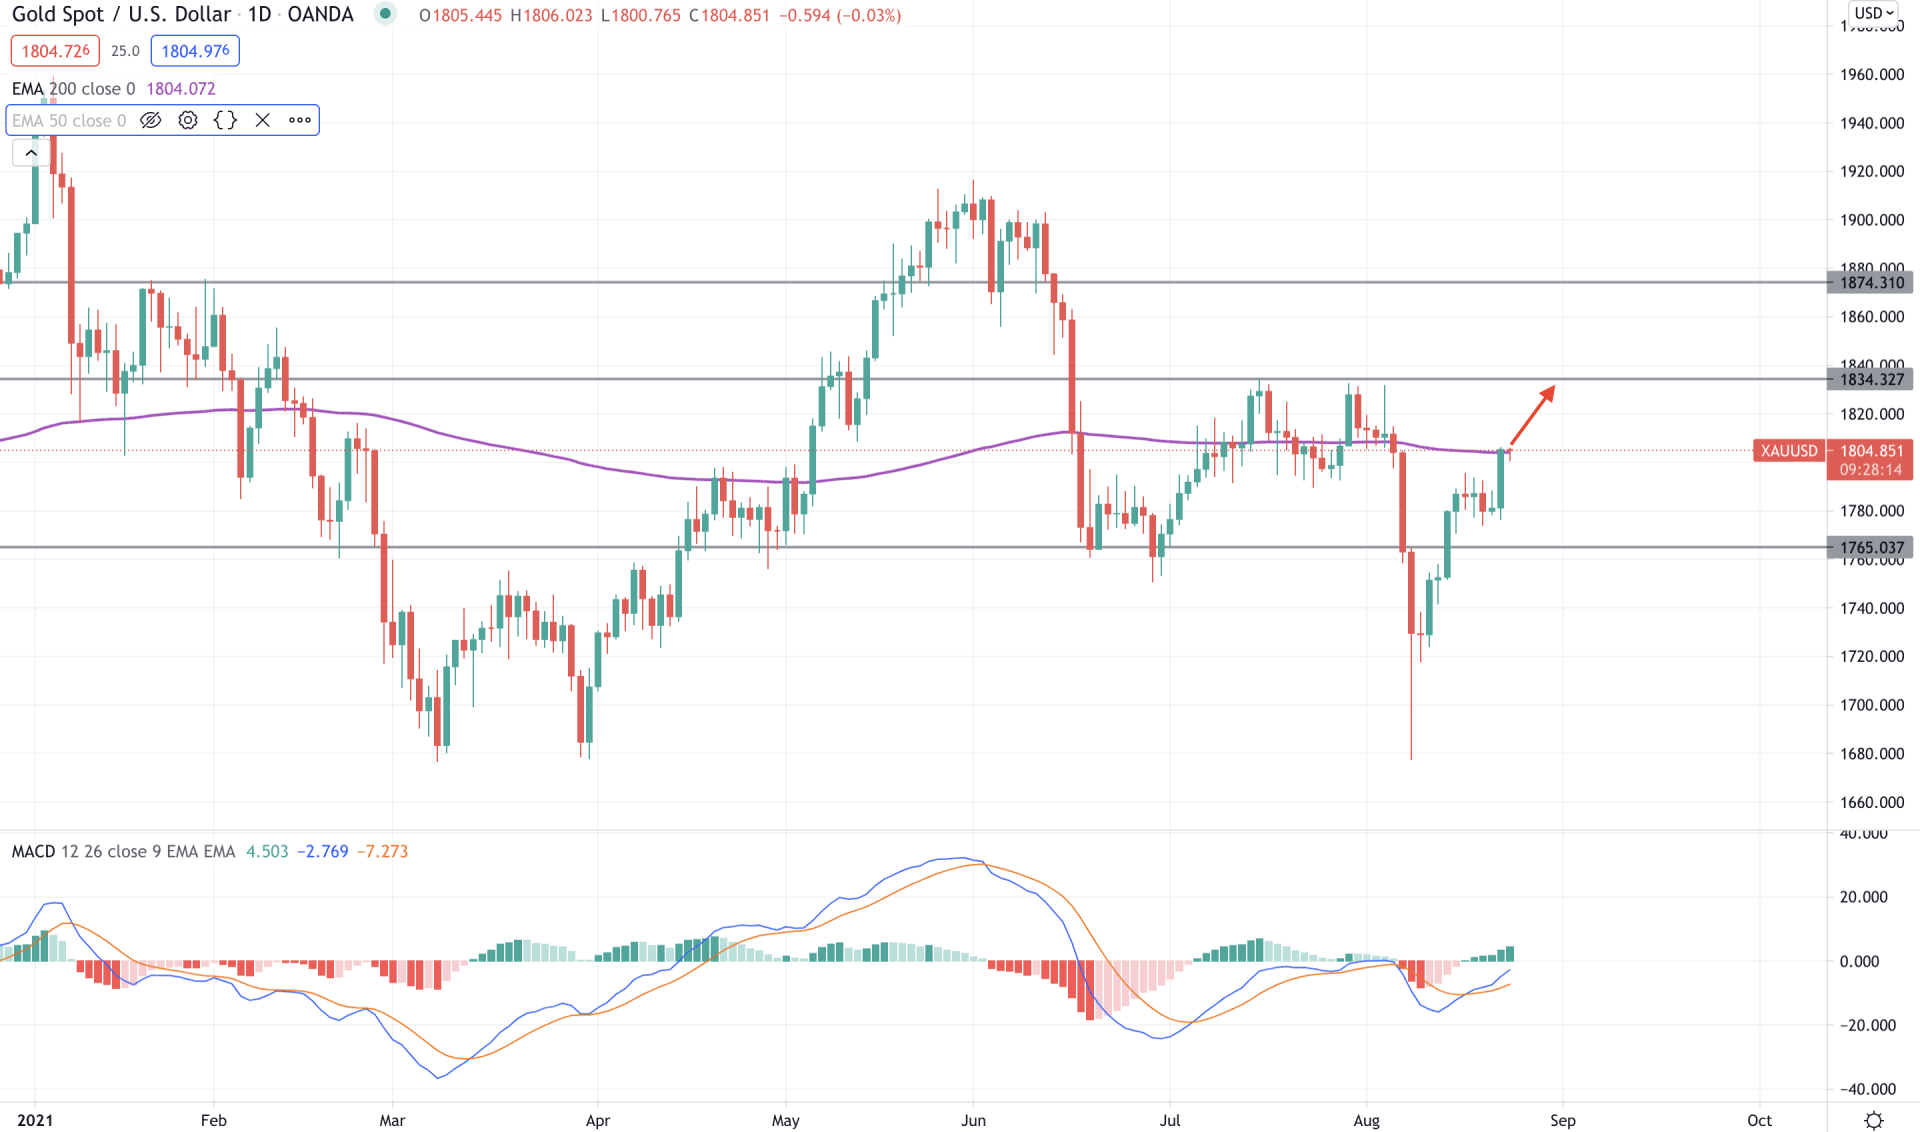
XAUUSD is moving within a lot of volatility where the last few weeks showed a dramatic movement from 1834 resistance to 1678 level. Later on, the price exhausted and moved higher with a stable market recovery and started a correction. This week, the price showed a strong bullish daily candle, breaking above the range and opened room for further bullish pressure. However, the current bullish daily candle is facing resistance from the 200 days EMA, and investors should closely monitor how the price reacts on that level.
The above image shows that the price faces resistance from the 200 days EMA, where the most recent static resistance level is at the 1834.00 area. Therefore, any bullish daily close above the 200 EMA is more likely to extend the bullish pressure above the 1834.00 level.
In the indicator window, MACD Histogram remained bullish and made new highs, indicating that bulls are gaining momentum. Moreover, the buying pressure is supported by the regular divergence formed with the MACD lines. In this context, the buying pressure is valid if a daily candle moves higher above the 200 days EMA. Conversely, a rebound with a bearish close below the 1800 level may become later the current market structure.
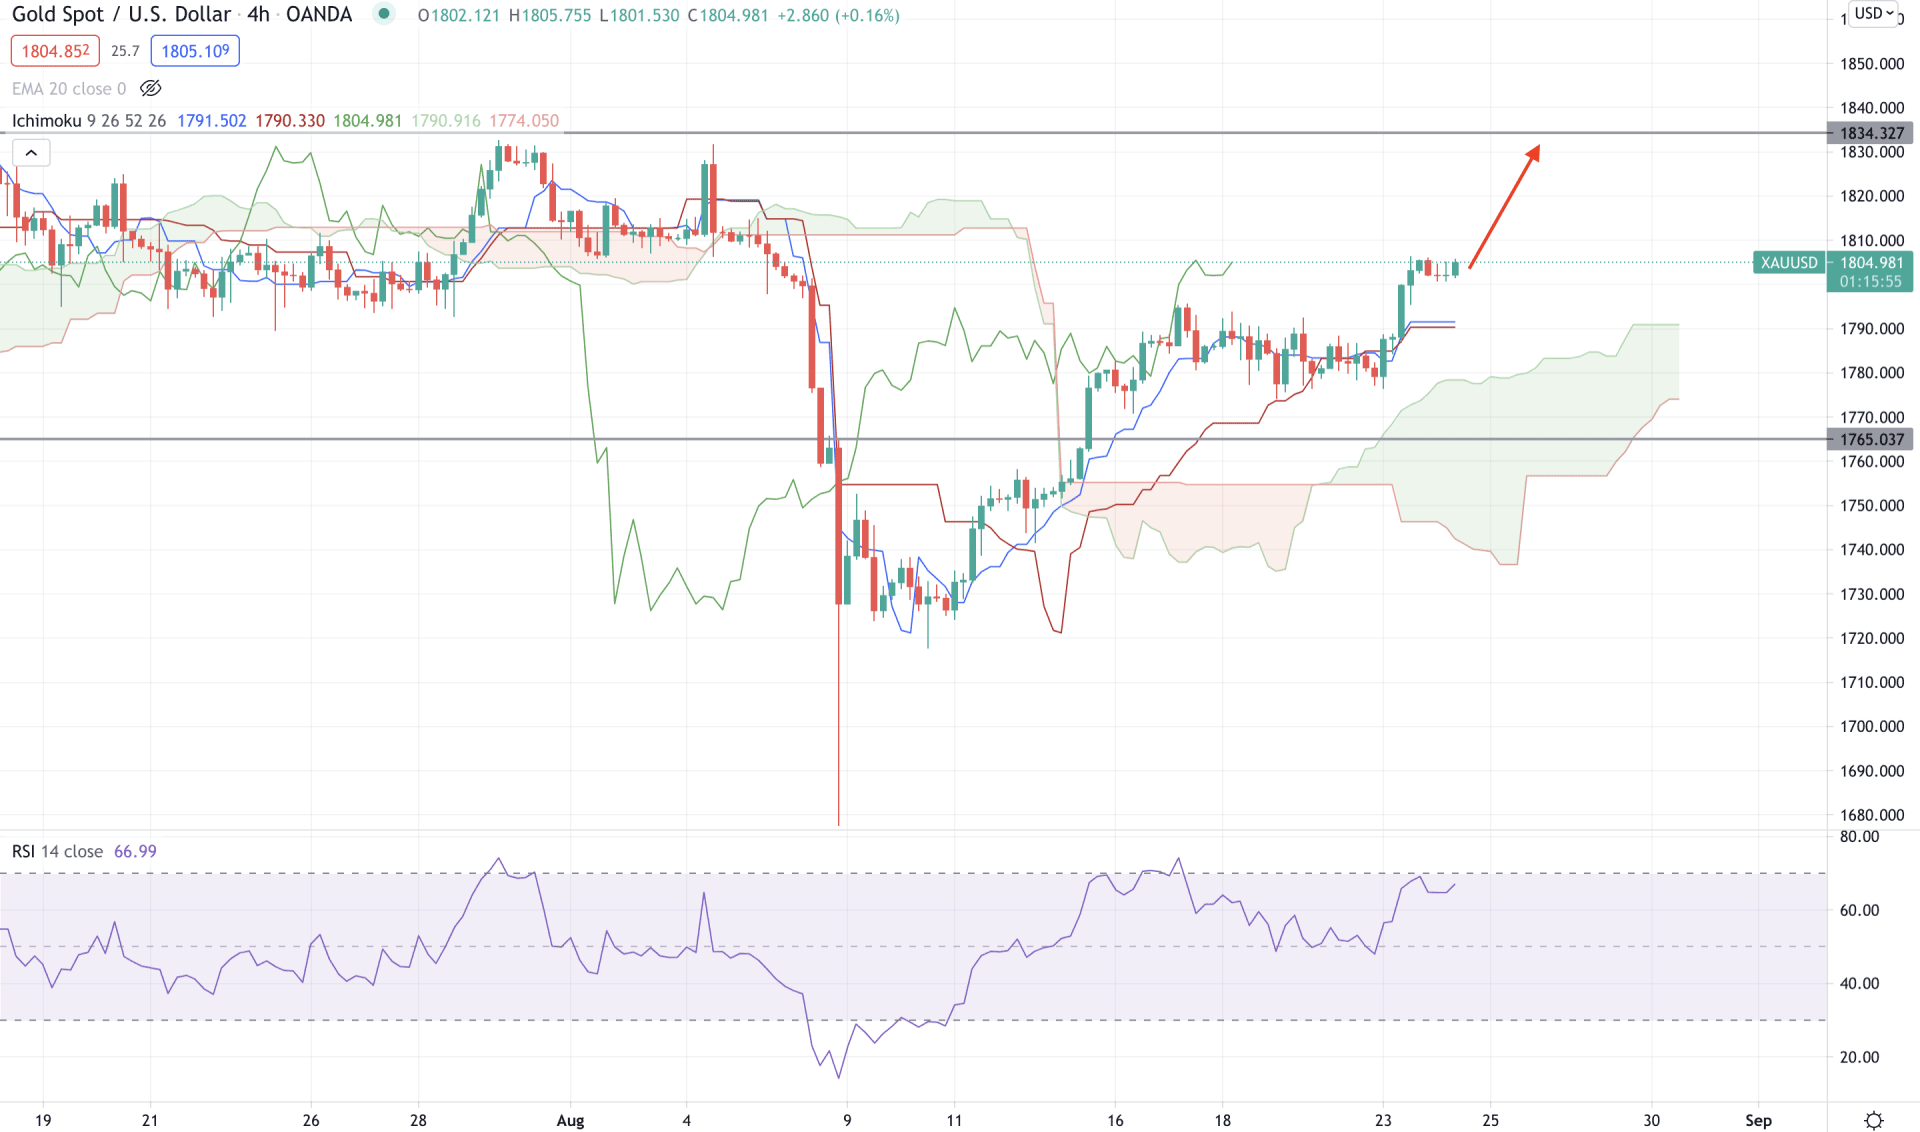
Based on the Ichimoku Kinko Hyo, the overall price action in the H4 chart is bullish as the price moved above the Kumo Cloud with a solid bullish pressure while the future cloud remained bullish. Moreover, Chikou Span or Lagging span is above the price with a bullish crossover in the Tenkan and Kijun lines. The most recent bullish pressure from the Tenkan Sen increased the buying possibility that may extend towards the 1834.00 resistance level in the coming session.
The above image shows the price moving up with a strong bullish trend where Senkou Span A is above Senkou Span B in the future cloud and aiming higher. Moreover, the RSI is showing buying pressure by staying near the overbought level. Therefore, as long as the price is trading above the dynamic Kijun Sen, it may move higher towards the 1834.00 level. Conversely, a bearish H4 close below Senkou Span A may start a broader correction to the price.
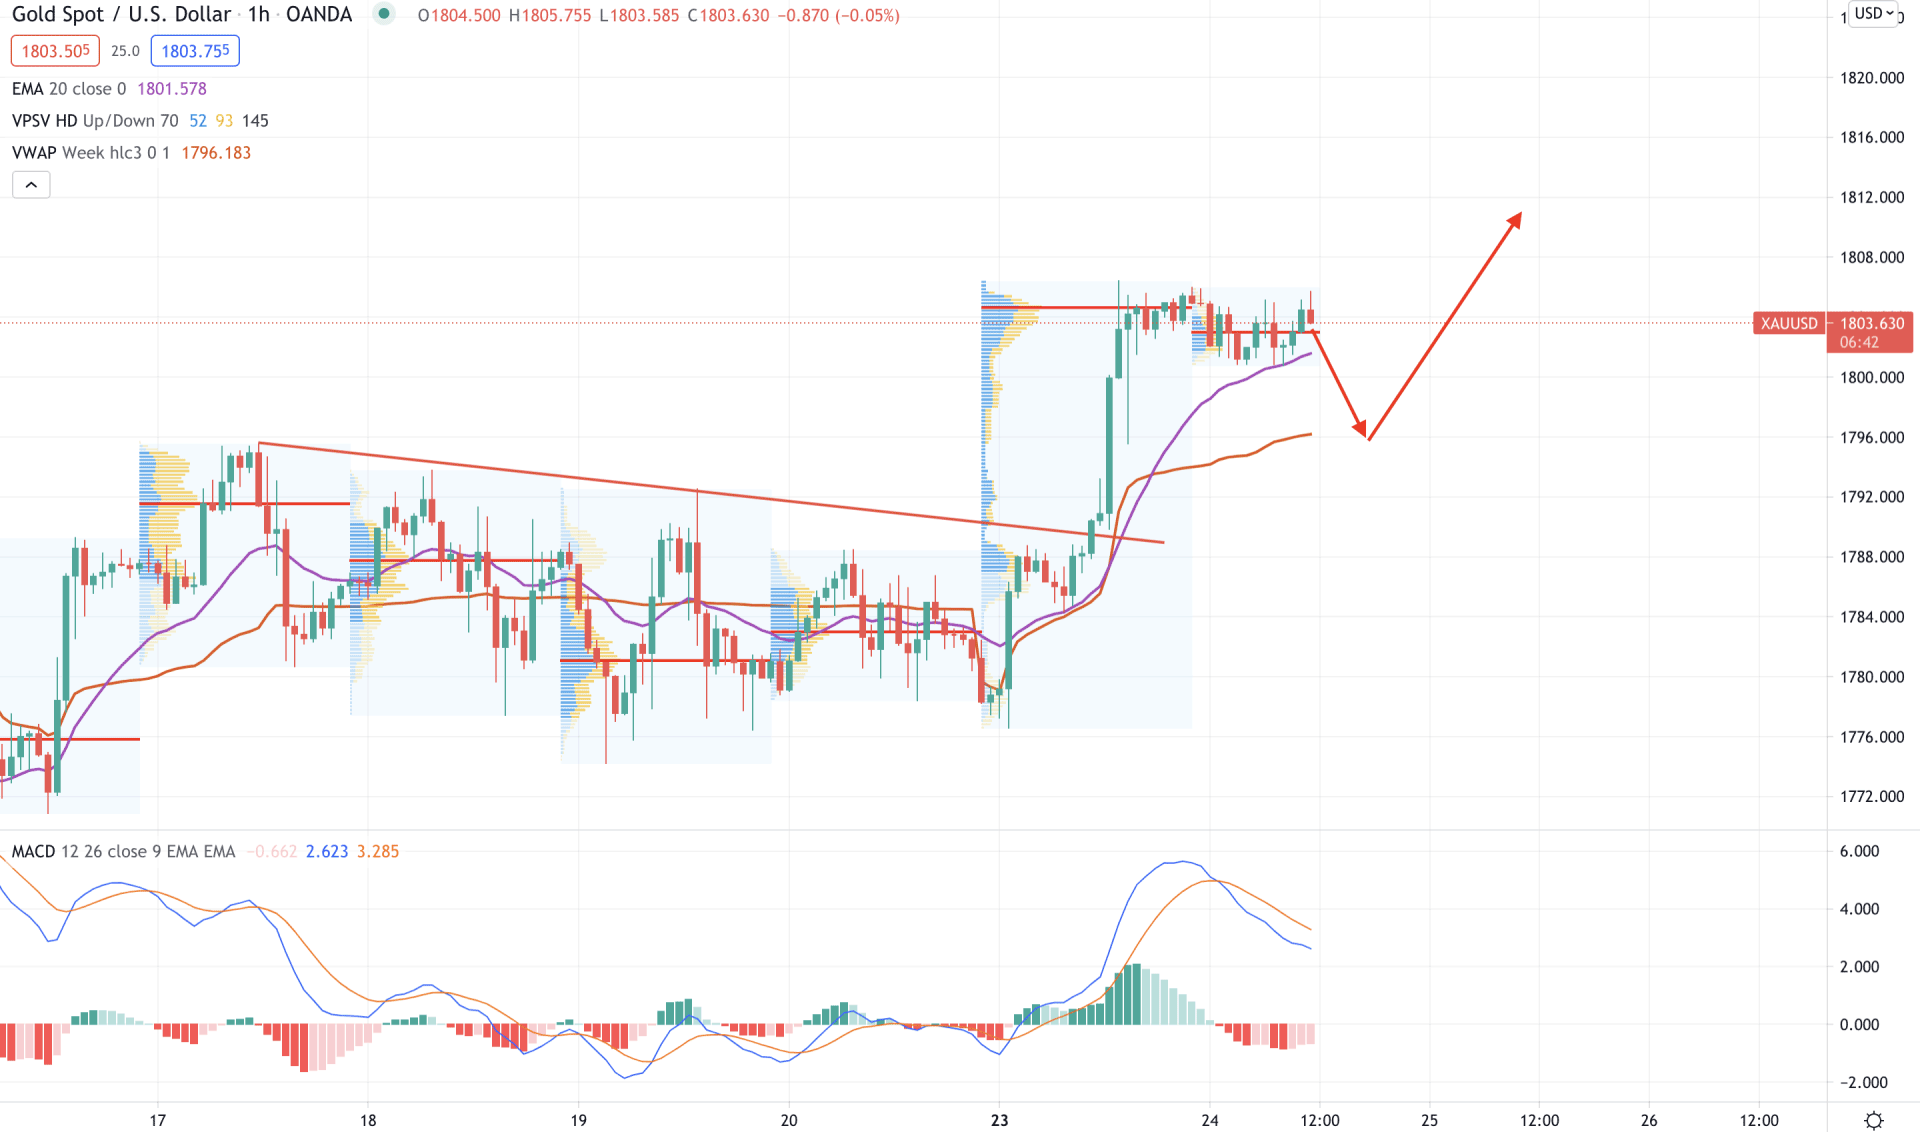
In the intraday chart, XAUUSD became bullish after a trendline breakout and held the buying pressure for two consecutive sessions. The price ranges at the most recent high volume level of 1802, while the dynamic 20 EMA acts as minor support. Therefore, any rebound from dynamic 20 EMA with a bullish H1 close above the 1802 level may create a strong bullish pressure in the price.
The above image shows the price is trading above the dynamic vwap where the gap between the dynamic 20 EMA and vwap was extended. Therefore, the price may show some bearish correction, but the bullish pressure is valid until the price moves below the dynamic vwap with a bearish close.
On the other hand, MACD Histogram is bearish but failed to make new lows. Therefore, if any positive Histogram appears with precise bullish action may boost the buying pressure.
As of the above observation, XAUUSD is more likely to extend the current bullish pressure as long as the price is trading above the dynamic Kijun Sen in the H4 chart.
On the other hand, the price is currently facing resistance from the 200 days moving average, where investors should closely monitor how the price is breaking above this level.