
Published: November 19th, 2020
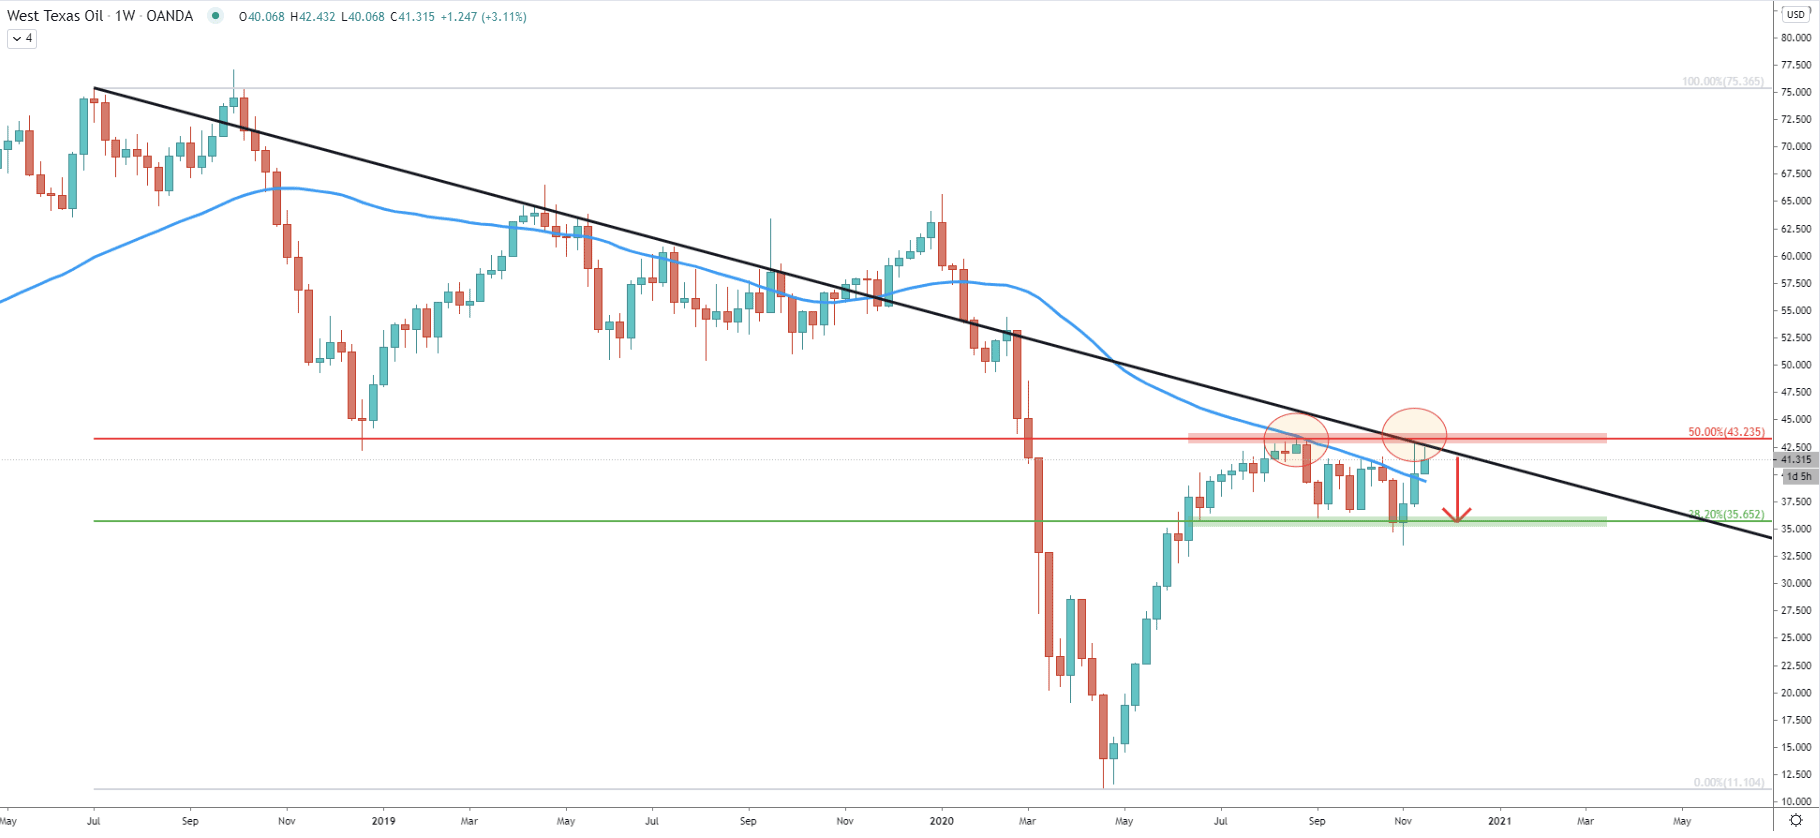
On the weekly chart, USOIL is clearly bearish, as the price continues to produce lower lows and lower highs. During the past few months, WTI has been rejecting one very important resistance level, located at $43.23. This resistance is confirmed by 50% Fibonacci retracement level and it can be seen that there were at least two rejections of it.
First was early September, where along with Fibs, the price bounced off the 200 Exponential Moving Average. The second rejection of that resistance area occurred just recently, this month, where USOIL bounced off the long-term downtrend trendline.
This goes to show, that bears are not letting the price to move higher, which shows ongoing selling pressure. And as long as the resistance holds, WTI is expected to initiate a downside move. The key support is located at $35.62 and is confirmed by 38.2% Fibonacci retracement level, where previously price found the support.
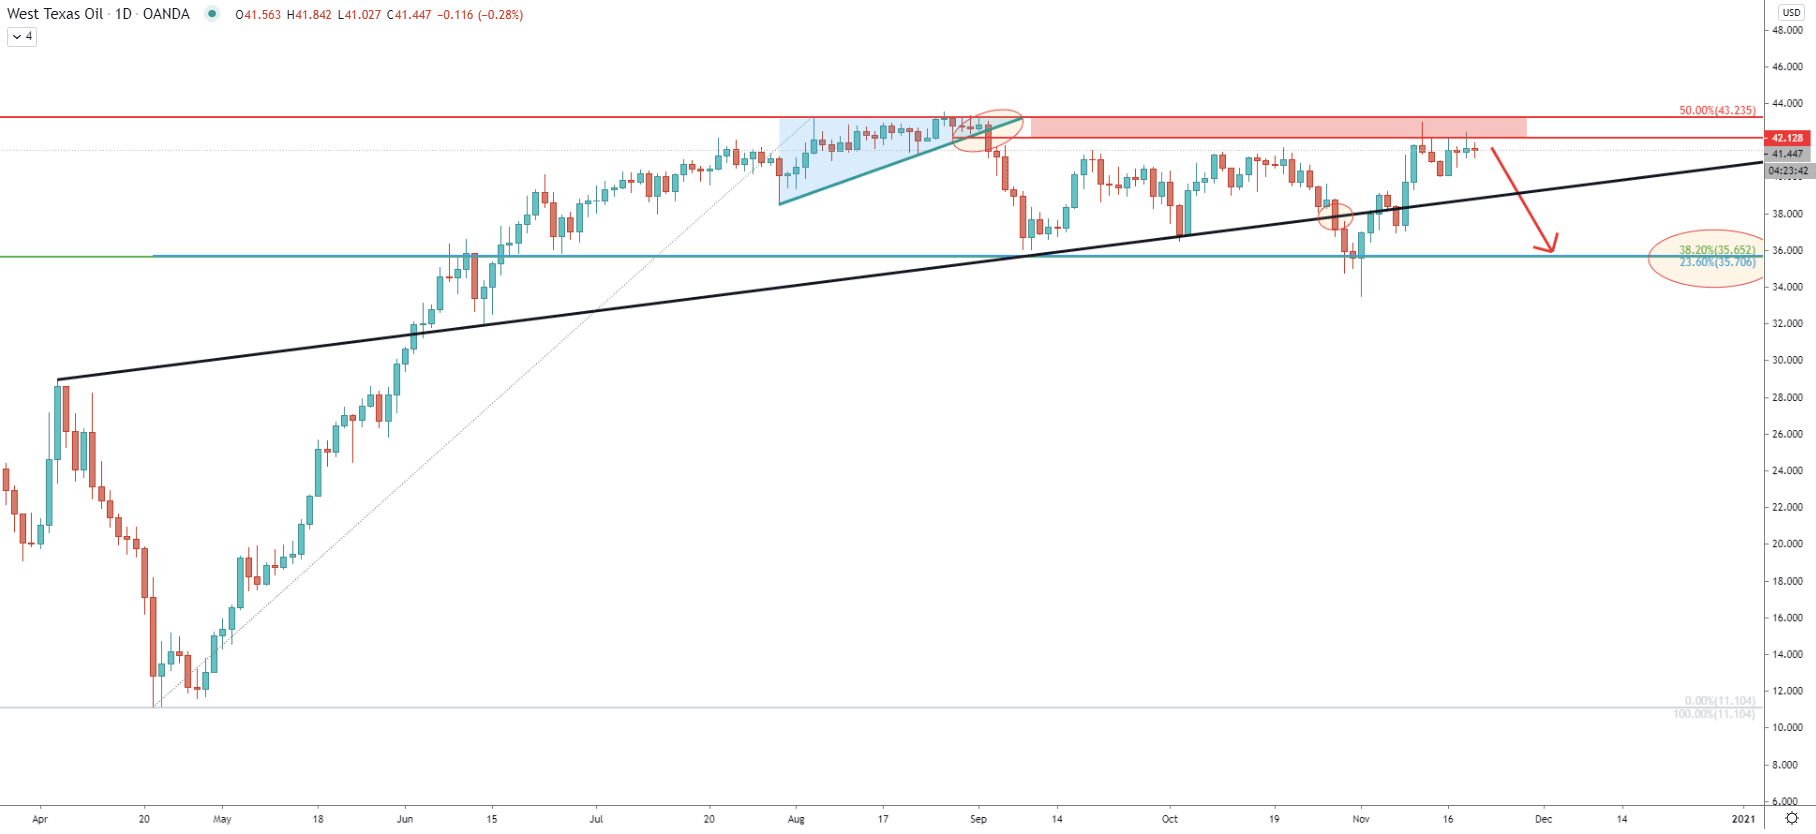
Early September USOIL broke below the triangle pattern, after which it went down strongly. But then, a pullback followed, and during the past 7 trading days, the price has been rejecting the triangle breakout level at $42.12. Obviously, it is now acting as the resistance, forming the supply area between $42.12 and $43.23.
Currently, the selling opportunity could be of interest to bears as it provides a good risk/reward ratio. While the critical resistance level is at $43.23, the key support level is at $35.70, which on this chart is confirmed by two Fibs. The 38.2% as per the weekly chart and 23.6% Fibs applied to the April-September uptrend.
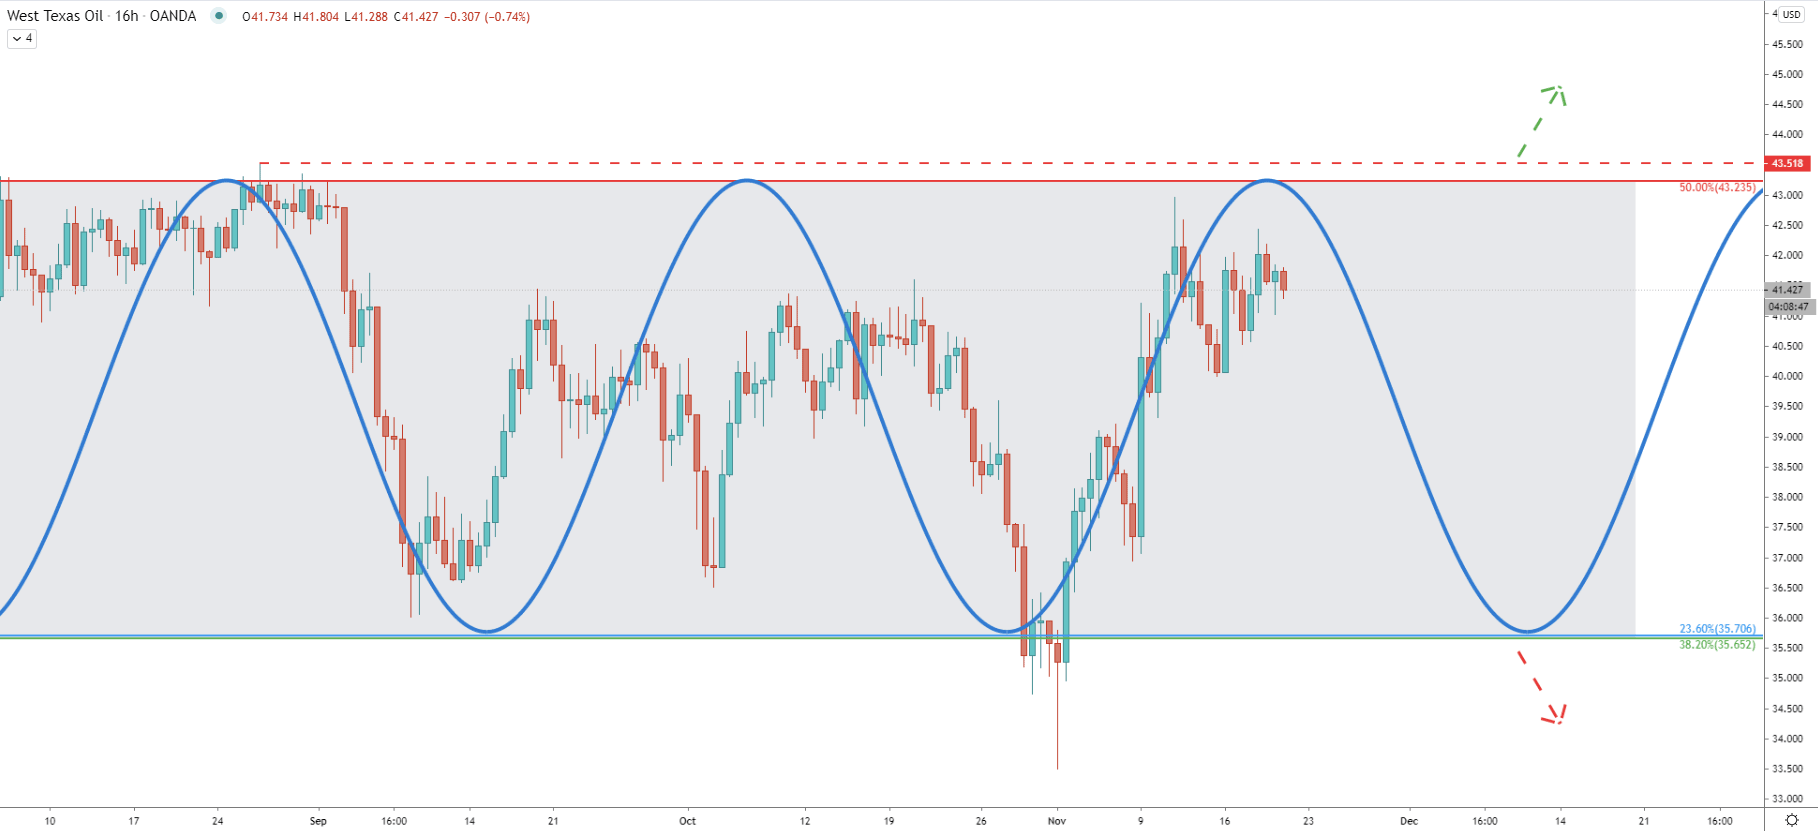
On the 16-hour chart, the rang-trading phase is clearly visible, where the price is stuck between the 35.70 support and 43.50 resistance areas. Currently, it seems like the time has come for yet another bearish cycle. Considering that the price is at the top of the range, a downtrend could start at any time. But for the bearish forecast to remain valid, the price must stay below $43.50. In regards to the downside potential, if/when $35.70 support will get broken to the downside, this could be the confirmation of a long term downtrend continuation, in which case the selling pressure should increase substantially.
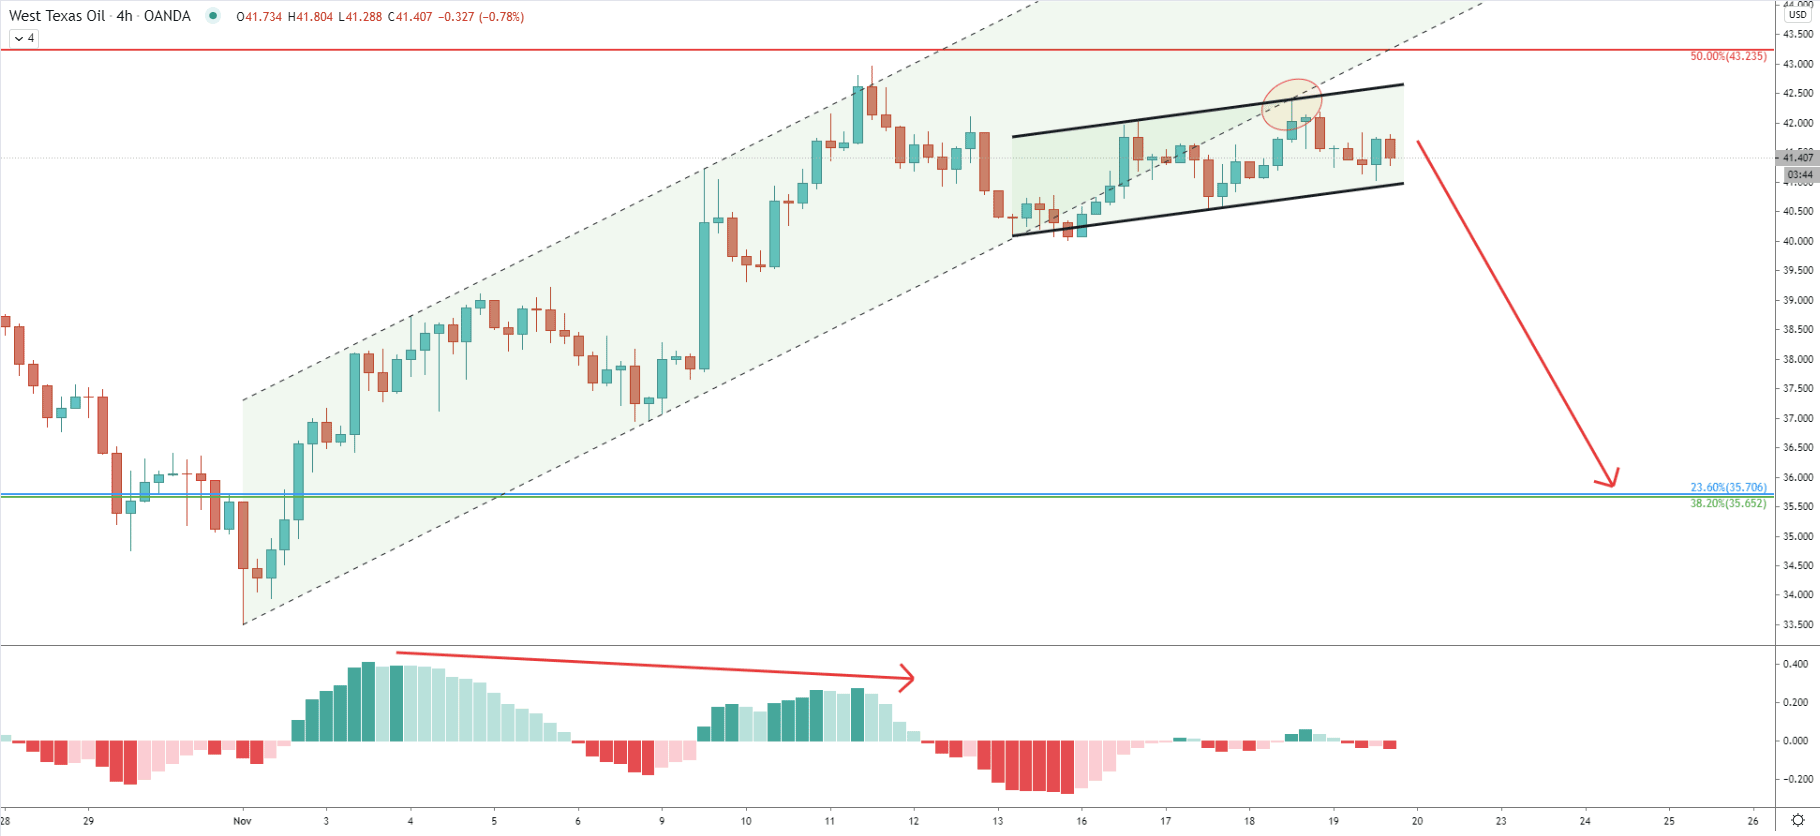
Since the beginning of November, USOIL has been moving within the ascending channel. On November 13, after MACD formed a bearish divergence, there was an attempt to break below the channel, although it failed. But looking at the most recent price action, WTI has rejected the top of a small ascending channel, along with the lower trendline of the big descending channel. Perhaps now sellers are waiting for the break below either big or small channels, and potentially both of them.
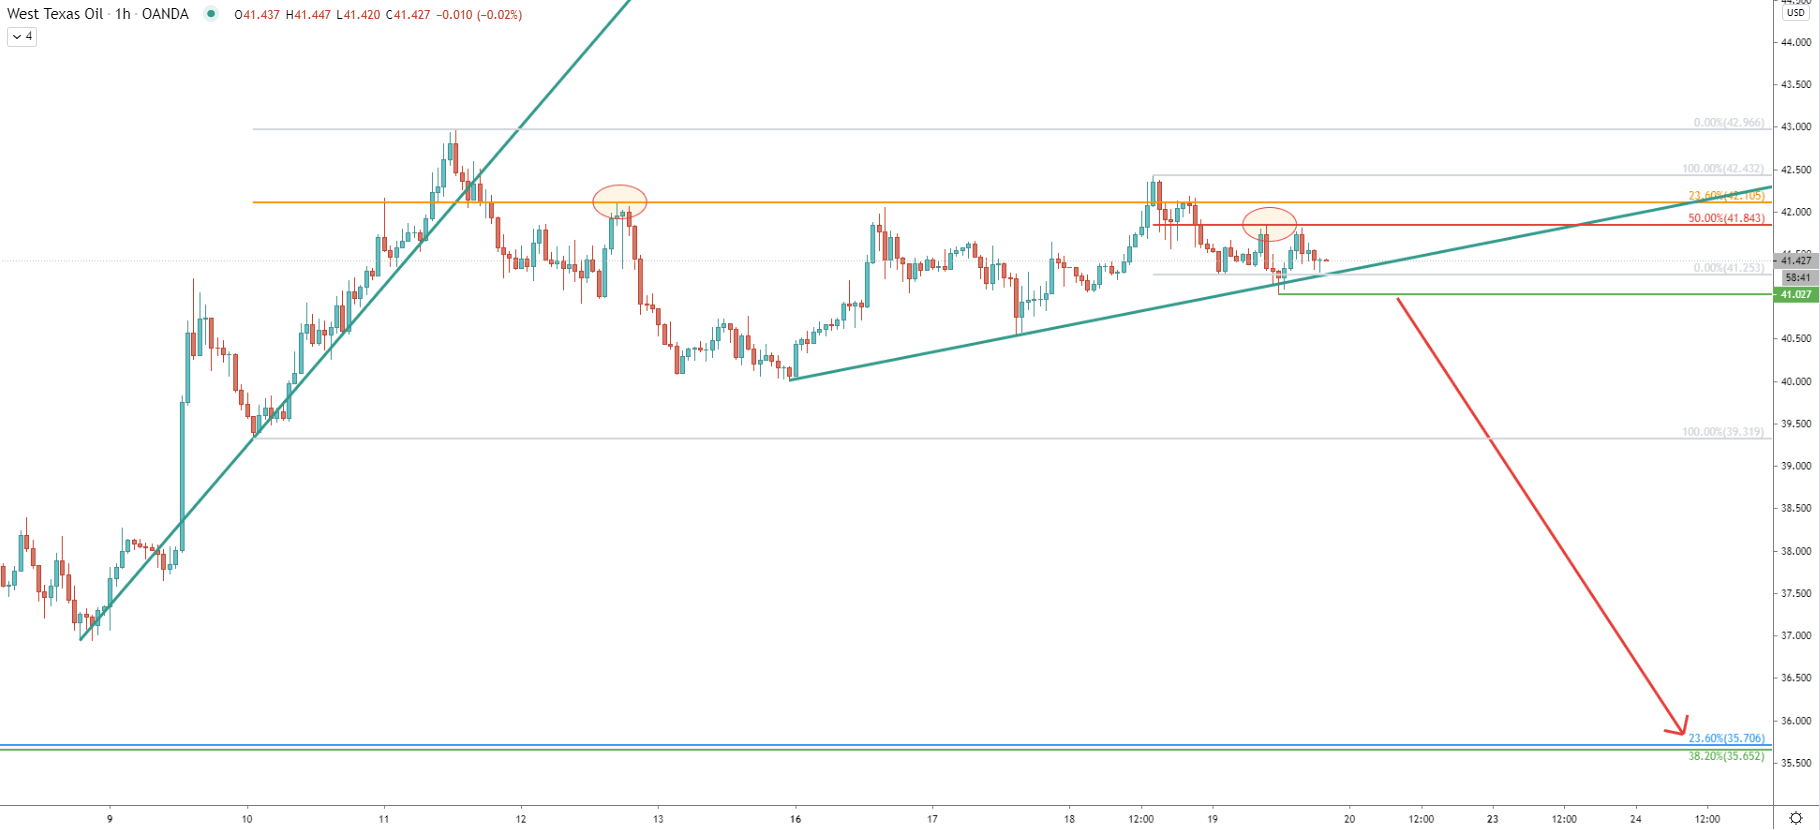
On the hourly timeframe, the uptrend trendline has been rejected up until this point. And along with the ascending channel, sellers are likely to wait for the break and close below the uptrend trendline. Therefore, $41.00 psychological support is now the key support to watch this week, while the 4-hour and/or daily close below should confirm the downtrend.
USOIL’s long-term trend is heavily bearish and recent price action shows that sellers are defending the $43.00 resistance area. On the other hand, there is minor support at $41.00, and when/if it gets broken, the price could decline as low as the $37.50 support area.
The critical medium-term support is located at $35.70 which is confirmed by 3 different Fibonacci retracement levels as well as the previous supply zone.
As per the 16-hour chart, the price is undergoing the consolidation phase. But if the resistance at $43.50 will get penetrated, with the daily close above, the bearish forecast will be invalidated. Then, and only then USOIL can be expected to rise further.
Support: 41.00, 39.31, 35.70
Resistance: 41.84, 42.10, 43.25, 43.51