
Published: June 12th, 2020
We’ve shared multiple analyses of AUD currency pairs. They all are in favor of a weak Australian Dollar in the short and medium-term. While some AUD pairs, such as AUD/JPY, has already corrected down strongly, some, like AUD/CAD, are still consolidating at the top. We all know that what goes up, must come down, and obviously this can be applied to the financial markets. Every rally ends at some point and perhaps this point has been reached by AUD/CAD. Let’s analyze multiple timeframes to have a clear picture as to what can be expected from this pair next week.
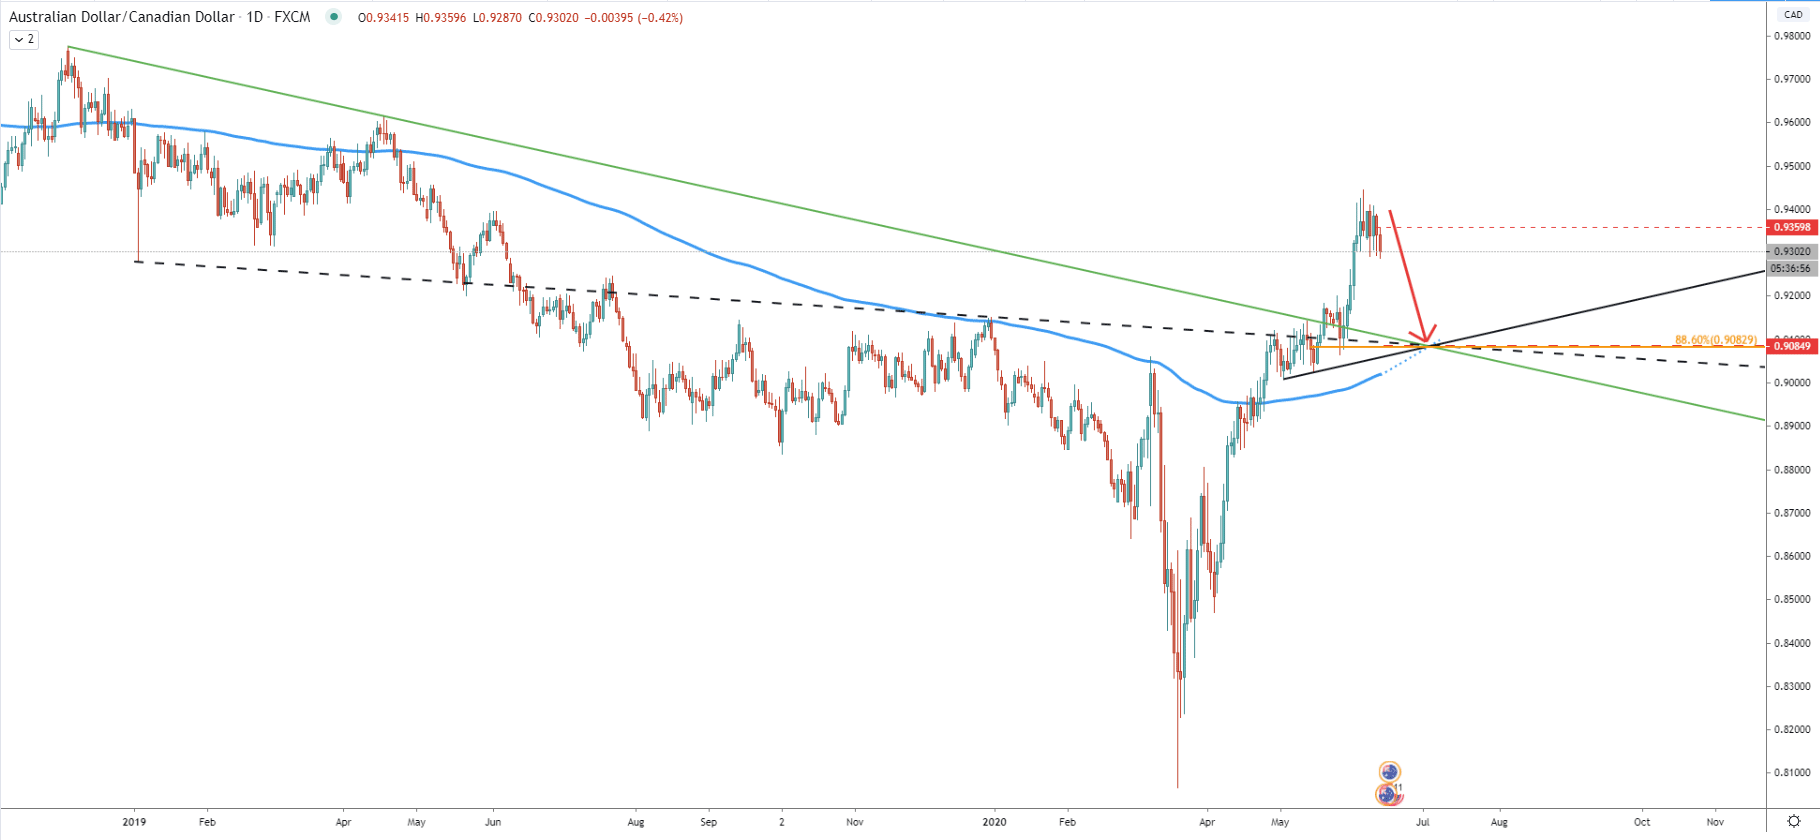
It is always best to look at a daily timeframe to get the big picture and only then move on to smaller timeframes. On the AUD/CAD daily chart the price has tested the top at 0.9444 on June 5. After that price has been consolidating between 0.9300 support and 0.9400 resistance areas.
The 100 pips range trading has been going on for the past 7 trading days, and perhaps it’s time to finally make a move. This move can be expected to aim south and the reason for this will be explained more when we go through other charts. AUD/CAD could now be aiming at 88.6% Fibonacci retracement level, which is 0.9083 level. This level corresponds to multiple indicators, such as downtrend trendline, average price trendline, and the uptrend trendline crossings. At the same time, it corresponds to the 200 Simple Moving Average, making it an extremely strong level of support.
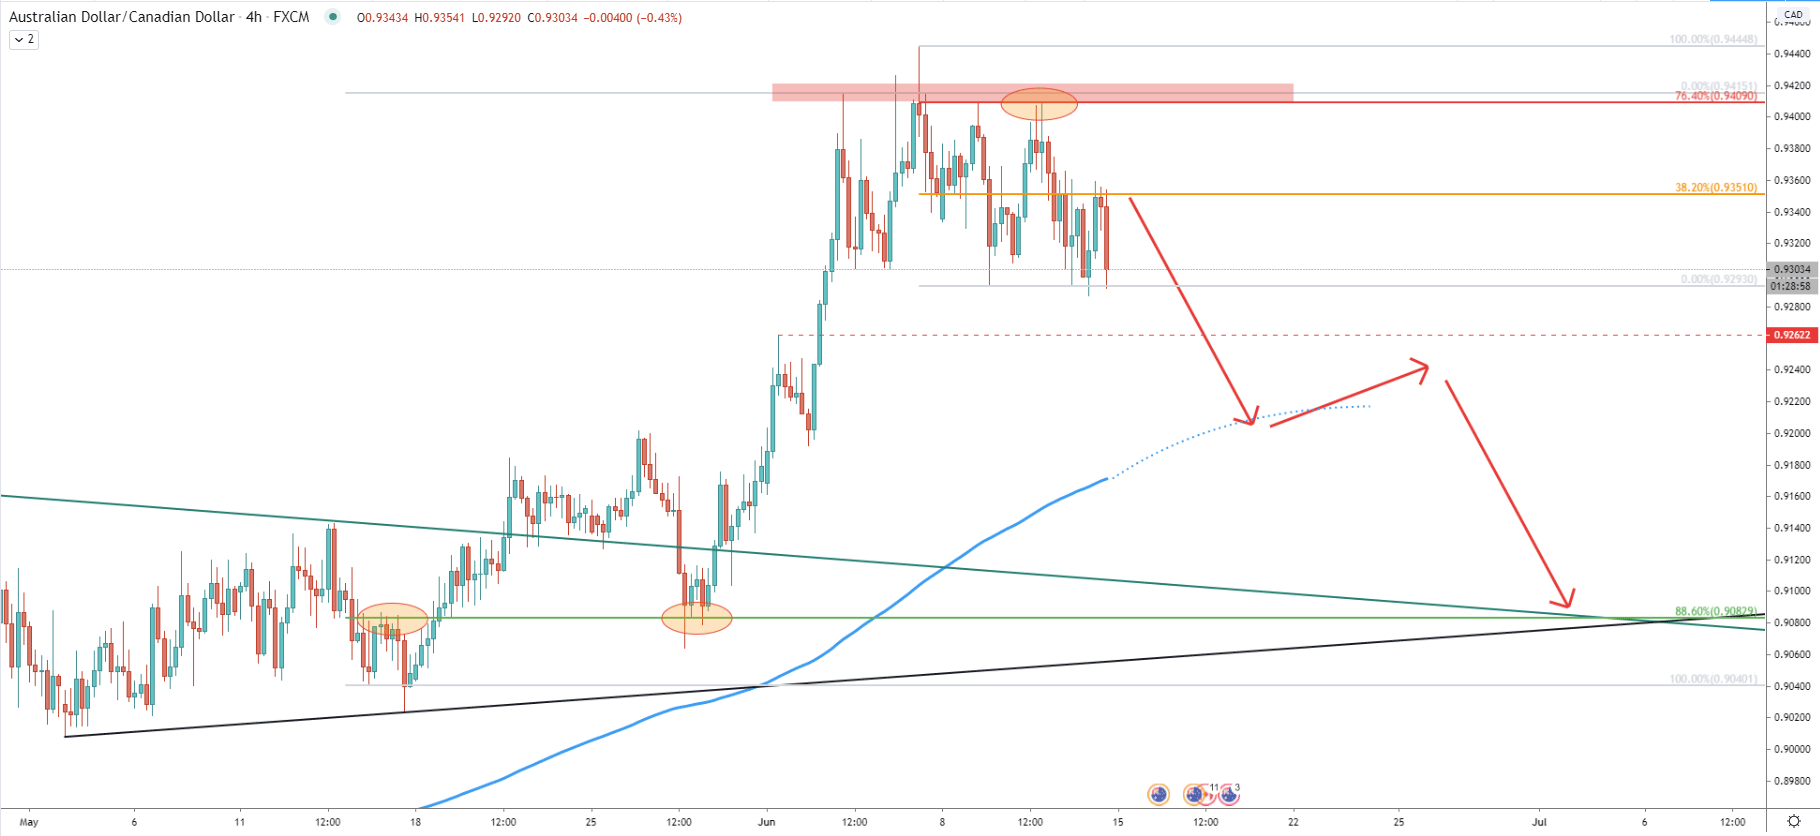
Fibonacci used to determine the potential downside target, was applied from the point of the last rejection of the uptrend trendline to the June 03 high, because there was no break and close above this level throughout all the consolidation phase. When AUD/CAD started to produce a new lower low, upon correction up, it has cleanly bounced off the 76.4% Fibonacci retracement at 0.9409, after which produced yet another lower low. The most recent bounce was off the 38.2% Fibs at 0.9351, and this can result in the beginning of a stronger downside correction.
The upcoming wave down might send price towards the 200 EMA support, which is likely to be broken at some point. Then, a short consolidation can be expected, before/if AUD/CAD will produce the final move south.
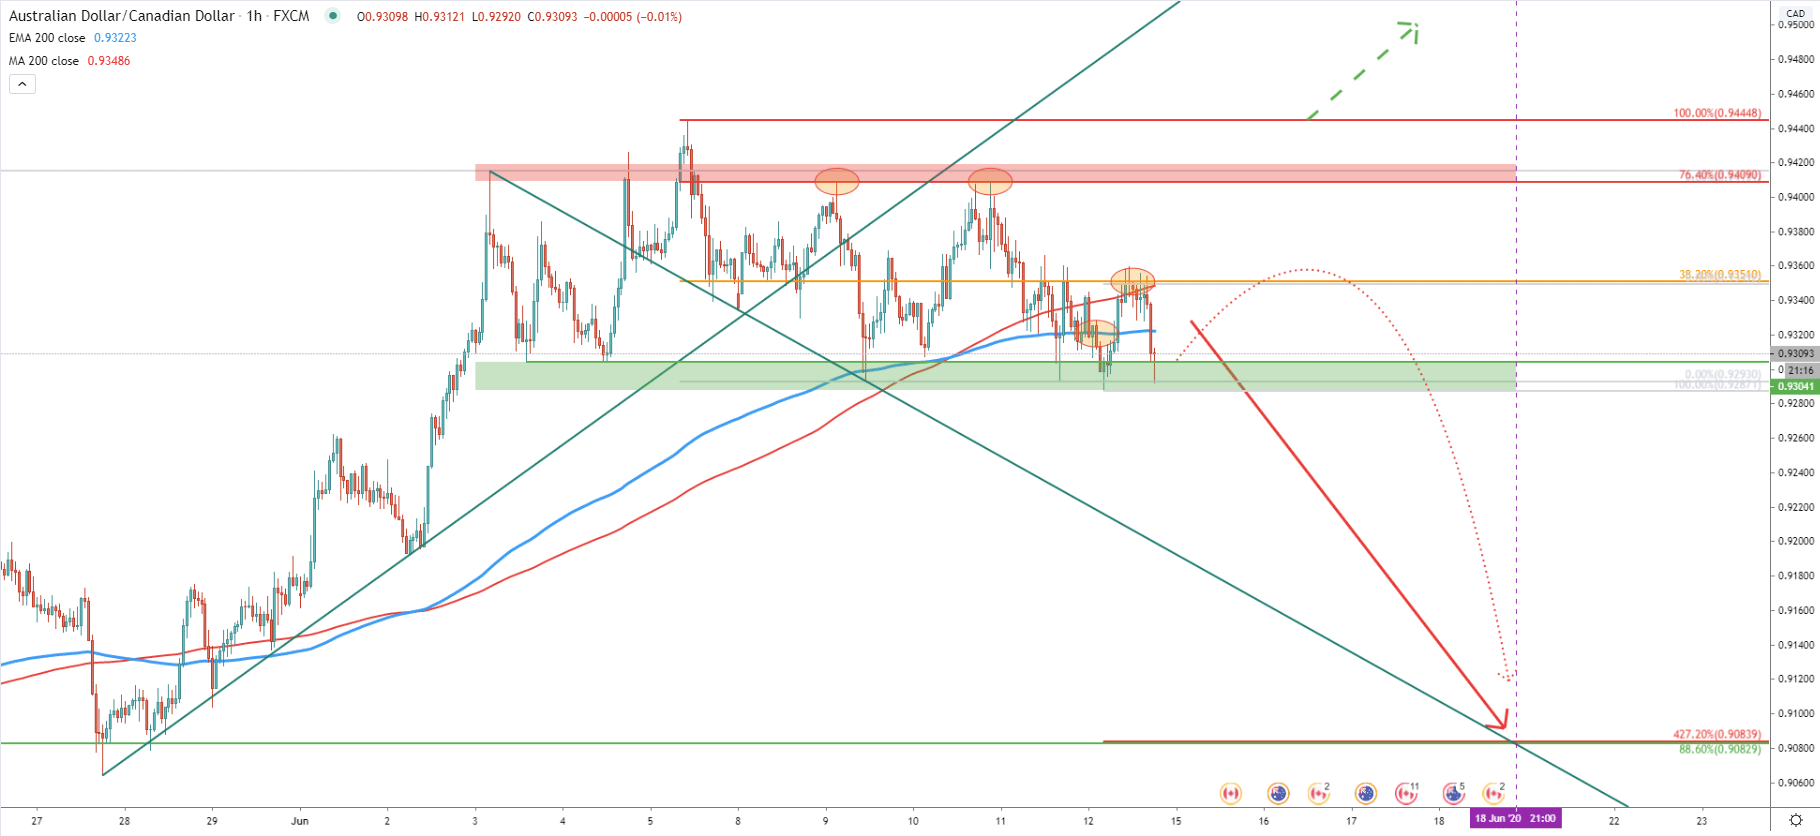
On the 1-hour chart, the consolidation area becomes more obvious, and it is clearly visible how AUD/CAD was rejecting the 0.9309 support and 0.9409 resistance levels. But one pattern is clear, that price is producing lower lows and lower highs. Besides, recently price broke below the 200 Simple and exponential Moving Averages, and today 200 SMA was acting as the resistance which was rejected.
But still, AUD/CAD remains at the support area, which must be broken in order to confirm the downside move. Today we might witness more consolidation and the stronger downside move could be initiated only on Monday. Therefore, the small upside correction back to the 0.9350 resistance area can also be expected, and it could provide a perfect selling opportunity for bears. But at the same time, it might be an ongoing steady downtrend, and the most important thing to do is to wait for the break below the support area and obviously below the 0.9300 psychological level.
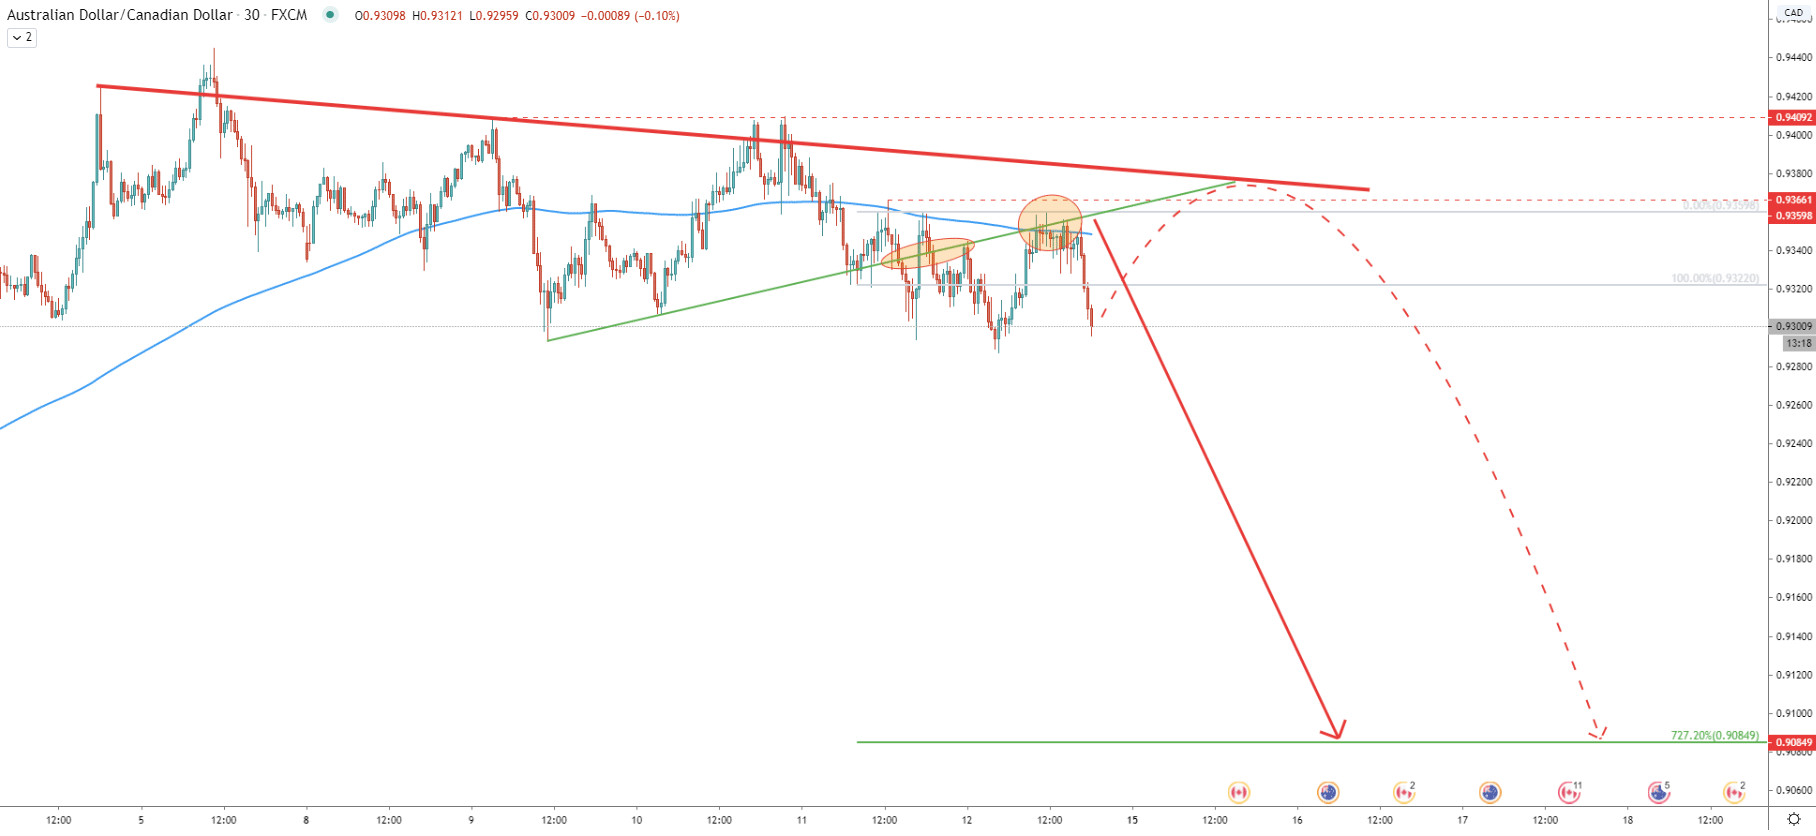
On the 30-minute chart, AUD/CAD remains below the downtrend trendline, while it broke below the uptrend trendline. Fibonacci was applied to the corrective wave up, where 200 EMA was rejected after the price went below the uptrend trendline. What is interesting, is that 727.2% Fibonacci retracement level, cleanly corresponds to the previously mentioned support level at 0.9083.
While the downtrend can be anticipated, correction to the upside can be expected too, especially if the price remains above the 0.9300 level. And maybe the ideal selling opportunity could only be presented upon another rejection of the downtrend trendline.
Most AUD currency pairs are starting to move against the Australian Dollar, which means that AUD will be the driver of AUD/CAD. Friday is not the best time to trade, especially to avoid keeping the trade open over the weekend. Therefore, bears might be waiting for the price action after Monday open and will look for any small price pullbacks to find the ideal selling spot.
As per the Daily, hourly, and 30m charts, there are 4 different Fibonacci retracement levels, all pointing to one downside target at 0.9083. This is over 200 pips potential downside move, which might take just several trading days.
As can be seen on the 1-hour chart, the price topped out at 0.9444. Only the break above this level might invalidate bearish outlook, and then the price could slowly continue trending up. Although considering the current price action, this scenario is highly unlikely at this point in time.
Support: 0.9309, 0.9304, 0.9083
Resistance: 0.9350, 0.6409, 0.9444