
Published: December 2nd, 2020
Bitcoin has been going through a major rally during the past three months. Price went up from $9825 to $19888, which has resulted in a 102% growth. This was an amazing move by BTC/USDT, similar to the one that occurred back in2017. But many probably wonder, will the uptrend continue, or will there be a strong correction down. Let’s dive into this question and see what technical analysis tells us.
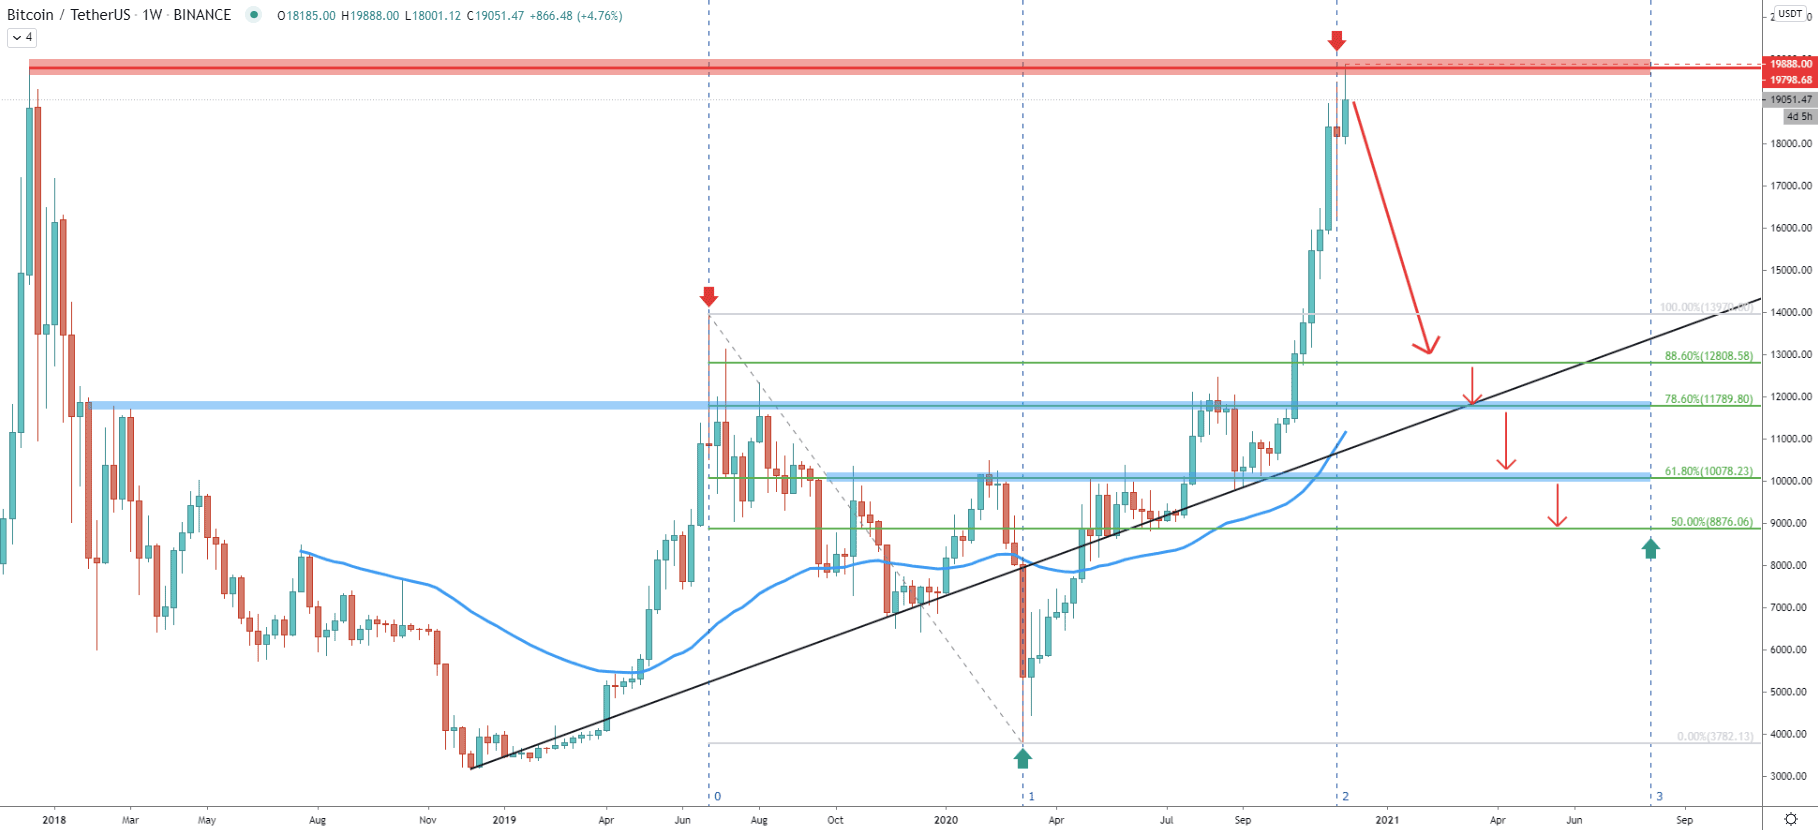
On the weekly chart, it is clear that price has reached and so far rejected the previous all-time high near $20000. This, of course, is a major obstacle for the BTC, which certainly can attract sellers. Based on the Fibonacci cycles, Bitcoin has just entered a new cycle, which could be either bullish or bearish. But as long as the resistance holds, either a correction or a range trading can be expected.
In the case of the correction, the price might move down substantially, but 50% or more. This is because of the potential targets, which are located at $12808, $11789, $10078, and $8876. Perhaps the $11789 is the most important support level since it corresponds to the previous supply areas as well as the uptrend trendline. If a correction down will take place, it might take nearly a year for the BTC to continue a long term uptrend. Nonetheless, the correction hasn’t’ been confirmed yet, and for this, let’s move to a lower timeframe analysis.
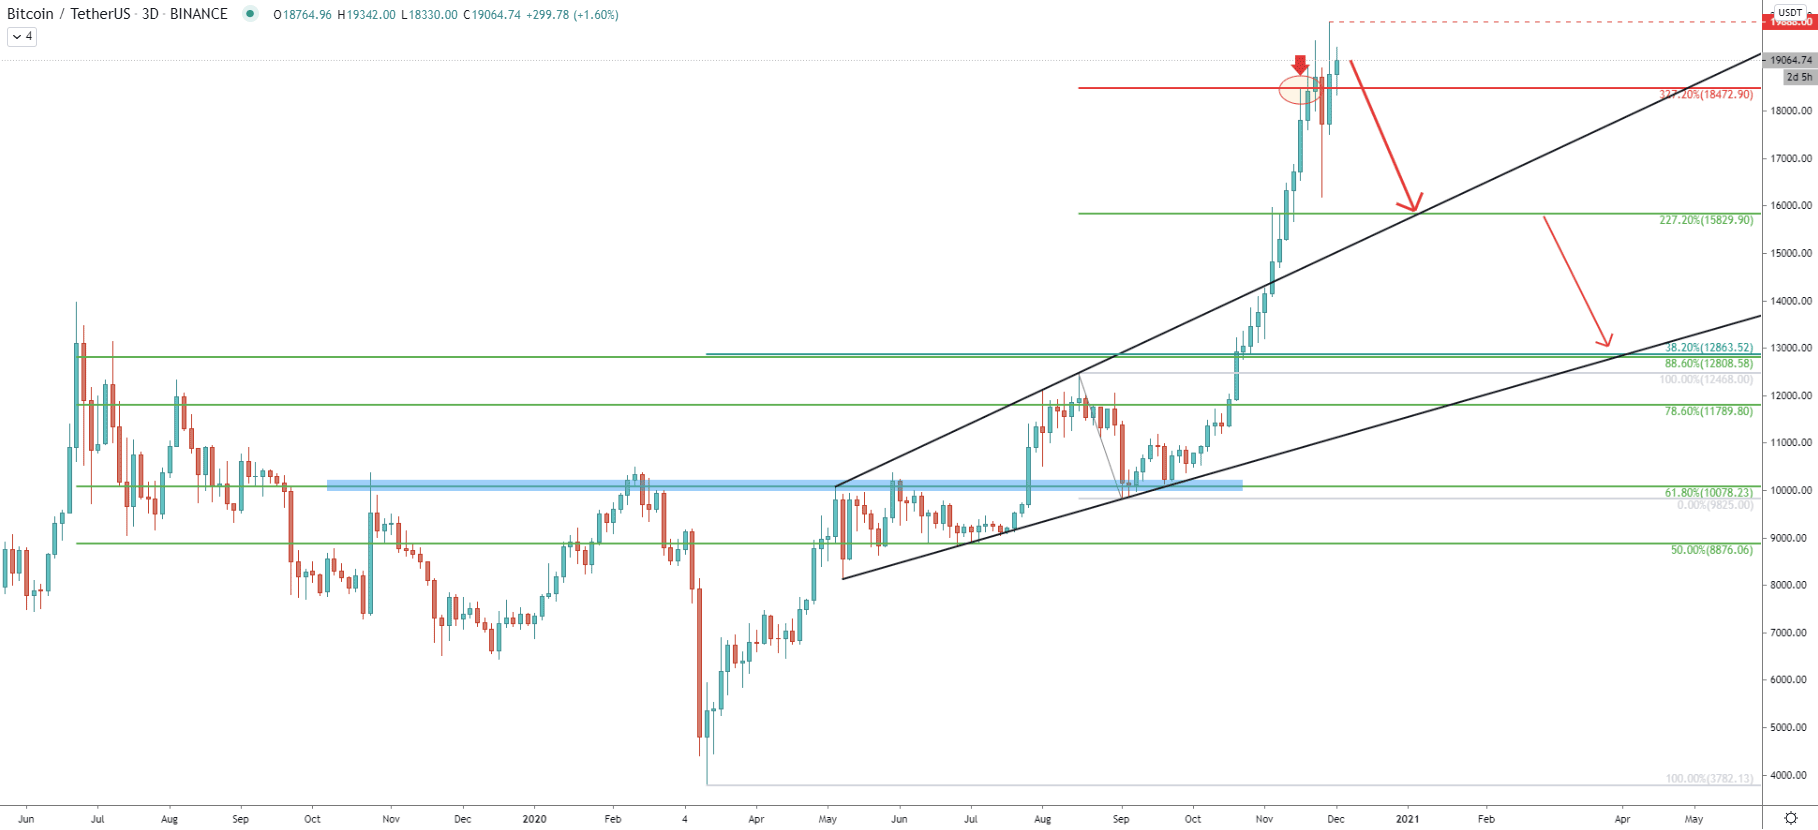
On the 3-day chart, it can be seen that the 327.2% Fibonacci retracement level has been rejected. This Fibs was applied to the corrective wave down after the price broke above the key resistance at $10000. After the rejection of the $18472 level, there were several spikes produced above that price, reaching $19888 high, although no clear break above has been established. This might imply that BTC has good chances to correct down, but only as long as daily and/or weekly closing price will remain below the recently produce high.
The nearest support, confirmed by 227.2% Fibs as well as the support trendline is based at $15829. If this support gets broken, the next strong demand area is located near $12800, which is confirmed by 38.2%, 88.6% Fibs, and the uptrend trenldine.
But what will happen if the current high will be broken? Most probably the uptrend will continue, with might take the BTC/USDT price as high as the $22875 resistance level. This resistance is confirmed by two Fibs, 261.8% and 527.2% retracement levels.
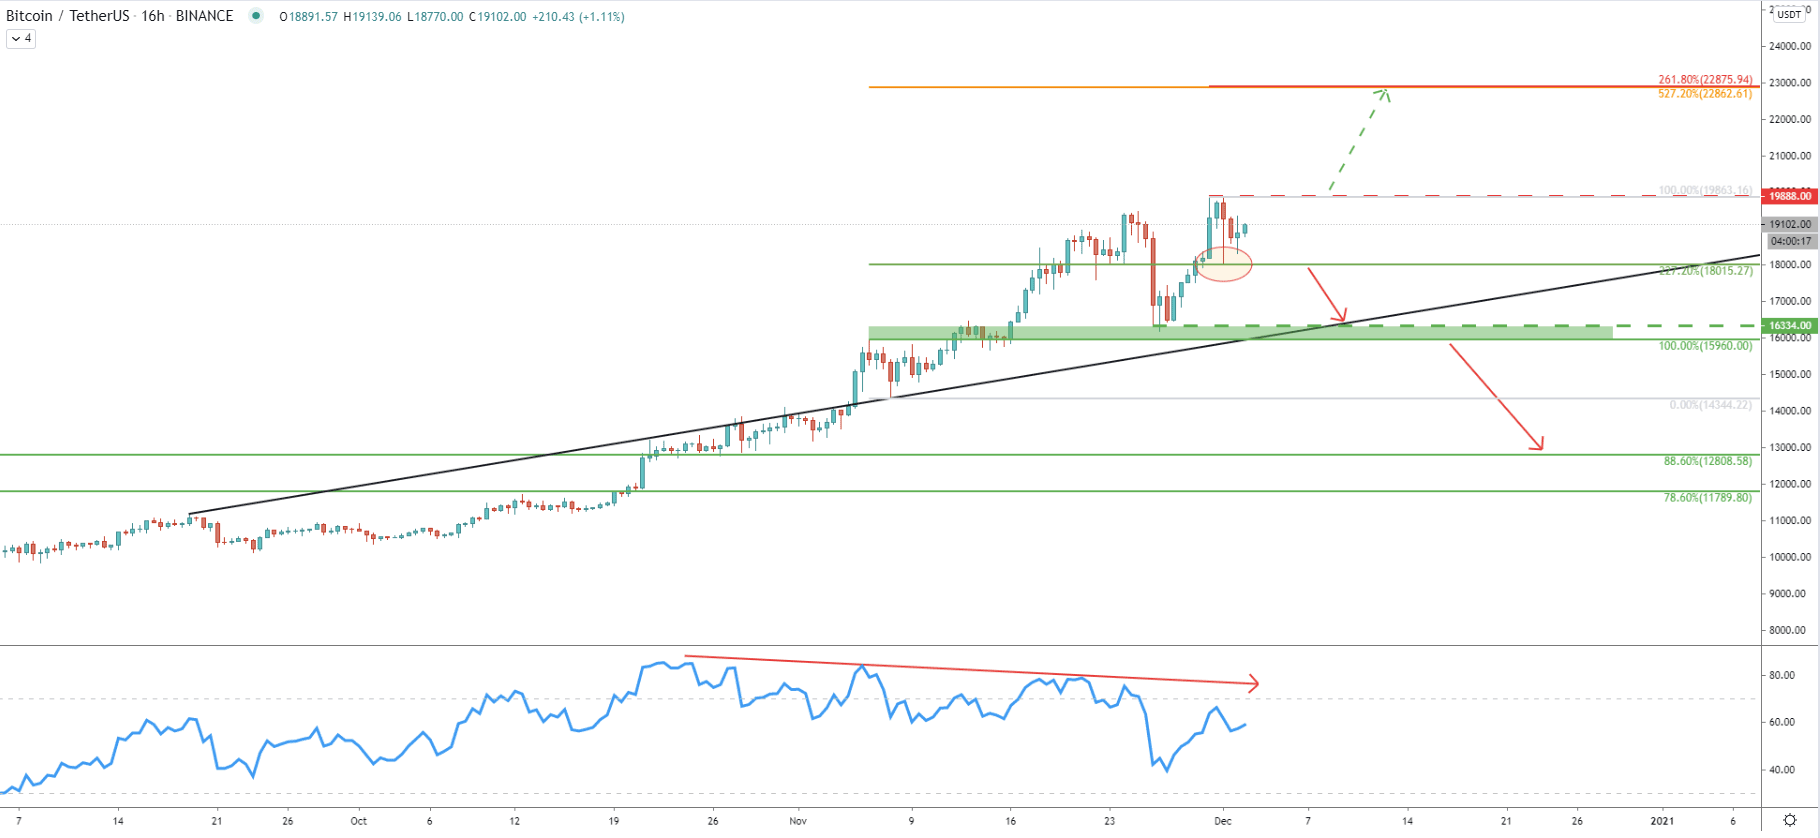
Yesterday, BTC cleanly rejected the 227.2% Fibs at $18015, which shows that buyers remain in complete control. And as long as the price remains above this support and below $19888 high, consolidation is likely to take place. Although considering that RSI has formed a bearish divergence, the probability is slightly in favor of the downside correction, at least towards the $16000 support area.
On this chart, the range trading area can be clearly seen, where the price is likely to stay for some time. But break to the upside must be watched because it will confirm the uptrend continuation. On the other hand, a break below $18000 support should reduce buying pressure, confirming either the beginning of consolidation or a strong downside correction.
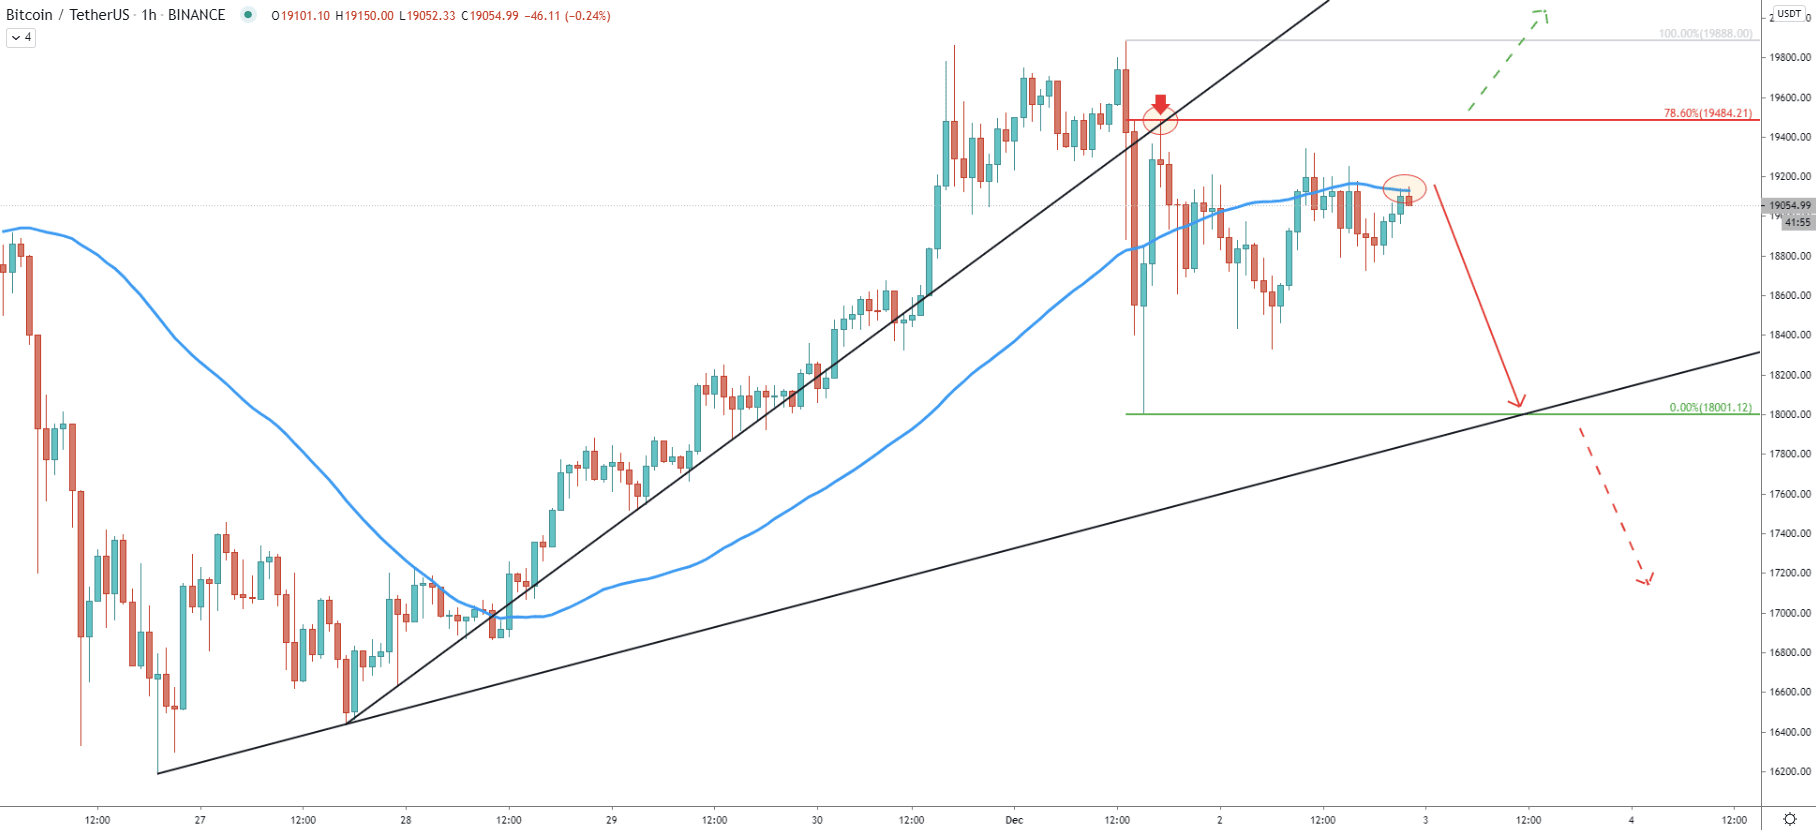
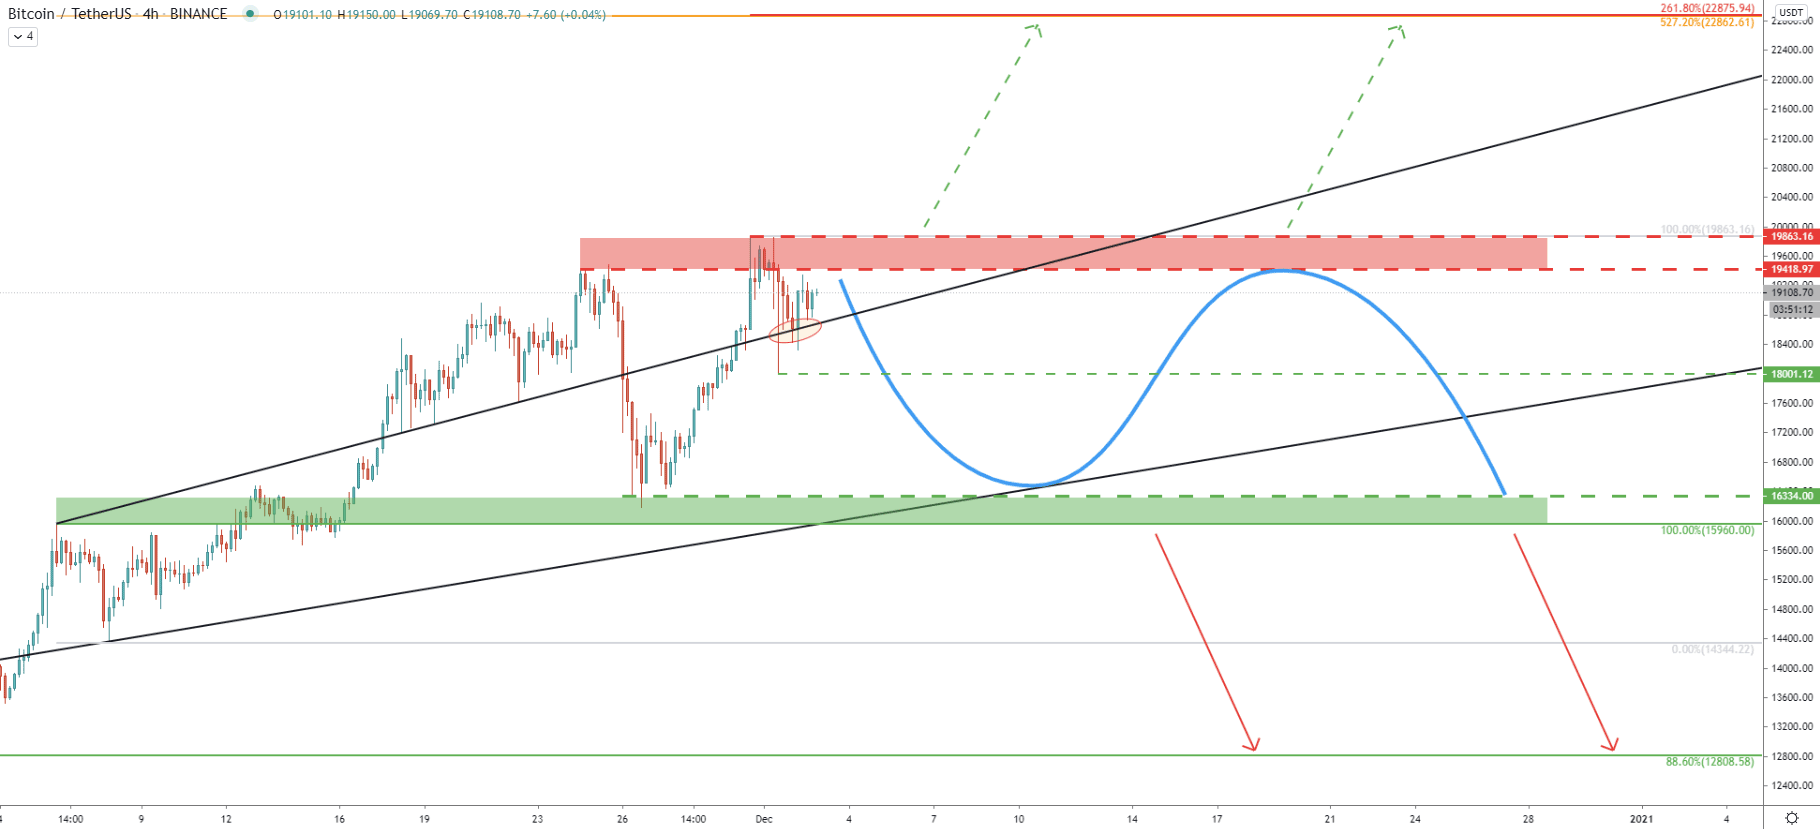
After Bitcoin has reached the $19888 high, it went down sharply, breaking below the uptrend trendline and 50 Exponential Moving Average. On the pullback, there was a very clean bounce off the 78.6% Fibonacci retracement level, which is at $19484. This could be the first sign of BTC’s weakness against the USDT and considering that 50 EMA is being rejected right now, the bullish domination could be starting to weakening.
If EMA will continue to be rejected, BTC/USDT should at the very least test the recently produced low at $18000, which is a strong psychological support corresponding to the simple uptrend trenldine.
Bitcoin has approached the previously formed all-time high, where selling pressure will remain high for the time being. It is not that clear as to which direction BTC will choose in the short term, and for this reason price breakouts are needed, either to the upside or to the downside.
As per the weekly chart, there are 4 long term support levels, which are $12808, $11789, $10078, and $8876. However, the nearest support is located at $18000, and certainly, it will be of great interest to buyers. Only daily break and close below $18000 might send price lower, towards $12k or $10k demand areaa
Daily and/or weekly break and close above $19888, should confirm a further uptrend, where the price is likely to test $22800 resistance area, as can be seen on the 4-hour and 16-hour chart.
Support: $18015, $15960, $12808, $11789, $10078, $8876
Resistance: $19484, $19888