Published: March 30th, 2020
VeChain is a Chinese coin that aims to track any product through the blockchain. It allows a manufacturer to add sensors to their products and have all records on it stored on the blockchain. Considering that China is the world’s largest manufacturer, VeChain can be considered as real use-case cryptocurrency with huge potential in the long term. Currently, it is ranked #36 on the Coin Market Cap, with a total capitalization of $165,031,899.
Now let’s have a look at the long term price action of the VET/USDT and analyze the Weekly chart.
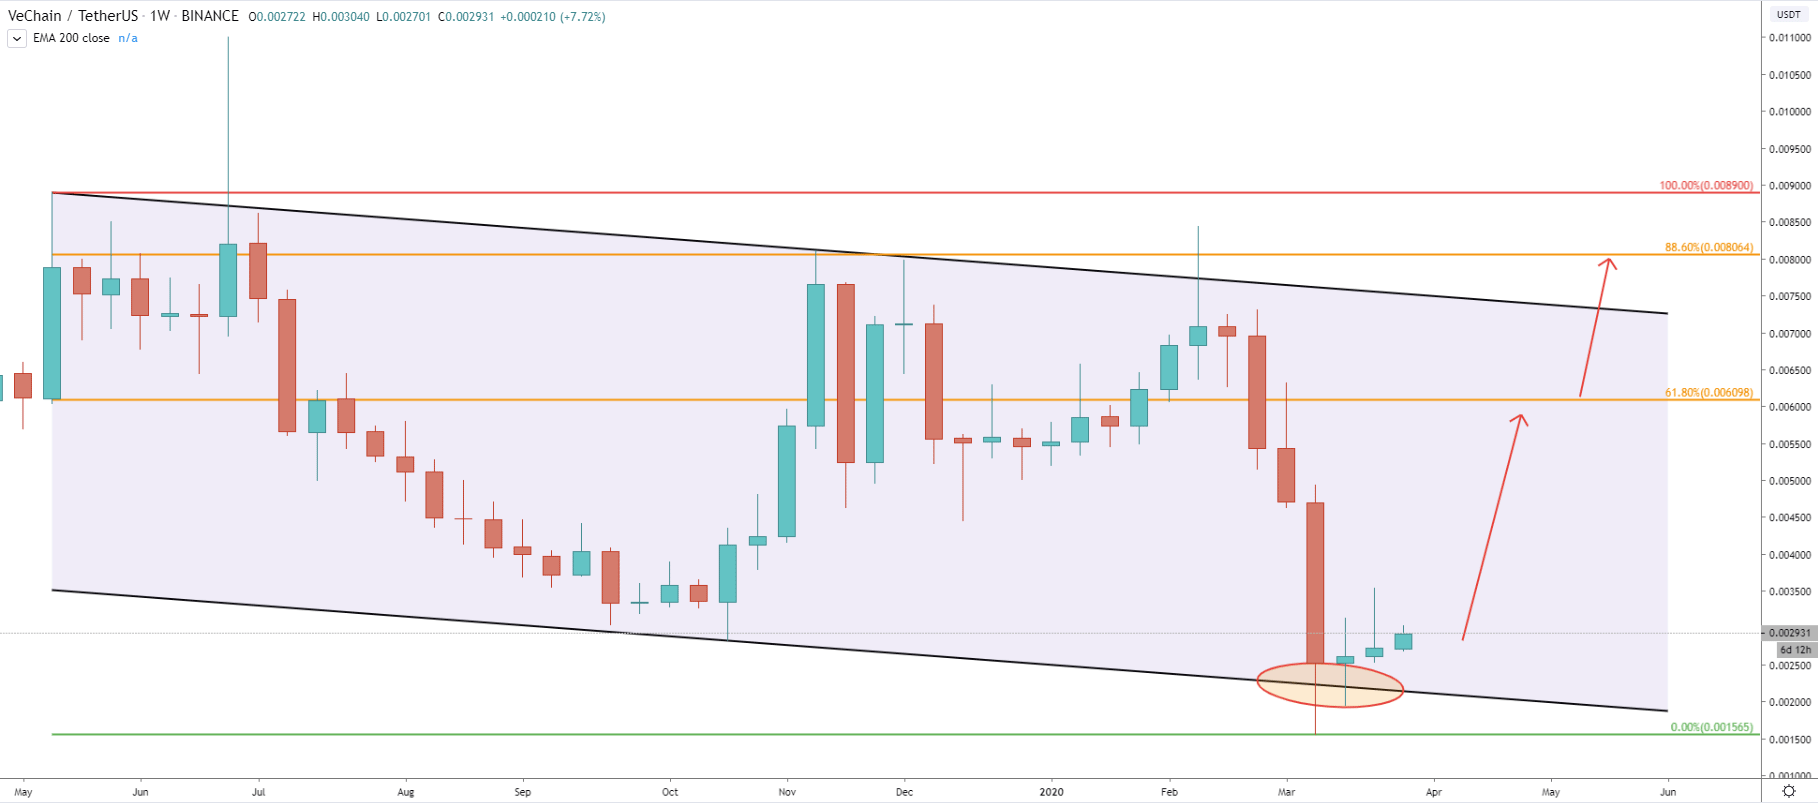
On February 15, 2019, VET/USDT has tested 0.00847 BTC high, but then selloff has begun. VET lost to the USD 81.45% in less than a month, which was a very sharp decline. We can see that price has reached to the bottom of the descending channel while hitting 0.001565 BTC. During the past 3 weeks, VeChain price has been trading around 0.0025 BTC, while being in a consolidation phase. But all 3 Weekly candles remain bullish (green), which could be the starting point of the upside rally.
If the price won’t break below the 0.001565 BTC, we can expect an uptrend, with the nearest target at 0.006 BTC, that is 61.8% Fibonacci retracement level. This is a 105% profit potential based only on the nearest target. If the first target is taken out, next will be 88.6% Fibonacci retracement level at 0.008 BTC. And finally, if VET/BTC will break above 88.6% Fibs, this will open doors for a much stronger rally to the upside.
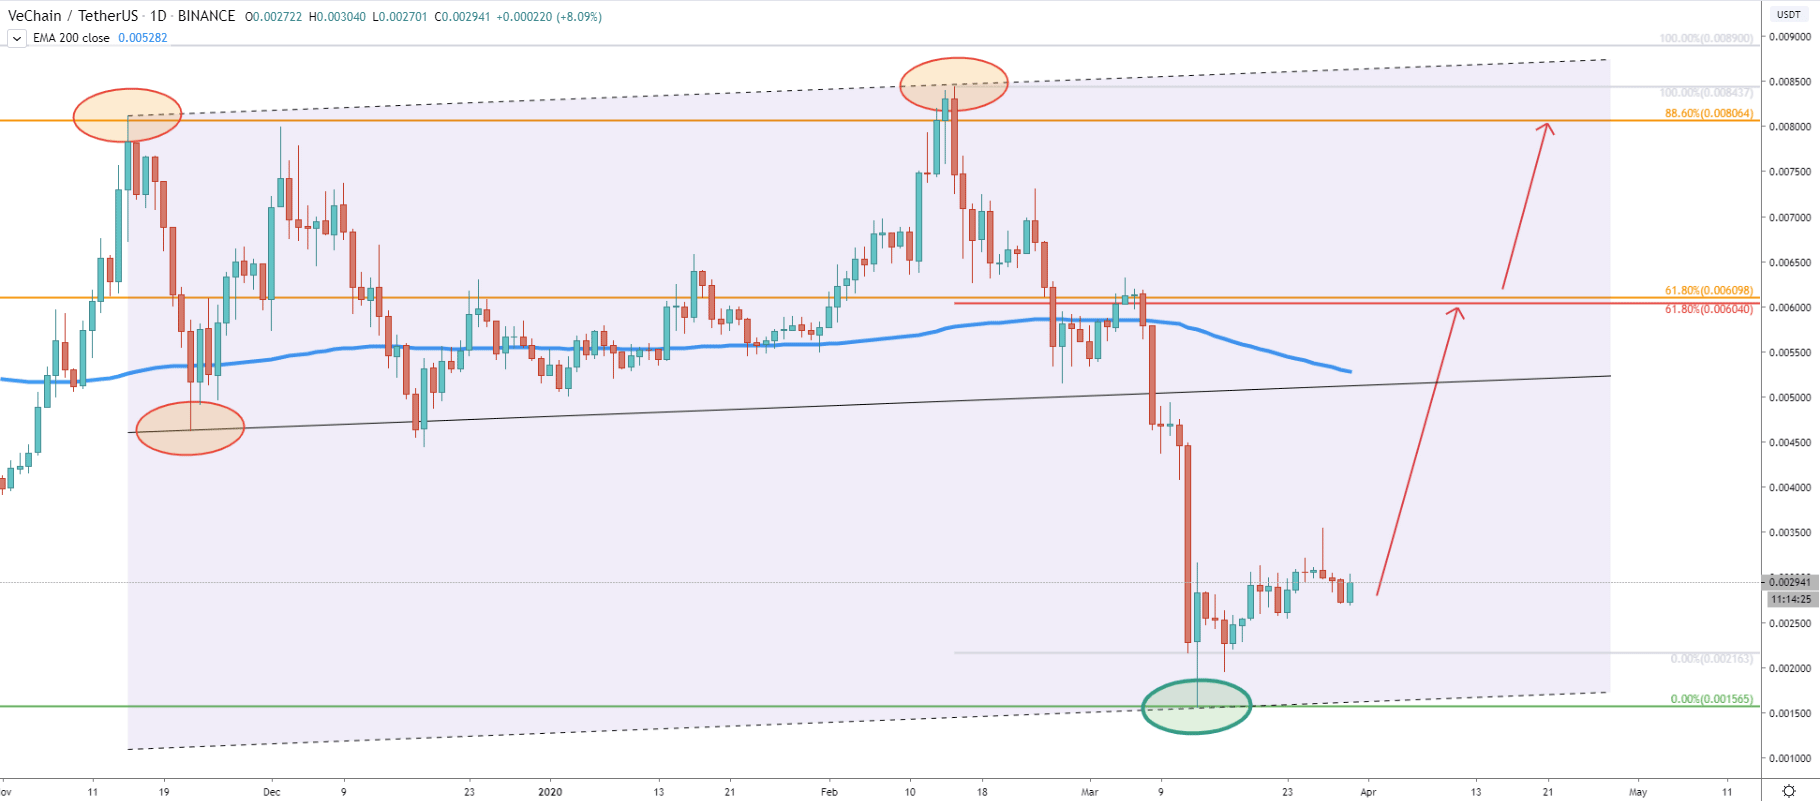
On the Daily chart, we have used another channel, and you can see that price has reached and rejected cleanly the lower trendline of the extended channel. Such a clean bounce does look very positive and it could be that VET/USD has produced the lowest point this year.
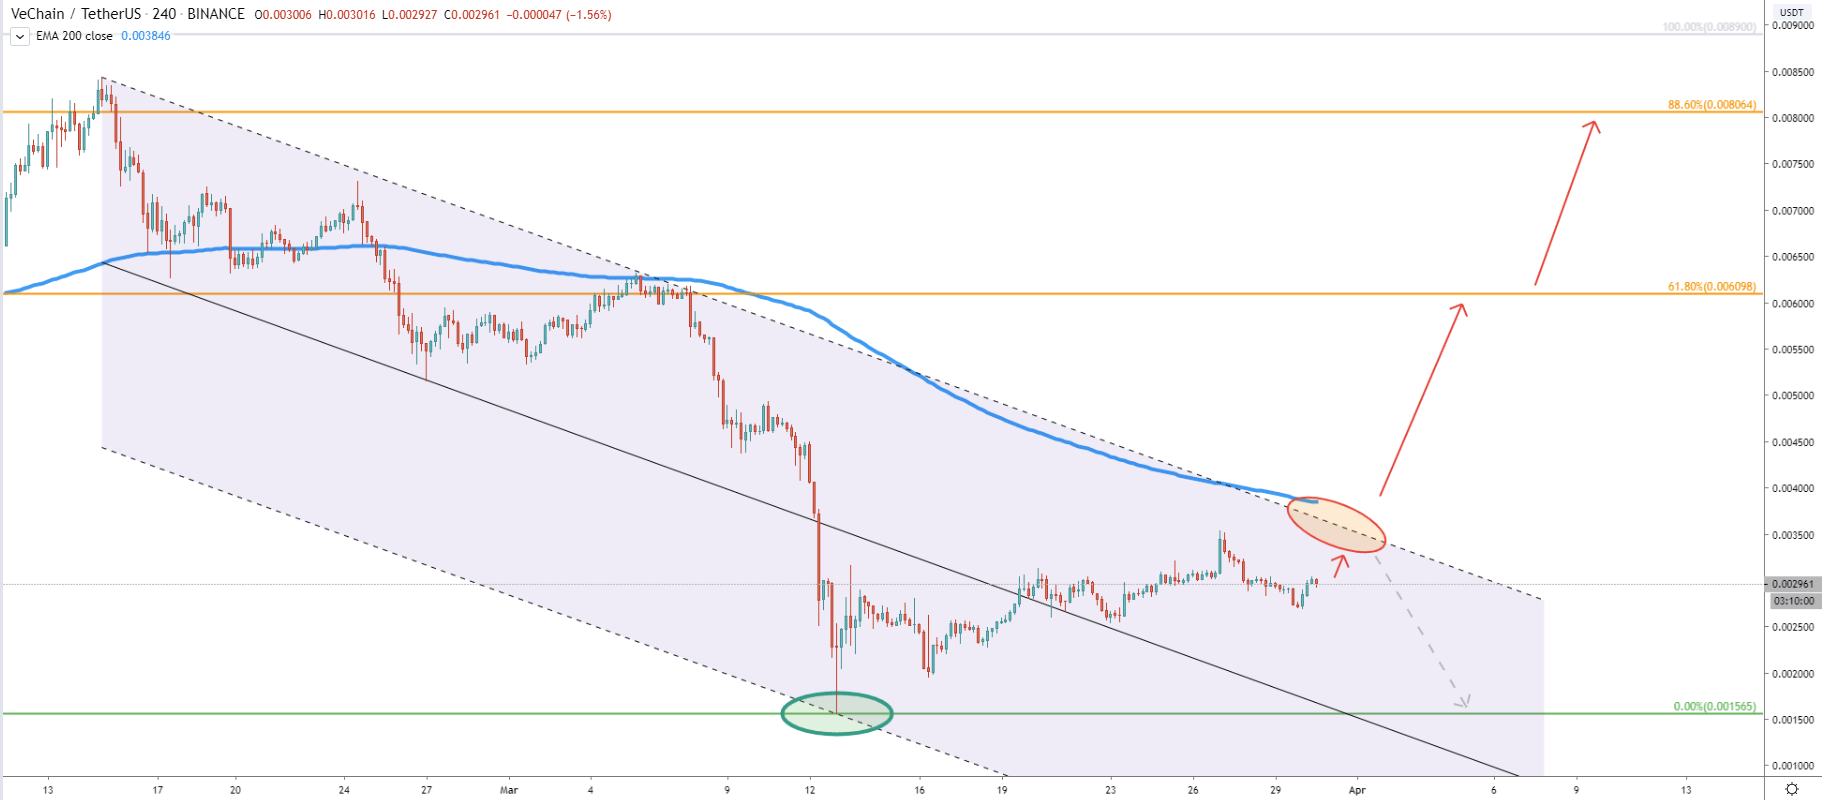
However, if we look at the 4H chart, there are some obstacles on the way up. The downtrend trendline and the 200 Exponential Moving Average must be broken to initiate the upside rally. Therefore, currently, price is expected to rise slightly and we are yet to see whether it will breaks above or not. If rejected, VET could, once again, re-test previously established low. But on the other hand, if price breaks above these obstacles, it could be the long-awaited confirmation for the bull, and a trigger point for a massive uptrend.
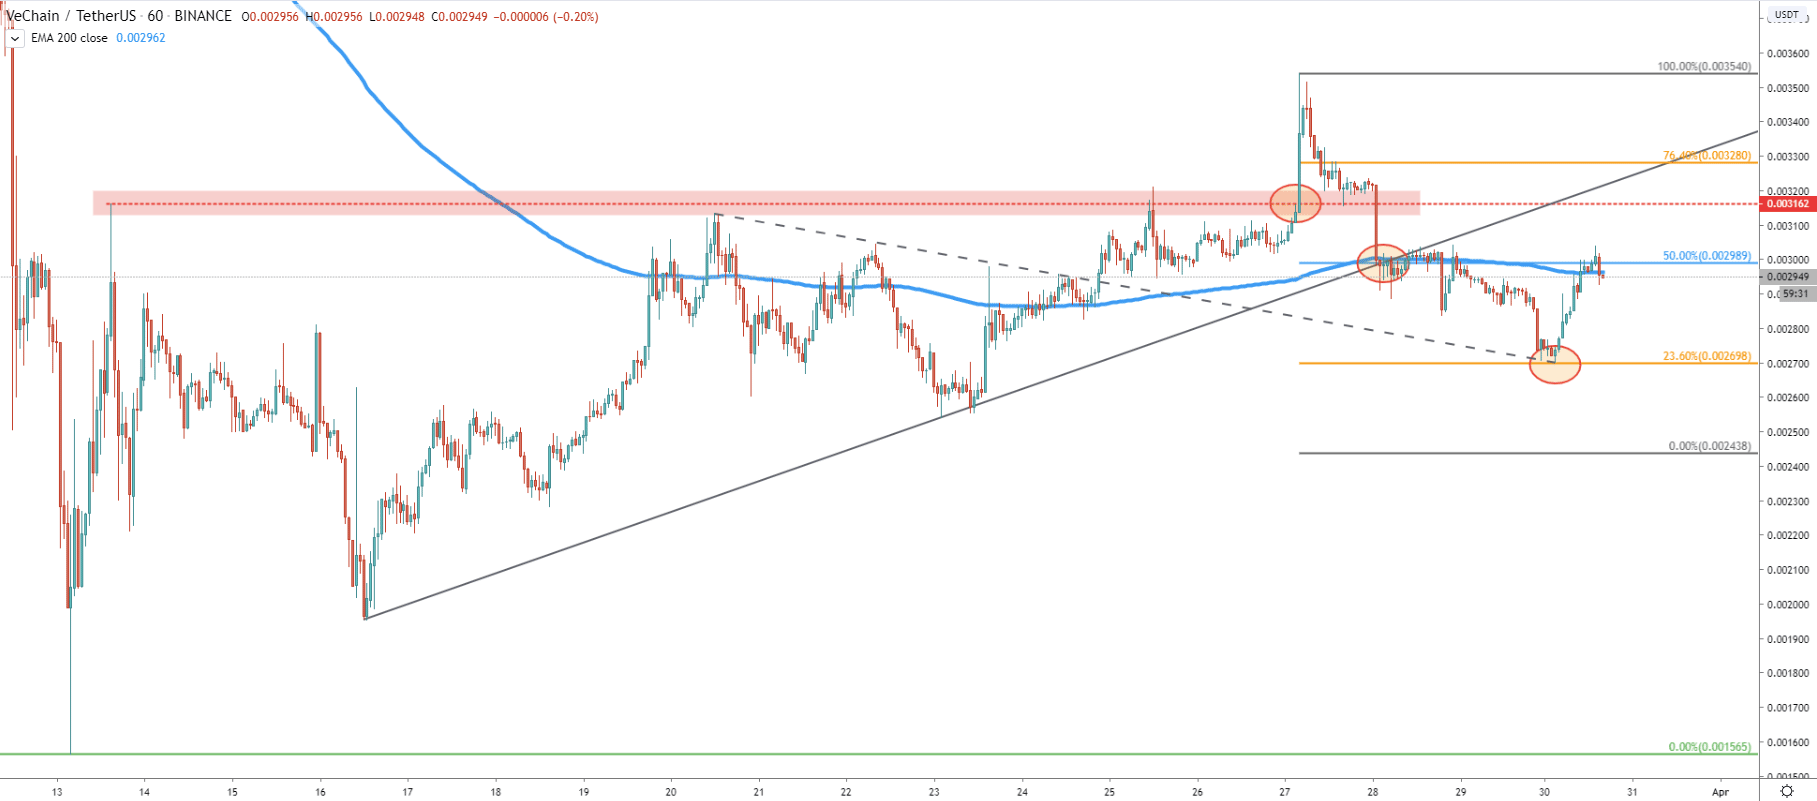
And here comes the 1h chart. We have taken the breakout point of the uptrend trendline and applied the Fibonacci retracement indicator to it. We placed the 50% retracement level at the breakout point, which showed that VET/USDT bounced cleanly off the 23.6% retracement level. At the same time, it bounced off the downtrend trendline, which previously was broken. Obviously there is support at 0.002700 BTC. and while the price remains above, we can expect further growth. Also, today VET/USDT broke above the 200 EMA, which is another positive sign.
VeChain is one of the top coins and should be seriously considered for any long term crypto investor. It could be that price has produced an all-time low and from this point onwards there will be a strong move to the upside.
There are two major resistance levels to watch. First is 61.8% Fibs at 0.006 BTC, and the second is 88.6% Fibs at 0.008 BTC. Both of them should play a key role in further price development if/when reached. But break and close above 88.6% Fibs is likely to confirm a long term uptrend where upside targets could be much higher.
Clearly, the long term trend is very bearish as the price continues to print lower lows and lower highs. It is very risky to trade against the trend as the price can always go for new lower lows. The uptrend scenario would be invalidated only if VeChain daily candle breaks and closes below the 0.0027 BTC support, as per 1H chart. In this case, we can expect the price to move towards 0.001565 BTC low once again.
Support: 0.0027
Resistance: 0.0060, 0.0080