
Published: May 27th, 2020
The USOil has recovered very strongly after hitting a $0 mark for a very short period of time. Clearly this commodity is highly manipulated and most likely will not play such a massive role in the economy after this act of manipulation. The world is ready for a variety of sources of alternative energy, which are being implemented at an enormous phase. This should be quite a negative factor for the USOil in the short, medium, and long term. Perhaps the price will never test $100 again, but there is always some hope.
Nonetheless, let's have a look at the price action of the USOil on four timeframes which will help us to understand short to medium term price perspectives.
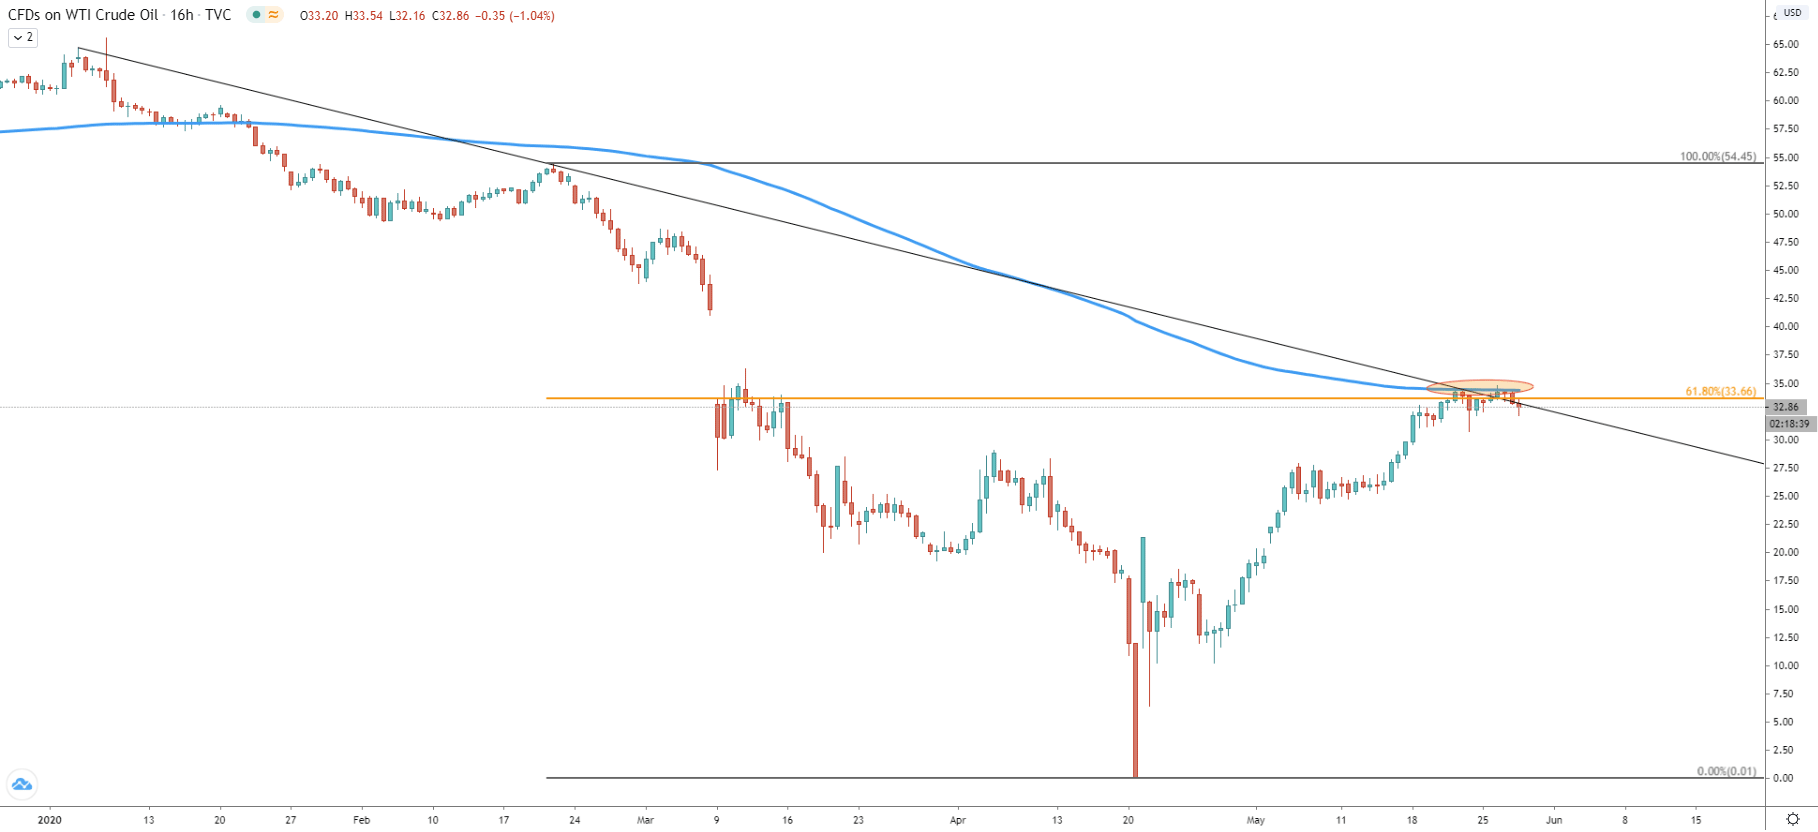
Starting off with the 16-hour chart, we can see a double rejection of the 200 Exponential Moving average. Price has been consolidating near the 34.64 resistance level for the past week, but failed to produce a new higher high with a clean break and close above the resistance. At the same time the downtrend trendline was rejected cleanly on May 21, and what is also important is that 61.8% Fibonacci retracement has been reached and being rejected. This is truly a very strong resistance area for the USOil and if the price will remain below the 34.64 level, the downside correction will be inevitable.
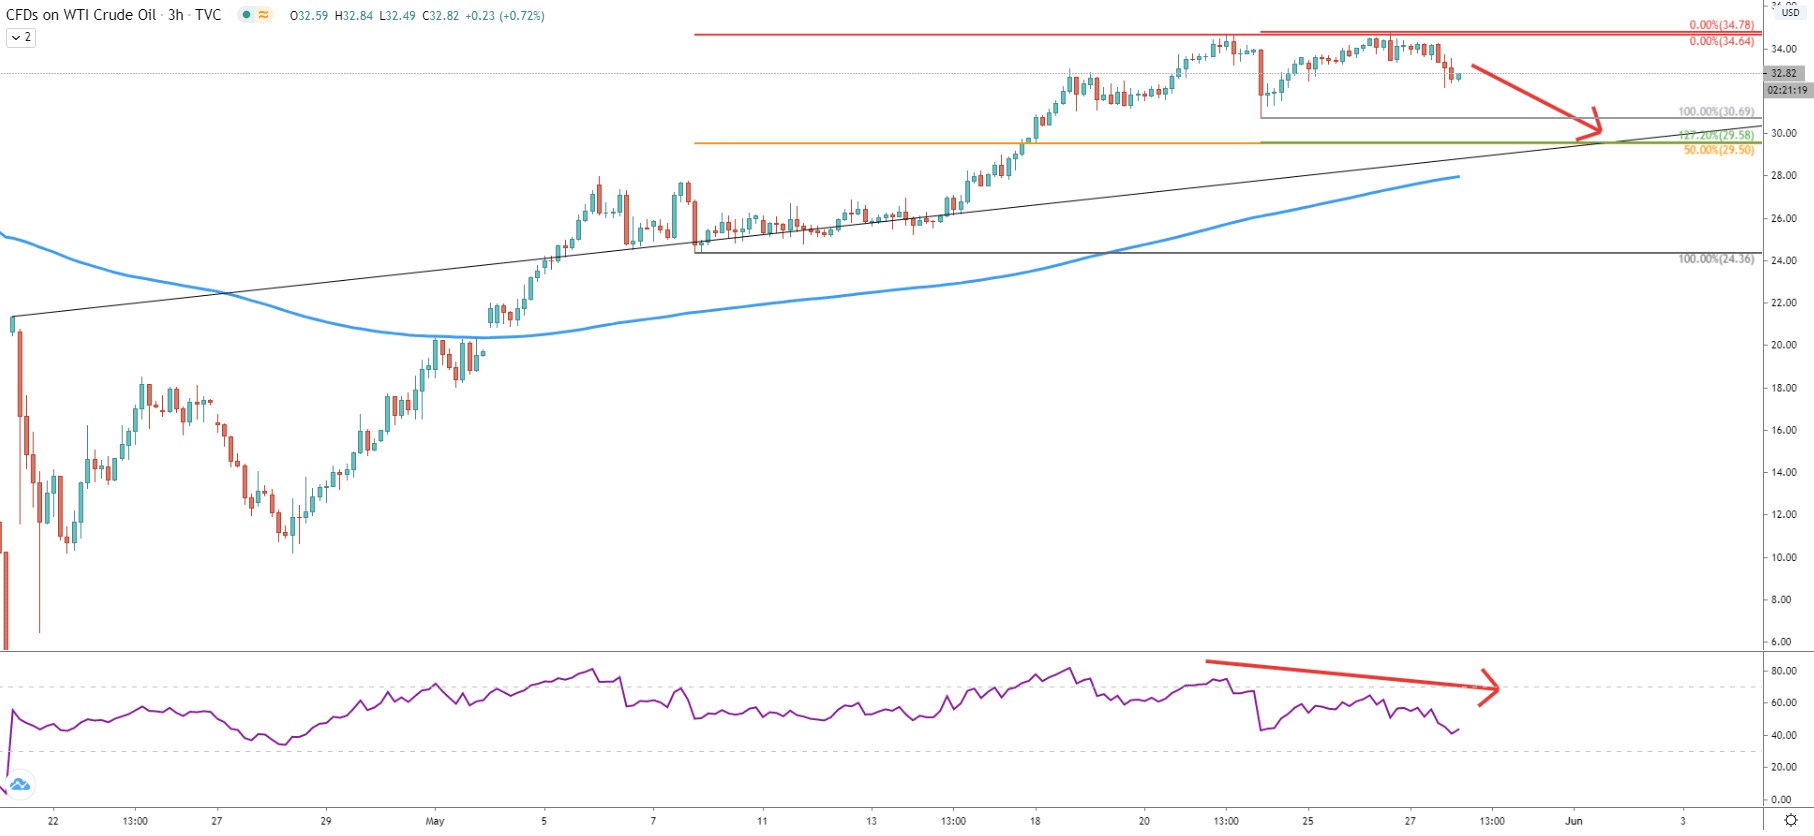
Moving on to the 3-hour chart, where we can observe the formation of the double top at 36.64. While price failed to produce a new higher high, the RSI oscillator formed a bearish divergence suggesting either a corrective wave down or even a trend reversal. This might result in the price decline at least down to 29.50, which is a key support in the medium term. This support is confirmed by multiple indicators; 50% Fibonacci retracement level applied to the overall uptrend, 127.2% Fibs applied to the most recent corrective wave up, and finally, it corresponds to the average price uptrend trendline along with the 200 Exponential Moving Average.
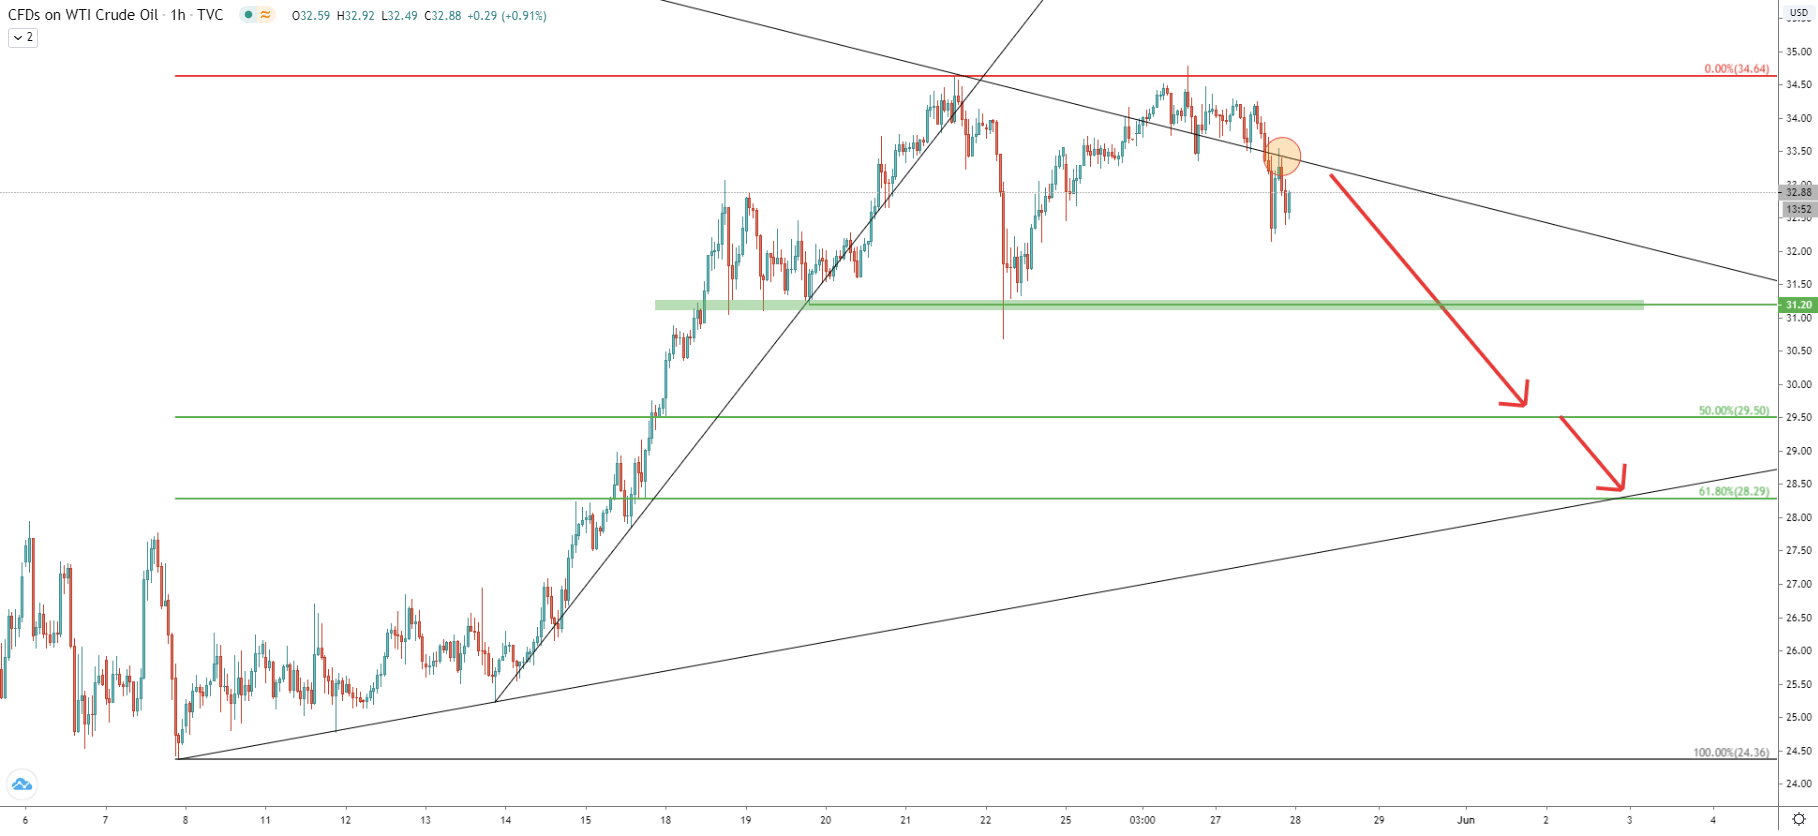
On the 1-hour chart price started to print lower lows and lower highs, besides the recent corrective move down ended right at the long term downtrend trendline. This could have been the “perfect entry” for sellers as the entry point was very close to the recently printed high. In regards to the downside potential, we’ve mentioned previously 29.50 support level. But there are more levels to watch if/when the price will start trending down. The first important support is obviously at 31.20, where previously price bounced off several times in a row. And the final support is seen at 61.8% Fibs at 28.30, which also corresponds to the uptrend trendline.
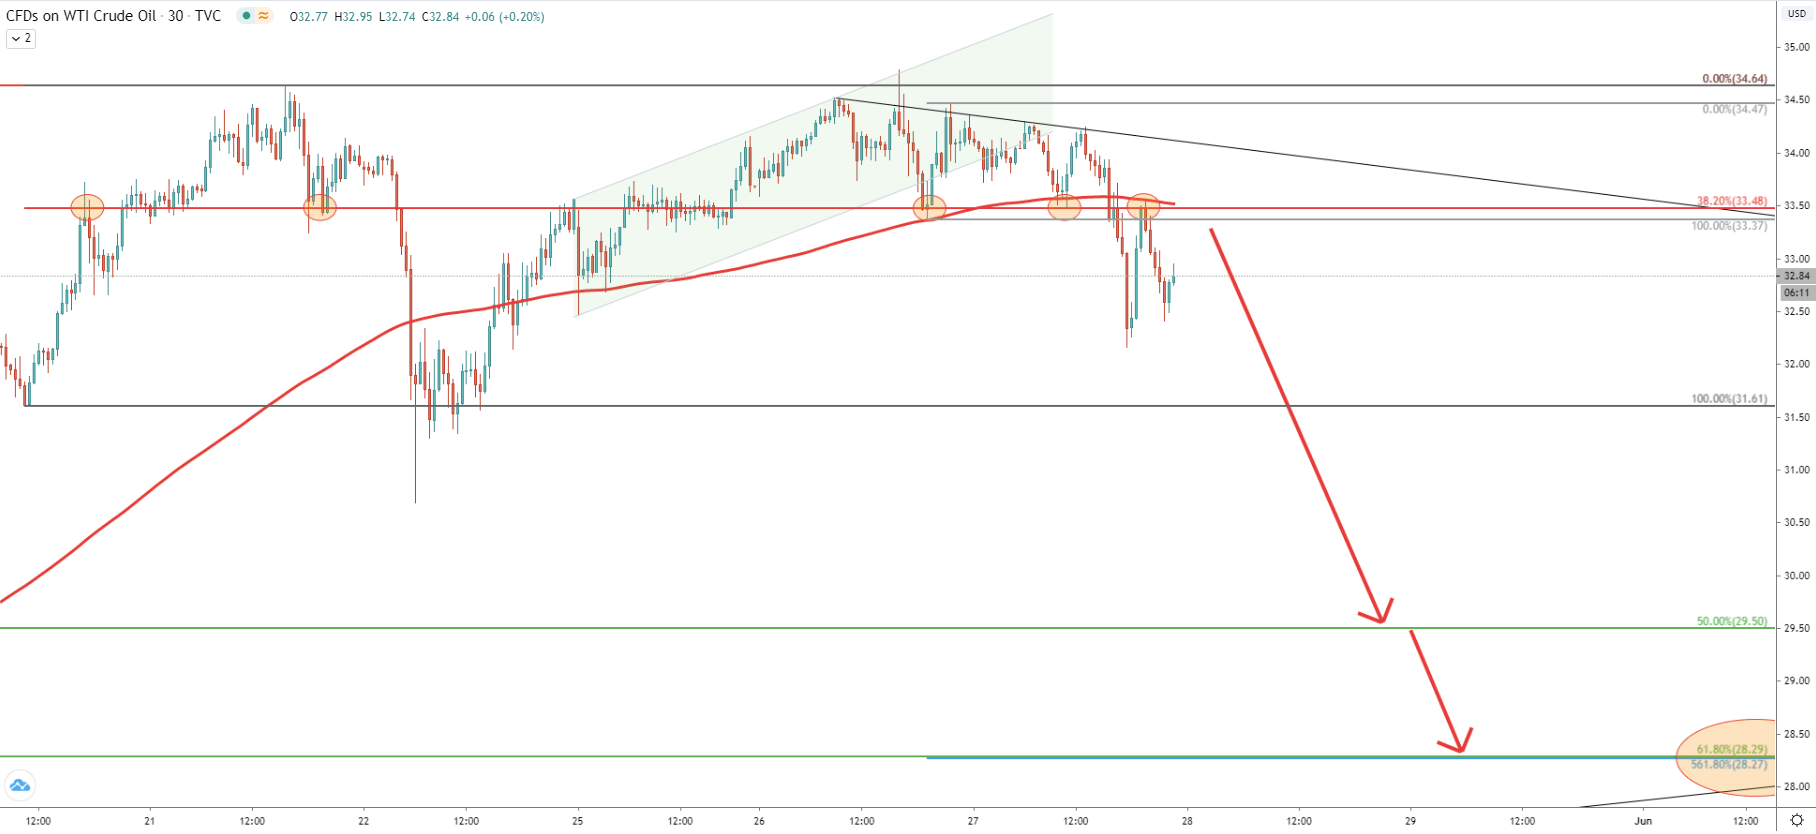
The last chart is on a 30-minute timeframe. Here we can see the break below the descending channel followed by the breakout of the 38.2% Fibs at 33.48. After a short consolidation and multiple rejections of the downtrend trendline, the USOil broke below the 33.48 support and established a new lower low. The most recent correction was stopped right at 38.2% Fibs as well as 200 Simple Moving Average. There was a very clean bounce off the SMA, yet again confirming the “perfect entry” for the sellers. Anf finally, Fibonacci applied to the corrective wave up, after breaking the 38.2% support, shows that 28.30 level could be the final downside target, as it cleanly corresponds to the 561.8% as well as 61.8% Fibs.
The USOil formed a double top, the bearish divergence, and rejected the 200 EMA, all at the same time. This goes to show that bears are in control and the correctional wave down should be expected.
There are two main downside targets. The first being the 29.50, and second, corresponding with 2 Fibs is located at 28.30.
While the probability of the uptrend continuation remains very low, still, daily break and close above the recent higher high at 34.80 will completely invalidate the bearish scenario and will likely result in the continuation of the uptrend.
Support: 30.70, 29.50, 28.30
Resistance: 33.48, 34.80