
Published: July 13th, 2021
The US economy is on the track of recovery while restaurants, hotels, and travel sectors are getting ready for the upcoming Christmas. Moreover, the June employment saw the most significant increase in the last 18 months, indicating that people have come back to work and they are spending.
Despite the US dollar’s strength, USDJPY failed to hold the bullish momentum above the 111.00 resistance level. Moreover, treasury yields and the stock market started to move down, indicating that the US rebound is overstated, which is unrealistic. Therefore, for this week, investors should closely monitor the inflation and retail sales data. Any upside result in CPI above 4% level may create a solid bearish pressure in the USDJPY.
On the other hand, Japan has a lot of reasons to say that the economy is improving. Labor market and household spending moved higher in May, but the rising COVID-19 cases are less relevant. Still, the vaccination rate is lower in Japan than in any other developed country, while the lockdown is running in Tokyo.
Among trend-changing events, investors will see US CPI today along with US retail sales on Friday. So, can USDJPY sellers gain momentum this week?
Let’s see the future price direction from the USDJPY technical analysis:
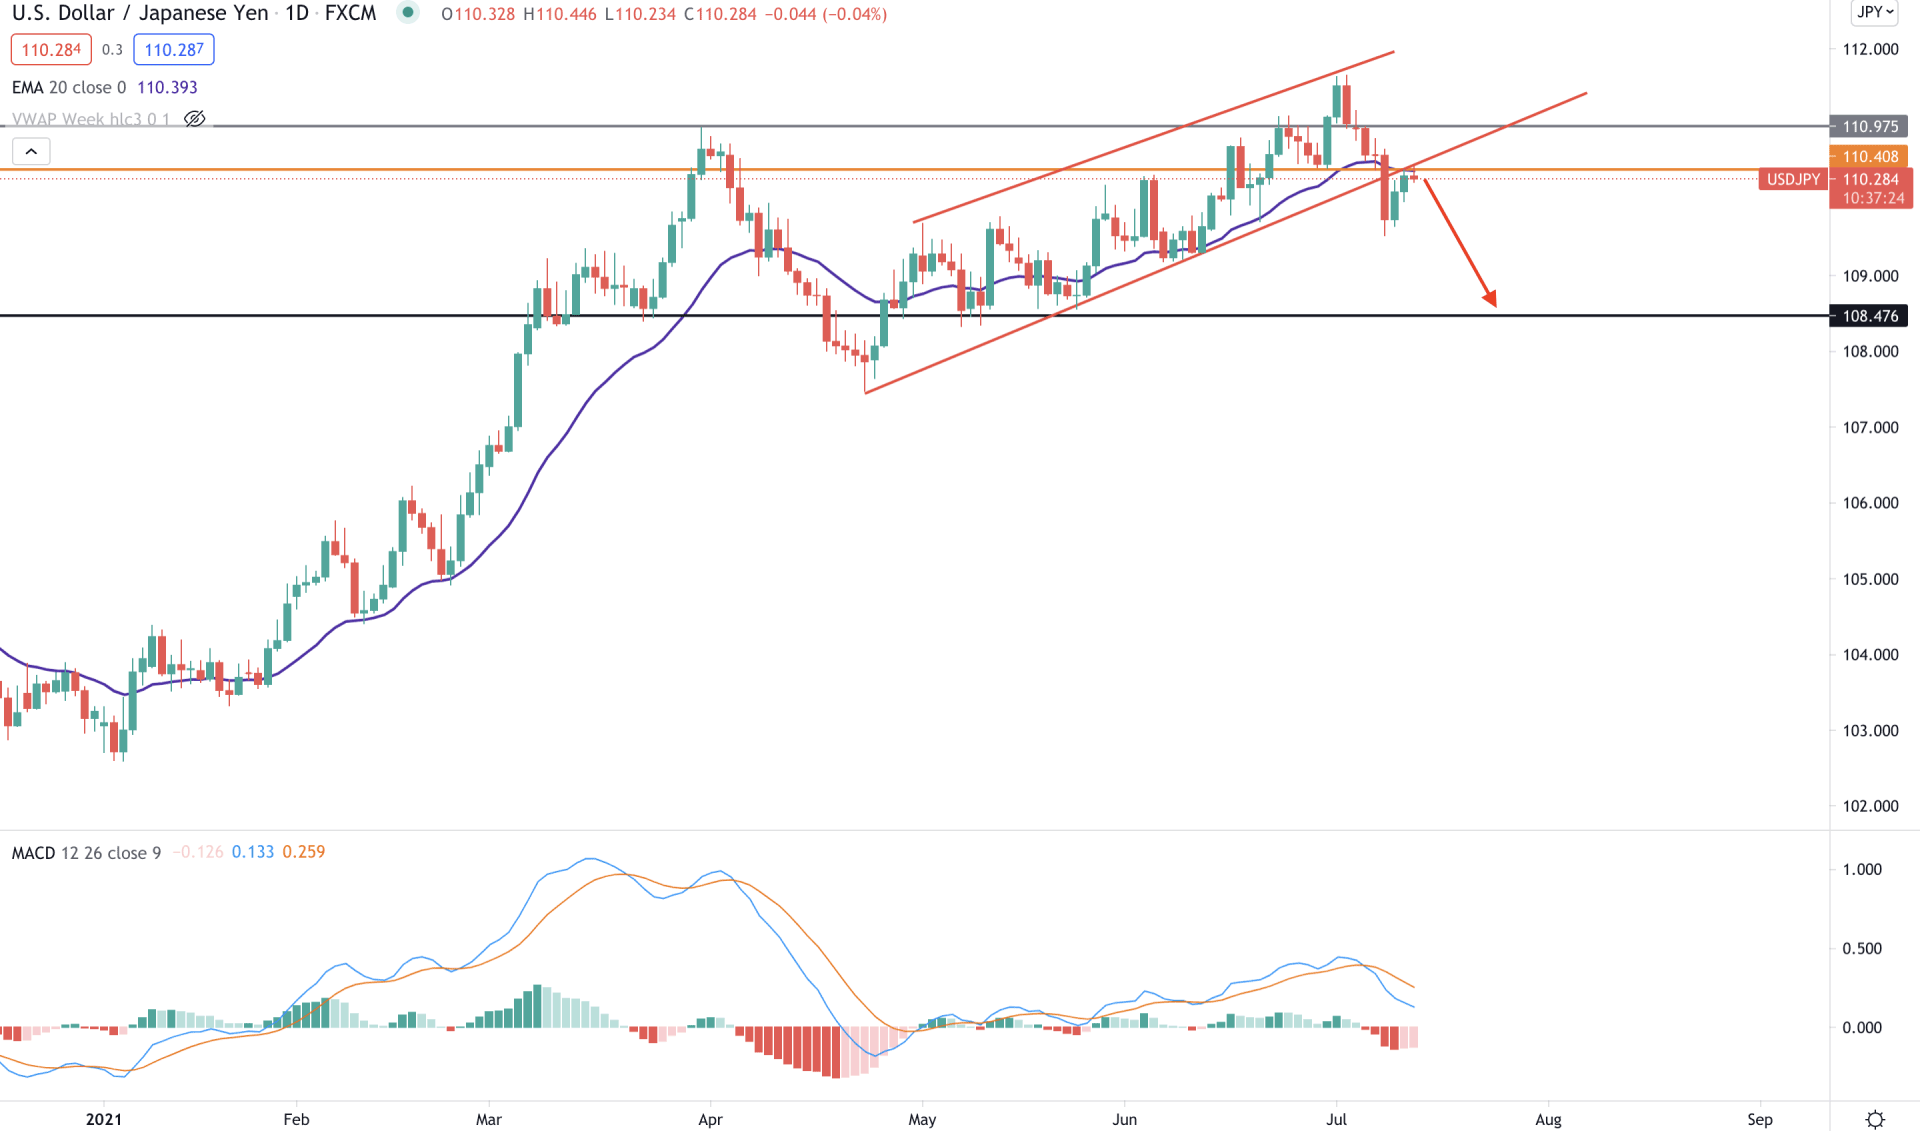
USDJPY remained within an uptrend, but the buying pressure from mid-April was very corrective. As a result, the price moved higher but failed to sustain above the 111.00 resistance level. Moreover, the price moved higher within a channel, and the bearish pressure from 111.00 resistance and channel support created hope for sellers. Now, as long as the price is trading below the 111.00 resistance level, it has a higher possibility of coming lower in the coming days.
In the above image, we can see the daily chart of USDJPY where the most recent price broke below the channel support with an impulsive bearish pressure. Moreover, the price is below the psychological 111.00 resistance and dynamic 20 EMA. Therefore, any selling pressure from the dynamic 20 EMA or intraday 110.40 resistance level may create a bearish pressure in the price towards the 108.46 level in this price context.
Moreover, MACD Histogram is bearish and making new lows, indicating that sellers are still active in the price. However, a stable bullish breakout with strong fundamental support above the 111.00 resistance level may alter the current market structure and take the price higher towards the 112.00 level.
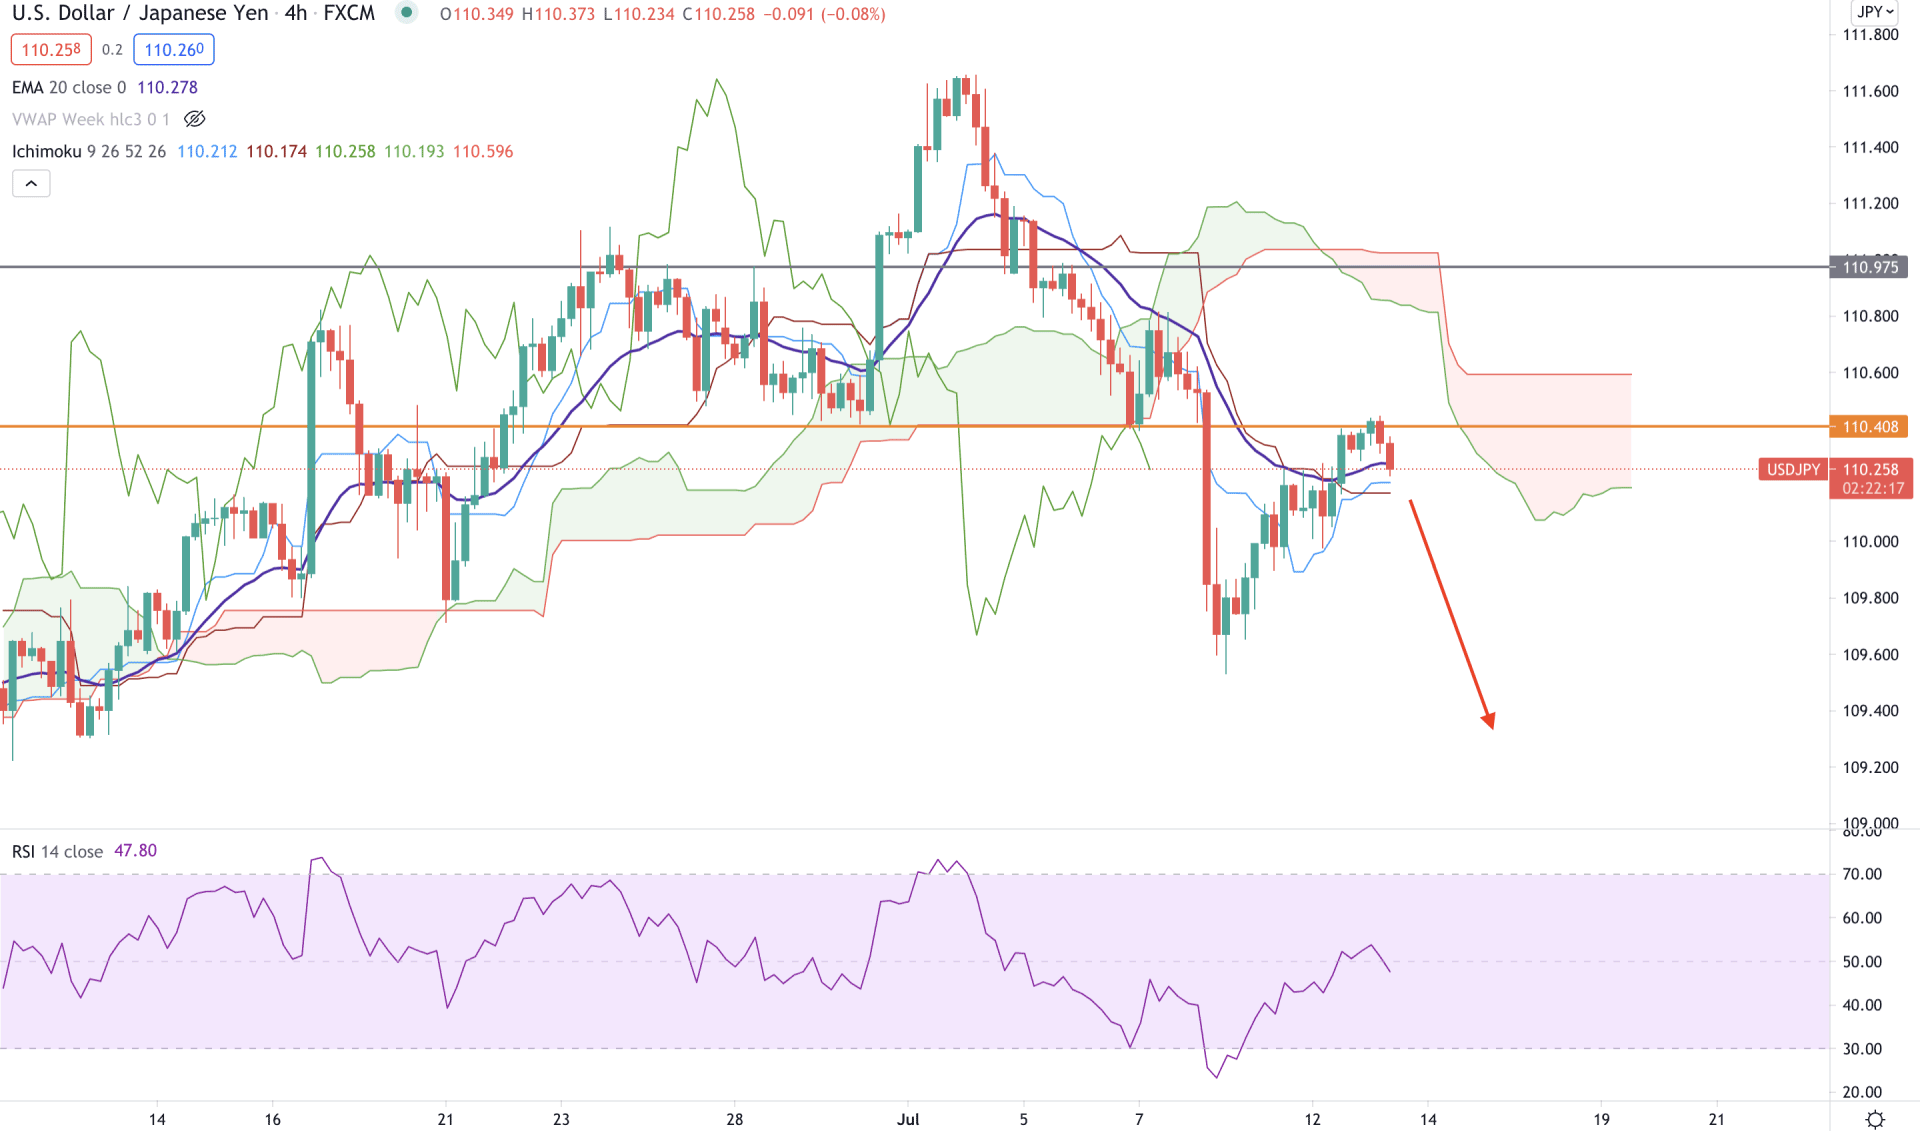
According to the Ichimoku Kinko Hyo on the H4 chart, USDJPY bears have a higher possibility of taking the price down. The price makes new lows below the Kumo Support level, while the Chikou Span is below the price. Moreover, in the future cloud, Senkou Span A is below Senkou Span B and aiming lower. However, the dynamic Tenkan Sen and Kijun Sen are still not supported.
The above image shows that the price is above the dynamic Kijun Sen with a crossover with Tenkan Sen below the price. Therefore, traders should see a bearish H4 close below the Kijun Sen to consider that the upcoming price possibility is bearish.
The price is still facing a minor resistance from the intraday 110.40 level while RSI is moving lower from the 50 levels. A bearish H4 close below the Kijun Sen may take the price more down towards 109.00 level in this price context.
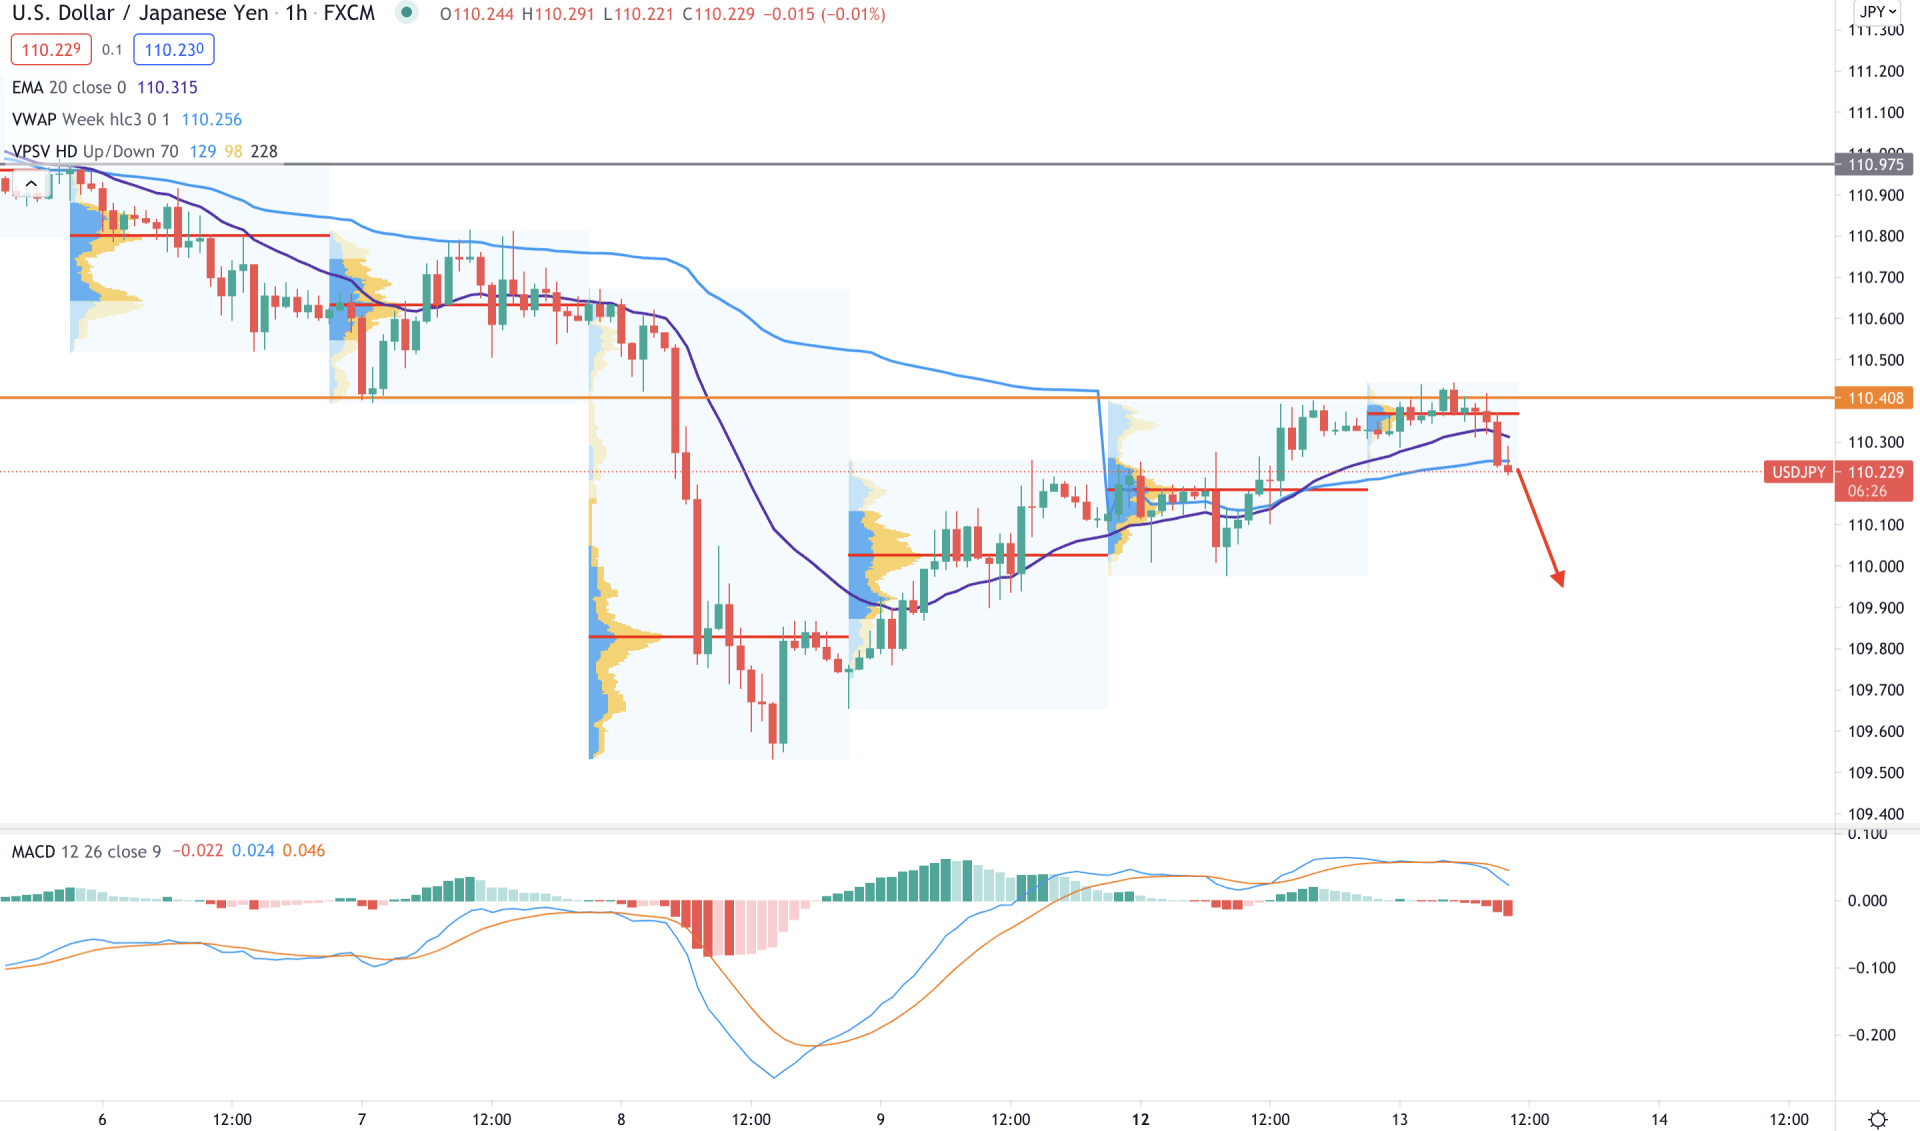
In the intraday price chart, USDJPY broke below the 110.40 event level with strong bearish pressure and tested that level with a corrective speed. Moreover, the price broke below the most recent high volume level at 110.36 level with a bearish pressure. Therefore, as long as the price is trading below the 110.40 level, it has a higher possibility of coming lower in the coming sessions.
The above image shows that the USDJPY price is made an H1 close below the dynamic 20 EMA and vwap level. Moreover, MACD Histograms are below the price and making new lows. In that case, the price may come lower towards 109.60 swings low in the coming session.
On the other hand, a stable bullish H1 close above the 110.40 level may take the price higher towards the 111.00 area.
As of the above discussion, USDJPY has a higher possibility of coming lower towards the 108.47 level as long as sellers are holding the price below the 110.40 intraday event level.
However, any strong bullish H4 above the 110.40 level may initiate a broader correction to the price for coming sessions.