
Published: July 5th, 2022
The US Durable goods orders of May came higher at 0.7% against the 0.1% expectation. The core capital goods also rose by 0.5%, indicating that the business investment is growing despite the inflationary pressure.
The headline PCE number remained unchanged at 6.3% year over year in May, while the Core PCE recorded a decline to 4.7%. Moreover, the ISM manufacturing PMI for June dropped from 56.1 to 53.0, while new orders plunged below the 50.00 expansion level. In addition, the employment index moved down, increasing the possibility of a recession. However, investors' sentiment awaits how this week's Non-farm payroll is coming. The current expectation of the NFP is to move from 390K to 275K with a stable unemployment rate of 3.6%.
On the other hand, the US Dollar index remained steady where the recent price increased to 106.00 level, which has not been to be tested since 2003. Although the SNB total sign deposits for the week ending 24 June came at CHF748.5bn vs CHF751.8bn, the market sentiment would be towards the US Dollar.
Let’s see the future price direction from the USDCHF Technical analysis:
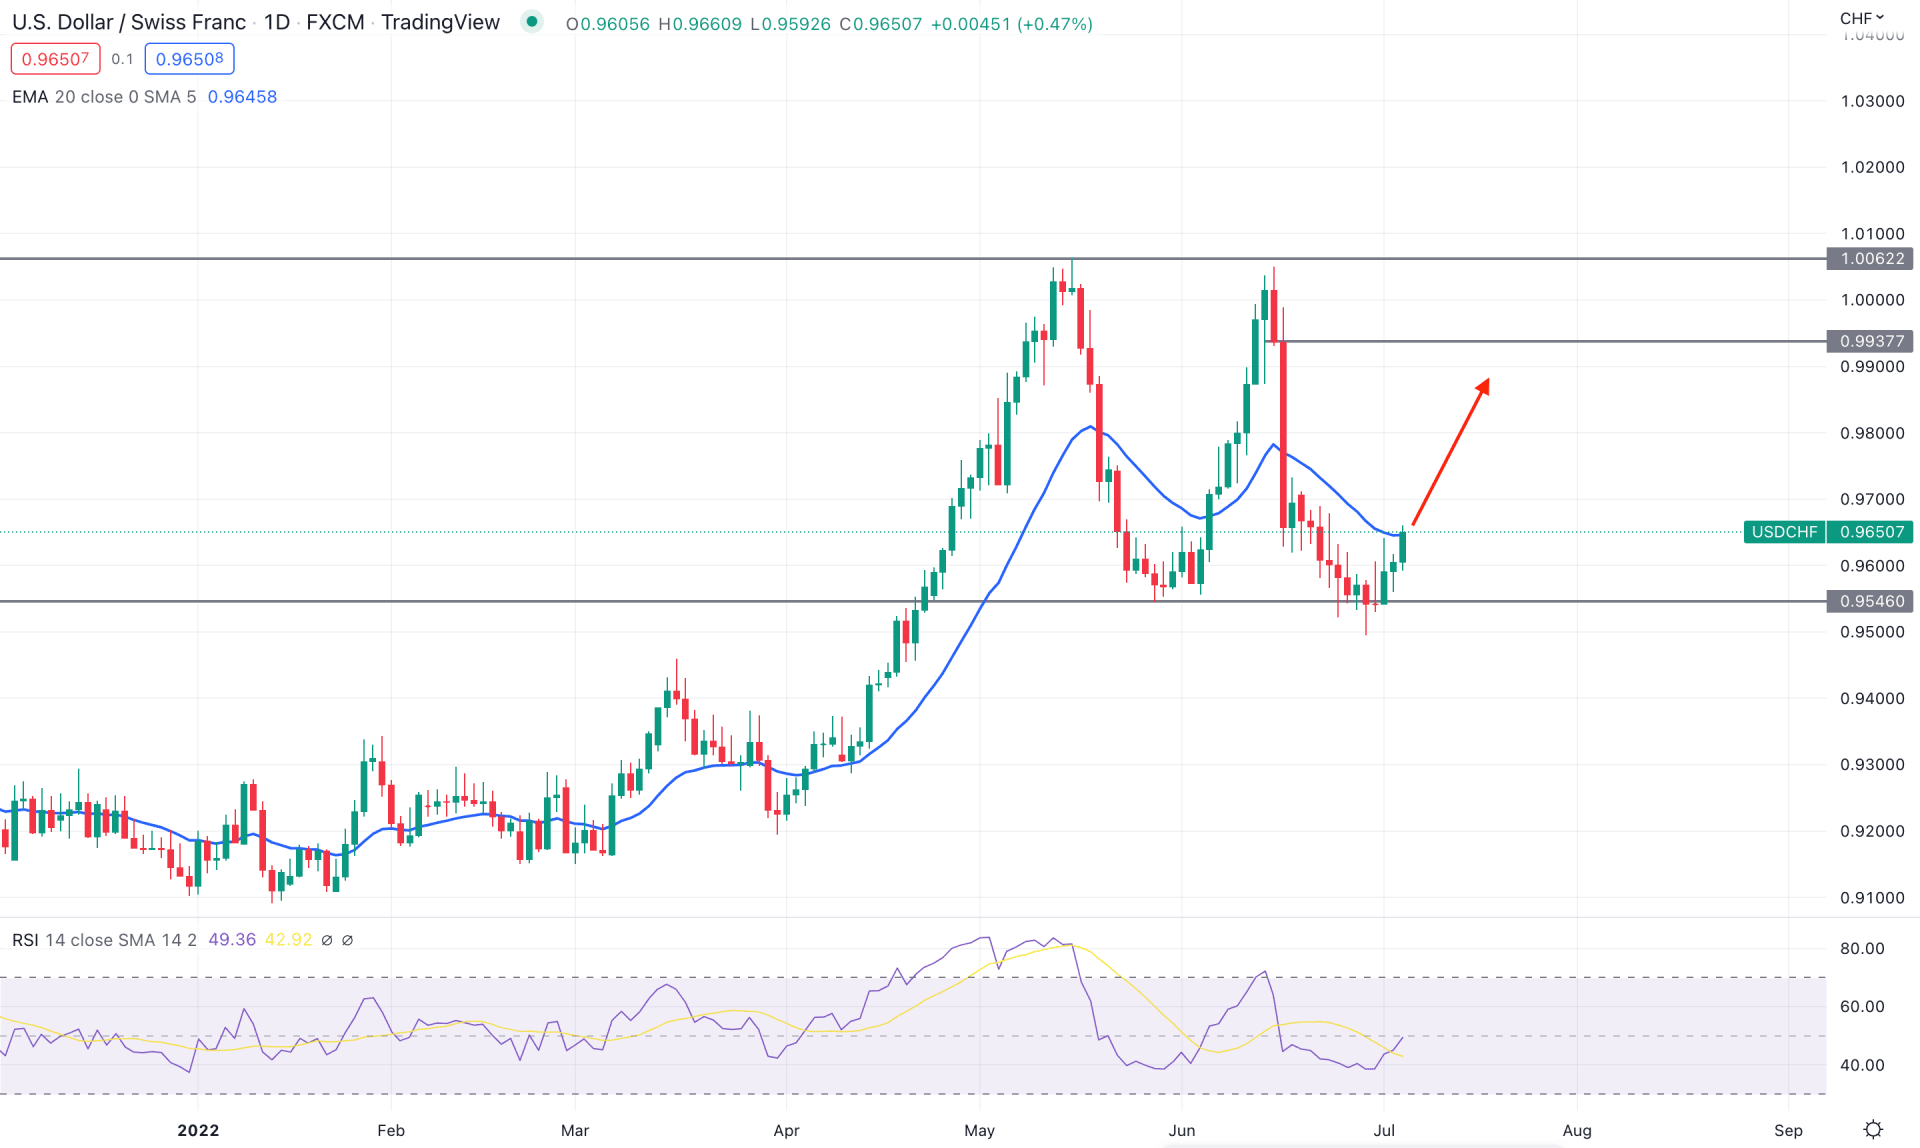
According to the daily USDCHF trend, the price remained bullish for a long time, and the recent bearish break below the 0.9546 support level and rebound is a sign of a sell-side liquidity grab. In that case, any buying price action above the 0.9546 support level is more likely to provide successful buying momentum, depending on the intraday price action. On the other hand, the dynamic 20 EMA has become a barrier for bulls where a minor bearish correction is pending.
The above image shows how the RSI shifted its direction to the buyers' side and reached the neutral 50 level. In that case, a daily candle above the 20 DMA with the RSI above the 50 level would be the first of an upcoming bullish pressure.
Based on the daily structure, investors should closely monitor how the price trades at the 0.8700 to 0.8650 zone, where a bullish daily candle above the 0.8700 would be the safer buy position. The target for the bullish pressure would be towards the 0.9937 flip zone, while the invalidation level is at the 0.9546 level.
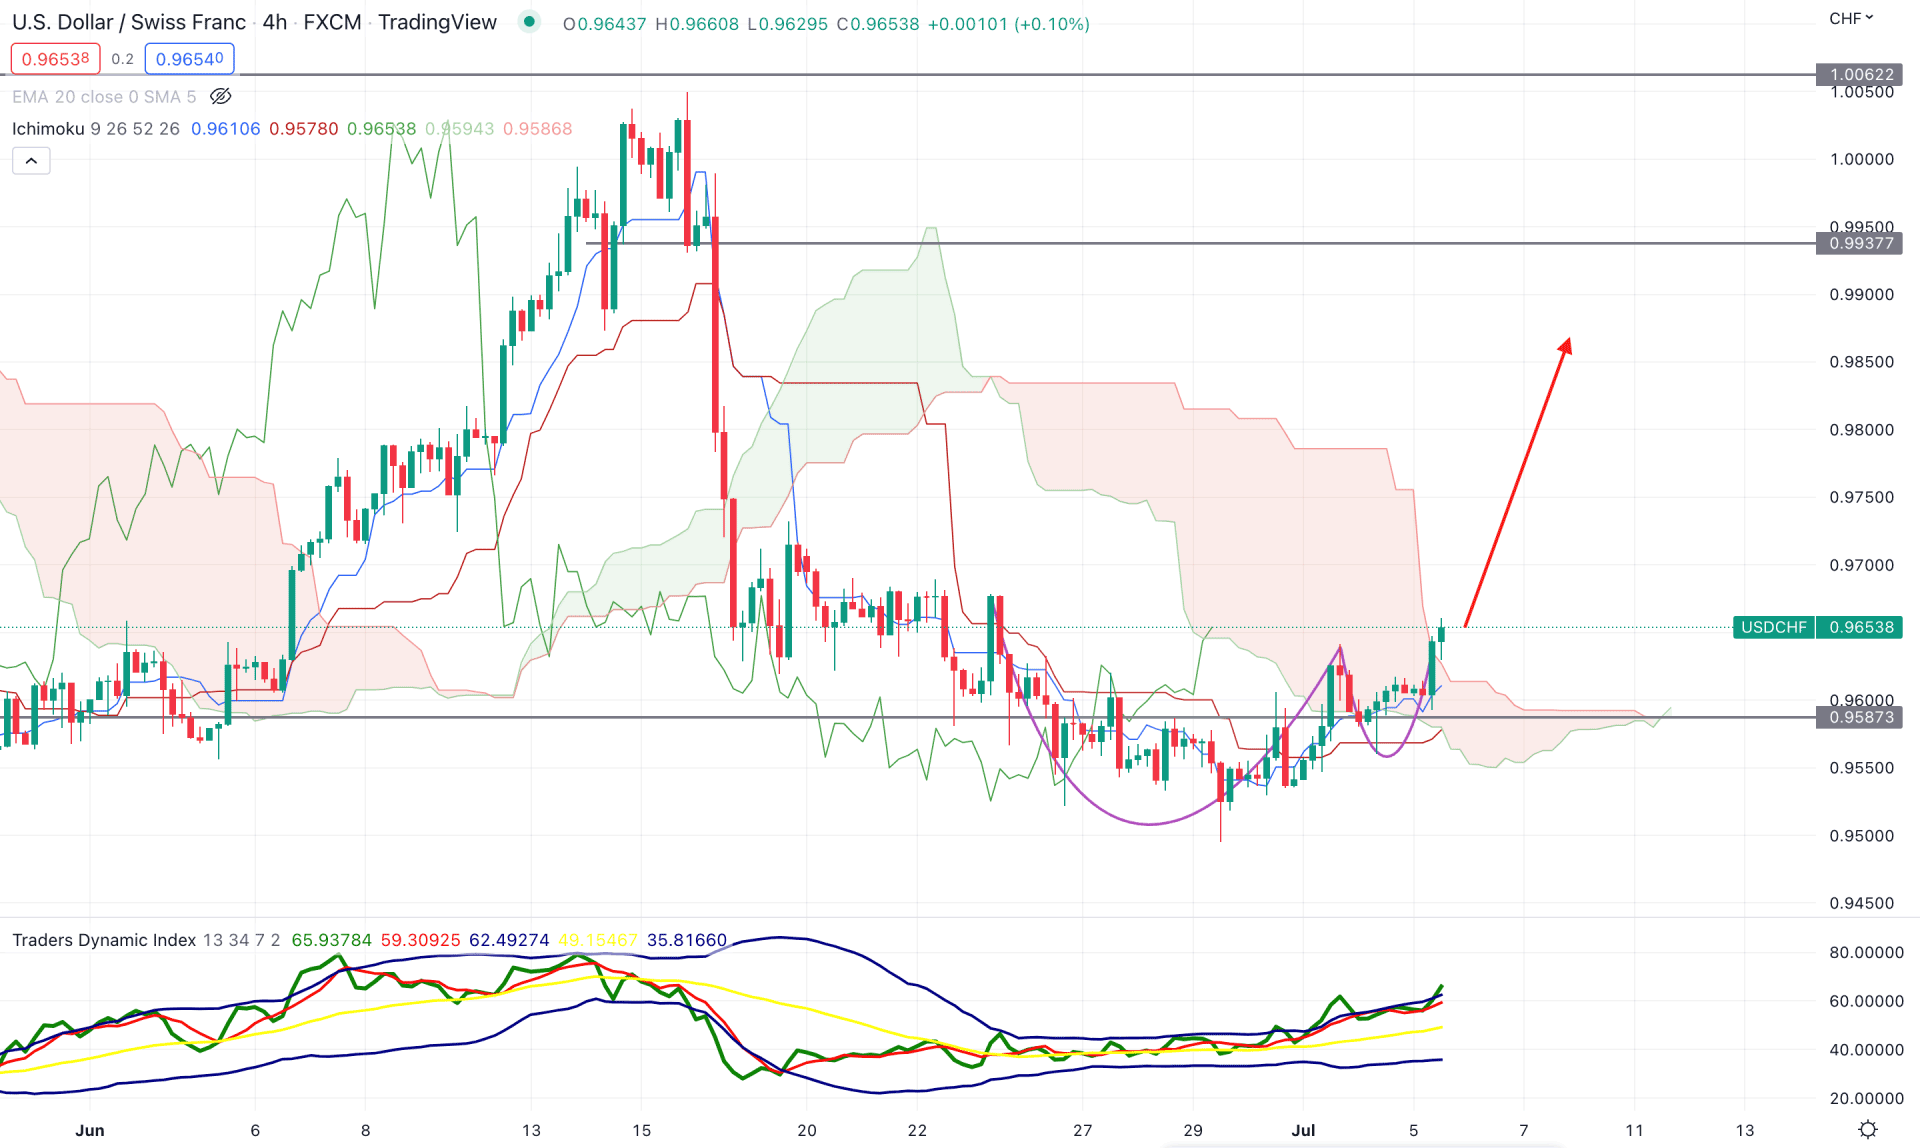
According to the Ichimoku Cloud, the USDCHF price became extremely corrective below the Kumo Cloud, increasing the possibility of a bullish breakout. Finally, a bullish H4 candle appeared above the cloud resistance, with confluence support from the cup and handle pattern. In the future cloud, the market sentiment turned bullish by taking the Senkou Span A above the Senkou Span B.
The above image shows how bulls dominate the market from the Traders’ Dynamic Index Indicator. The current TDI line is steadily moving up after facing a corrective structure. The Tenkan and Kijun Sen lines are also below the price, working as an immediate support level. Moreover, the current bullish pressure is backed by a bullish crossover between Tenkan Sen and Kijun Sen lines.
Based on the H4 price action, investors can consider the forthcoming price direction bullish as long as it trades above the Kijun Sen Support. The main aim of the buying pressure is to fill the imbalance zone and test the 0.9937 flip zone. The alternative approach is to wait for a bearish H4 candle below the 0.9587 level and change the price target towards the 0.9500 level.
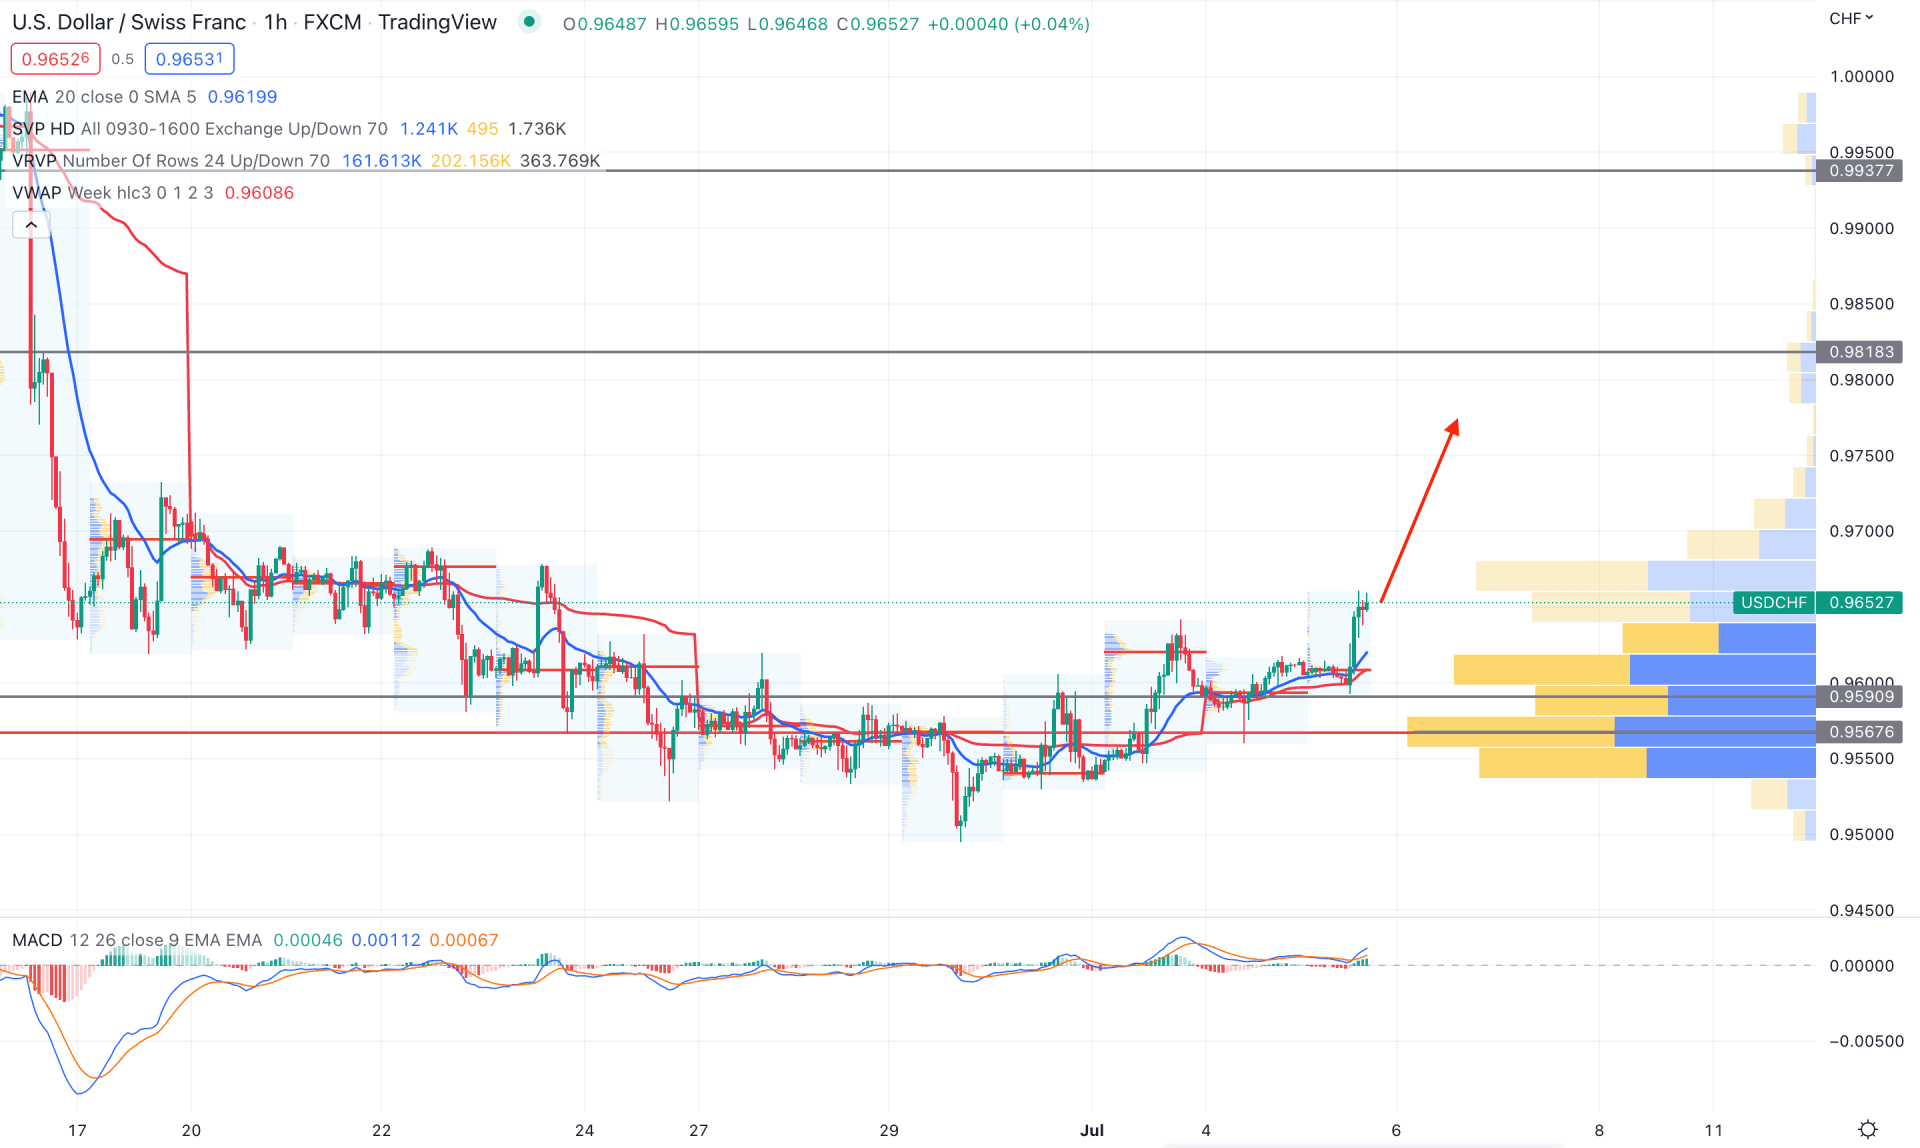
According to the USDCHF H1 chart, the price shows strong buyers’ interest from the visible range trading volume. The latest high visible range volume is at 0.9567, indicating that bulls have started increasing the price with strong momentum from that level. Moreover, the intraday high volume levels are below the current price, indicating buyers’ dominance in the market on the intraday chart.
The indicator window shows that the MACD Histogram turned bullish, indicating buyers’ pressure on the price. Moreover, the dynamic 20 EMA and weekly VWAP are below the price at the latest intraday high volume level.
Based on the H1 chart, we can say that the price has a higher possibility of moving up and testing the 0.9818 supply level in the coming days. The bullish possibility is valid as long as it trades above the 0.9590 intraday support level. Conversely, a break below the 0.9567 level with a bearish H1 candle would alter the current market structure and test the 0.9500 level.
Based on the current multi-timeframe analysis, USDCHF will likely move higher in the coming days. In that case, investors should monitor the price trades at the daily 20 EMA to find the precise buying position. However, the intraday price is supportive for bulls, where any bullish rejection from dynamic Kijun Sen support would provide a potential buying opportunity.