
Published: June 4th, 2020
There has been a lot of range trading going on with the USD/CHF currency pair. In fact, it has been ranging since April 20, making the consolidation period as long as 2 months. This is a very extended sideways move, which at some point should have come to an end. Perhaps right now we can witness the end of the consolidation and the beginning of a strong trend. In this analysis, we will go through the potential price direction and of course targets to monitor.
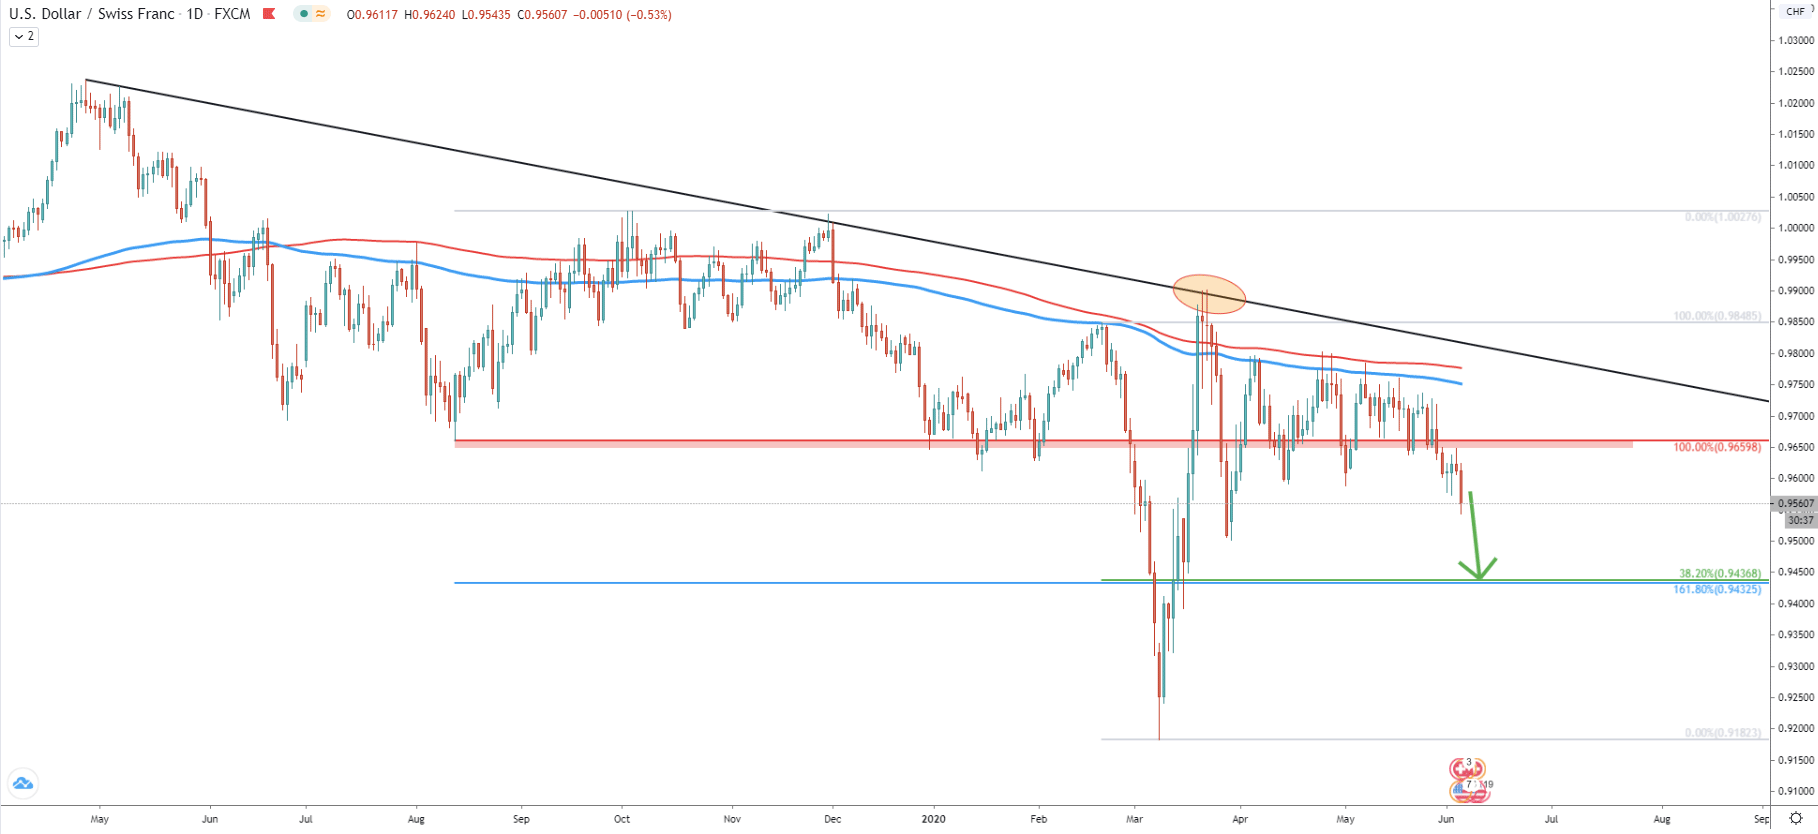
On the Daily chart price clearly is trending down, while lower lows and lower highs are being produced. Back on March 23, the price has reached the 0.9900 high, which is an extremely strong psychological resistance. What is more important is that this resistance has been rejected along with the downtrend trendline. Then slowly, but steadily, price continued to decline, breaking below both 200 period Moving Averages, Simple and Exponential. It show that sellers remain in control over the long term and price is likely to continue trending down.
Previous area of support at 0.9660 has been broken and on a small pullback, it was rejected. It seems that the downtrend continuation finally began and the price could be aiming for a new lower low. However, prior to that, there is one key support level that must be watched which is at 0.9437. It is based on two Fibonacci retracement levels, First being the 38.2% applied to the February 20 - March 9 downtrend. Second Fibs was applied to the least high, established back on October 03, 2019.
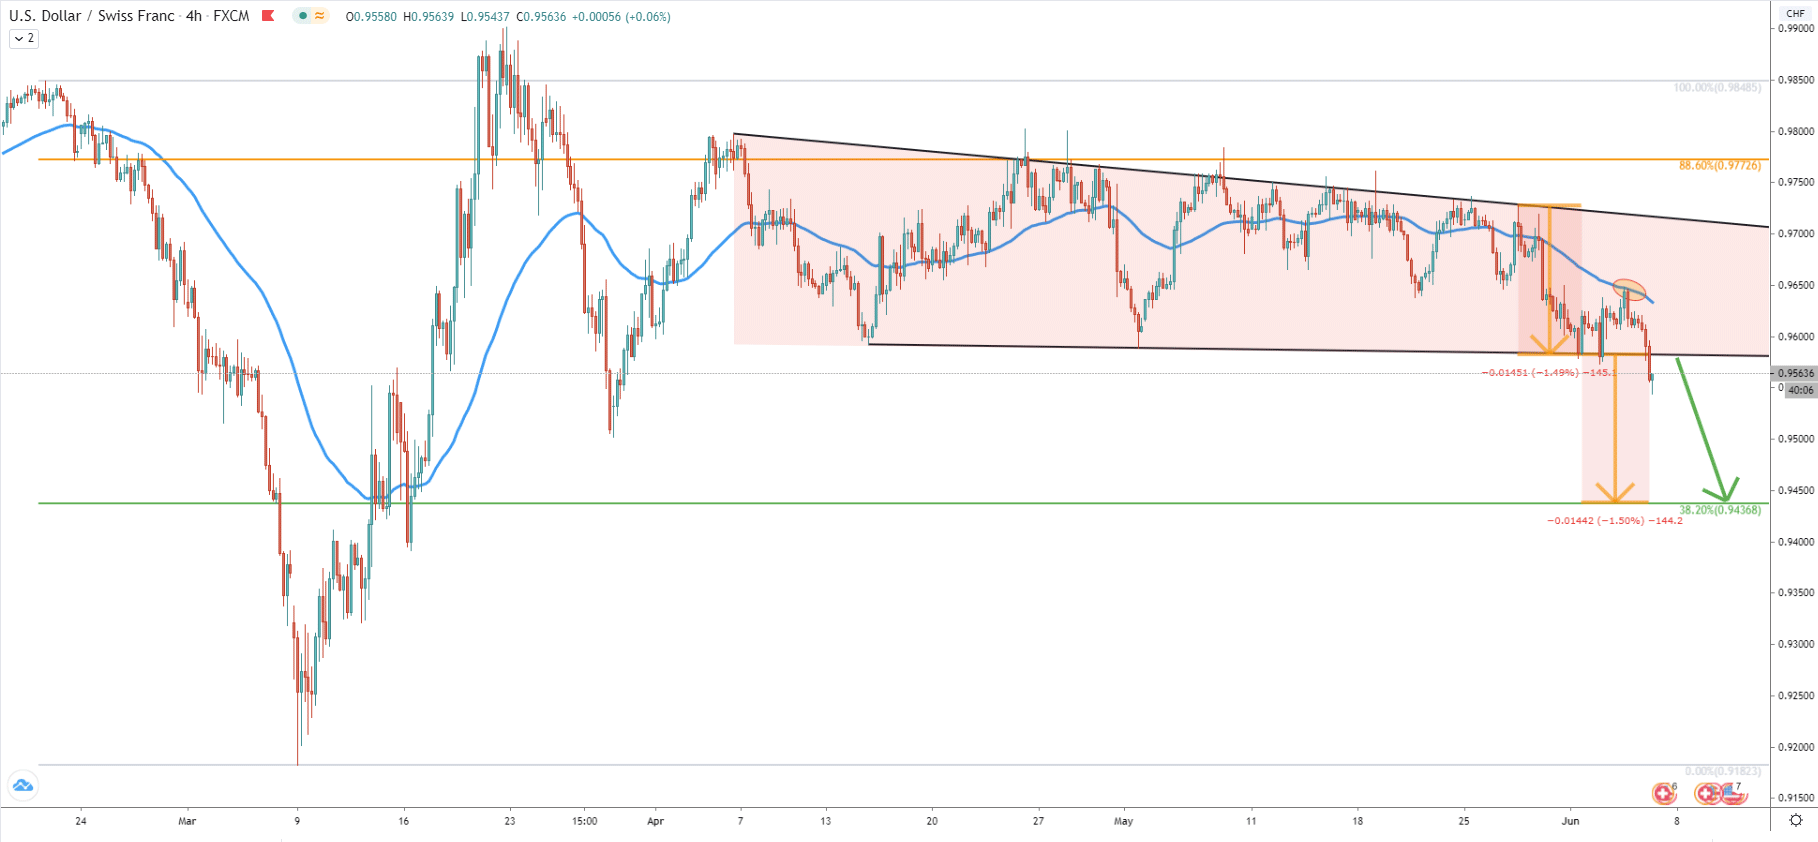
On the 4-hour chart, we can see the formation of the triangle pattern, where the price remained for the past two months. Today it finally got broken, suggesting a strong downtrend in the coming days. The downside target corresponds to the triangle height applied to the last rejection of the downtrend trendline. This means that USD/CHF could decline by 144 pips, which equals to the 1.5% within quite a short period of time.
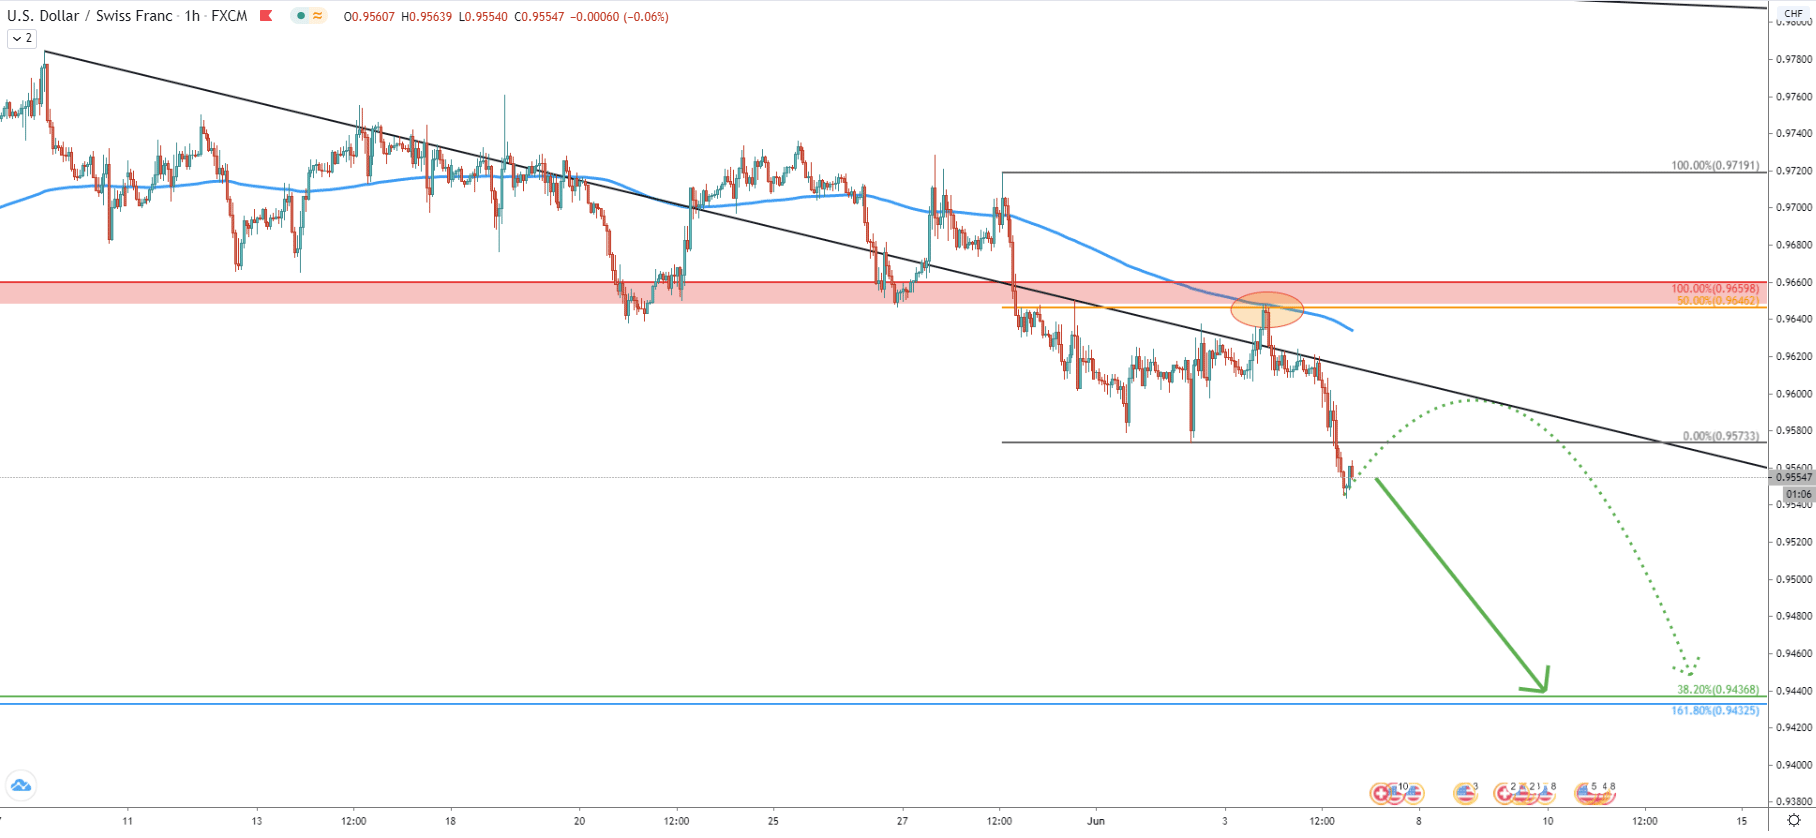
Moving on to the 1-hour chart, there was a very clean bounce off the 200 Exponential Moving Average on June 3, where USD/CHF rejected cleanly the 50 Simple Moving Average. This resulted at the beginning of a fast decline where price broke below the 0.9573 previous low. At the same time, we can see the rejection of the average price downtrend trendline, stimulating the selling pressure. Right now, USD/CHF has moved down quite substantially, which might result in a minor corrective wave up. Potentially, price can re-test the average price downtrend trendline and move towards the 0.9600 psychological resistance. This could be an ideal selling point for the bears in the short and potentially long term.
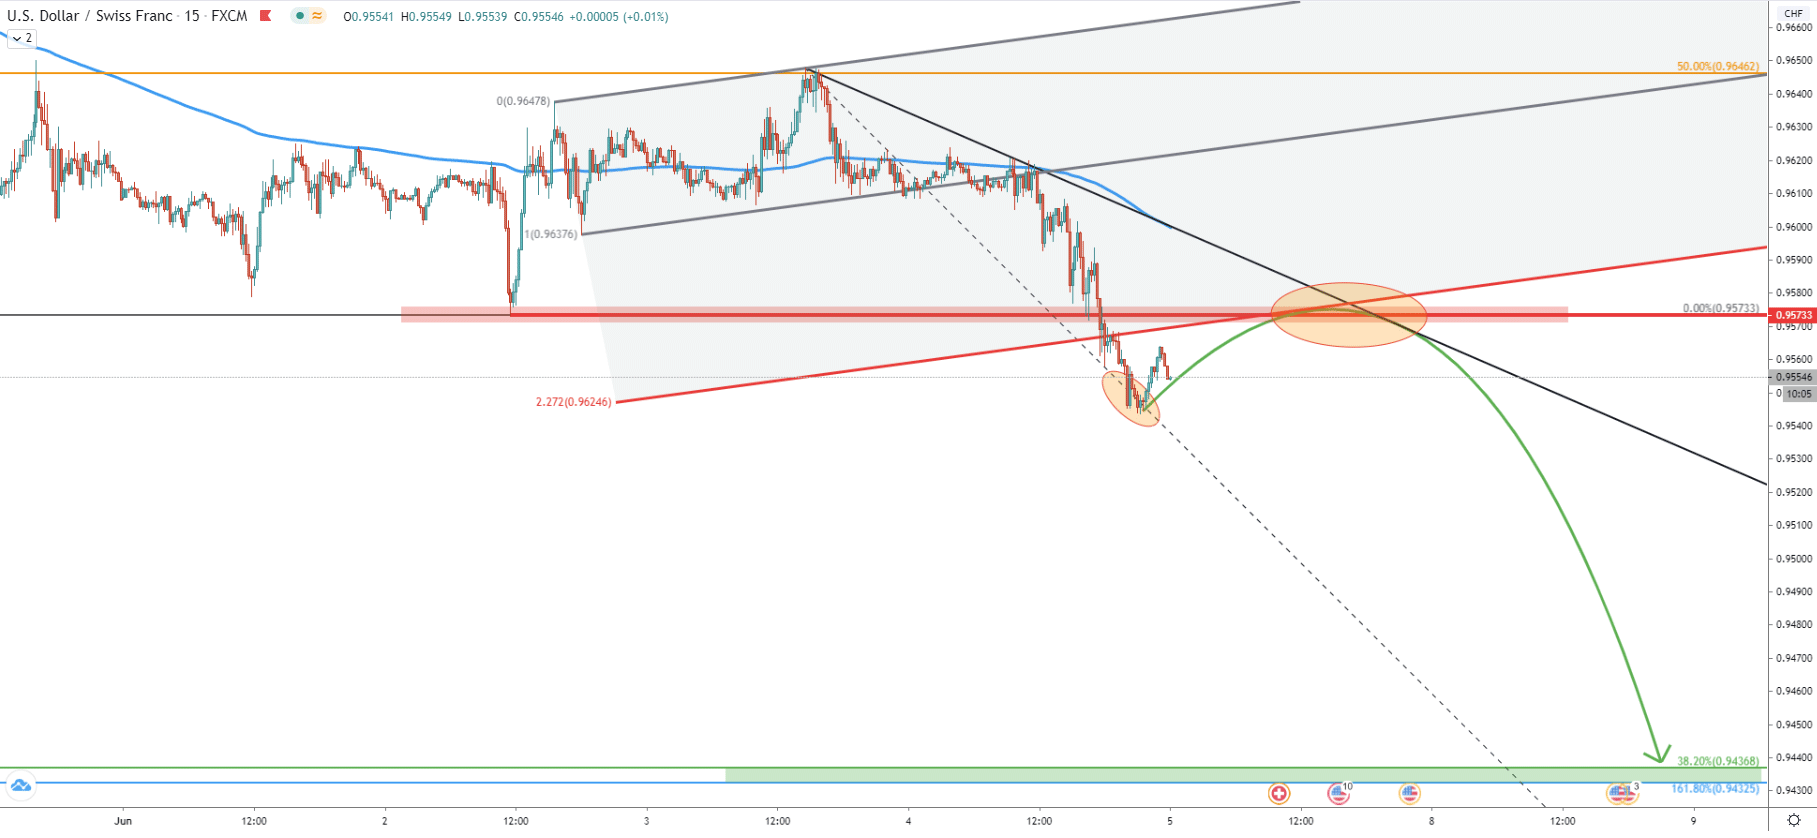
Finally, the 15-minute chart, which is mainly used to see as to how far price can retrace. Based on the previous level of resistance, the downtrend trendline as well as the 2.272% Fibonacci channel retracement level, USD/CHF can correct up to 0.9573 area in the next 24 hours. This might be an ideal selling point, considering risk to reward ratio.
USD/CHF broke below the 2-months consolidation zone as well as a triangle pattern. This is a huge selling signal for the medium to long term. But at the same time price should be expected to correct up, prior to the strong selloff.
As per the daily chart, the key resistance is located at 0.9440 area, which is confirmed by two Fibonacci retracement levels. This target is expected to be reached within 3-4 trading days.
At this stage, probability of an uptrend is extremely low, considering the most recent price action. Although anything is possible in trading, and USD/CHF can reverse to the upside. The key resistance is seen at 0.9660 and only daily break and close above this level could invalidate the bearish scenario.
Support: 0.9440
Resistance: 0.9660