
Published: March 5th, 2021
Today there was the most important news for the USD, specifically a Nonfarm Payroll. But it seems there wasn’t much reaction to it, considering low volatility and average price movement. But still, technically it looks like US Dollar is still feeling weak in the long run and this might reflect on the price of the USD/CAD.
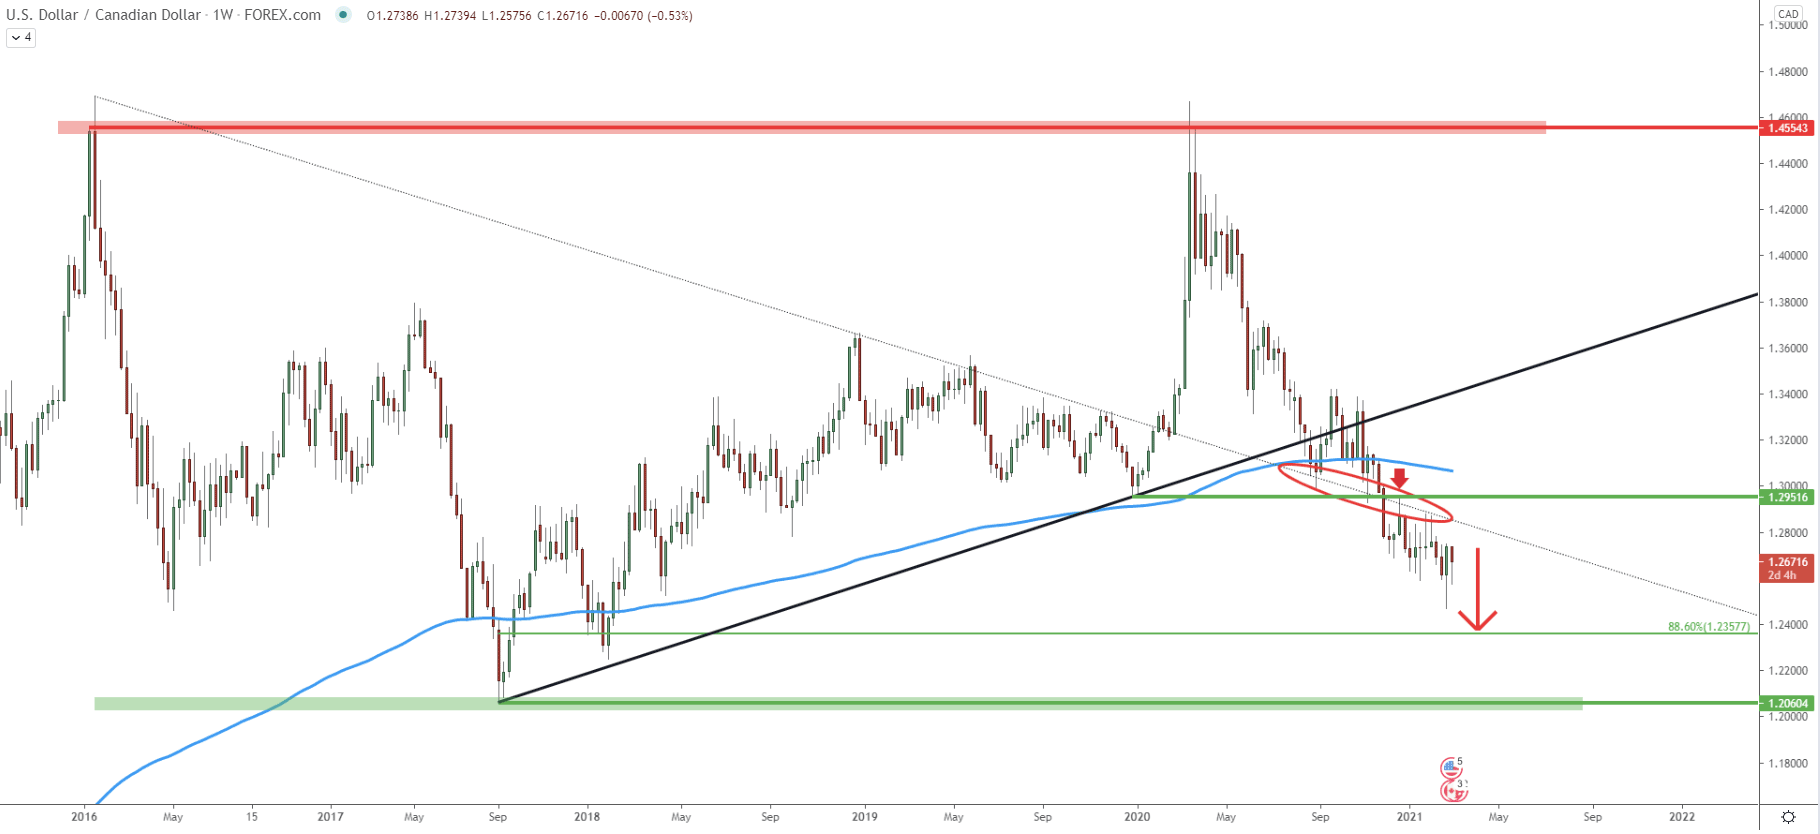
On the weekly chart, USD/CAD is still in a downtrend after the price broke below the uptrend trendline followed by the breakout of the 200 Exponential Moving aVerage. After the breakout, the pair found the resistance at the previous level of support, which is 1.2951. At the same time, the average-price downtrend trendline got rejected, which implies the validity of the downtrend.
Based on the Fibonacci retracement indicator, the nearest and perhaps the key support could be located at 1.2357, which is the 88.6% retracement level. This means that there could be another 300 pips drop, taking place during the next couple of weeks.
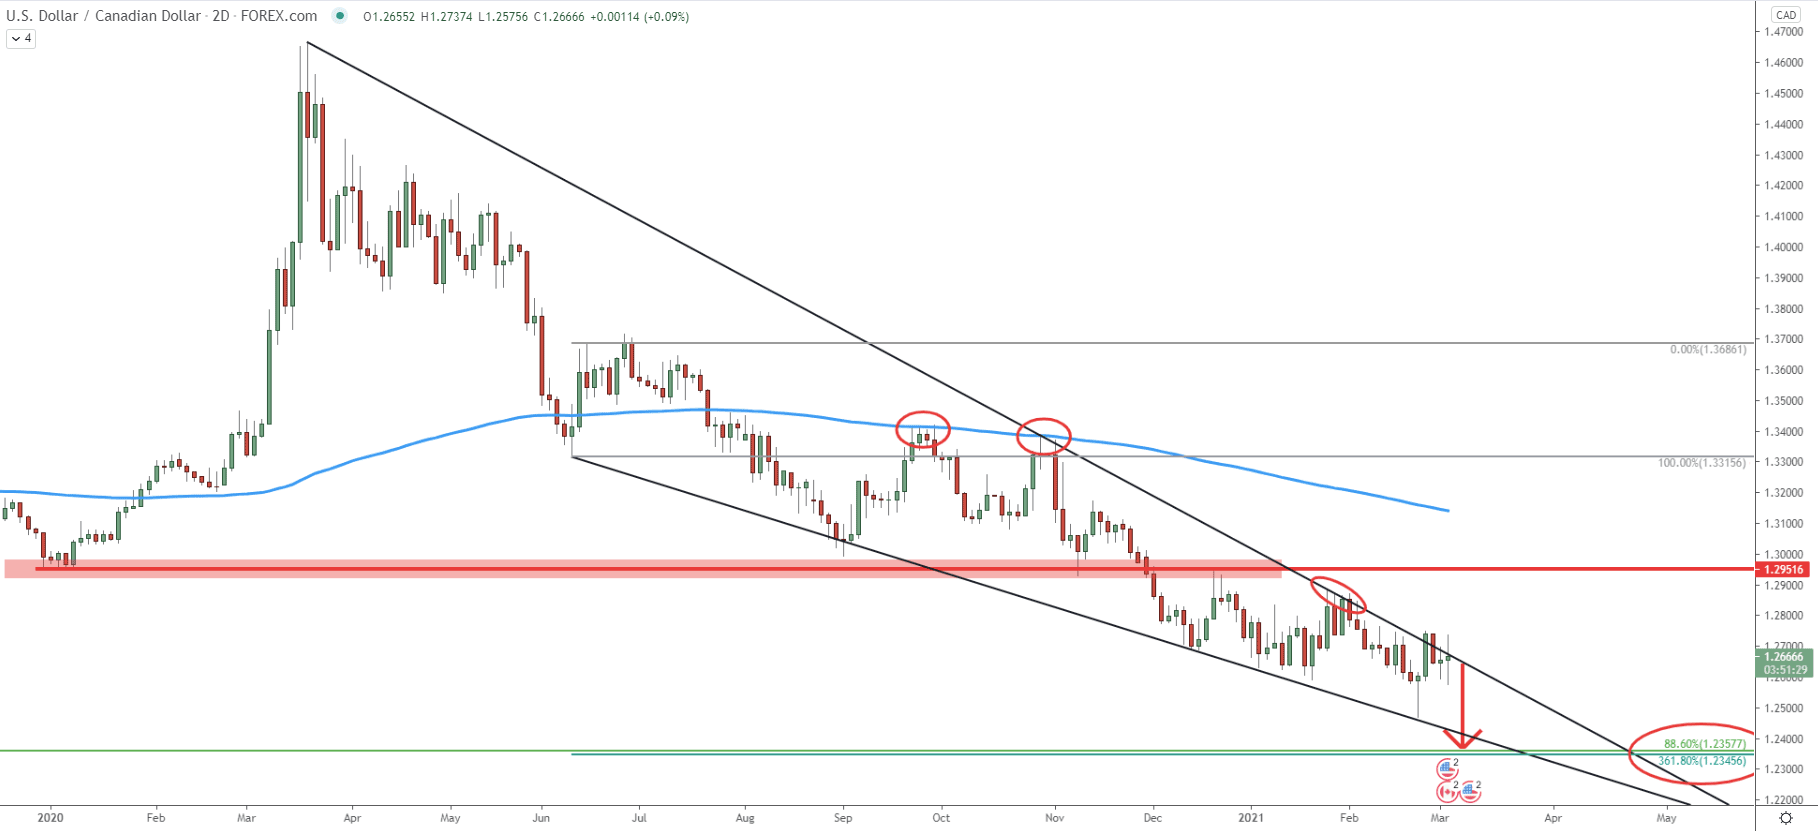
The price is clearly moving within the descending wedge pattern and still remains below the downtrend trendline. In fact, At the beginning of February, there was a clean bounce off the trendline, after which price produced a new lower low.
And if we look at the price action back in September-November 2020, USD/CAD rejected the 200 EMA twice and then broke below a massive support area near 1.2950. This was the first sign that the trend has turned bearish for the long term and we still witness this tendency today.
Perhaps the next wave will also push the price down, towards the 1.2350 area, which on this chart is confirmed by two Fibonacci retracement levels, 88.6% and 361.8% as can be seen on the chart.
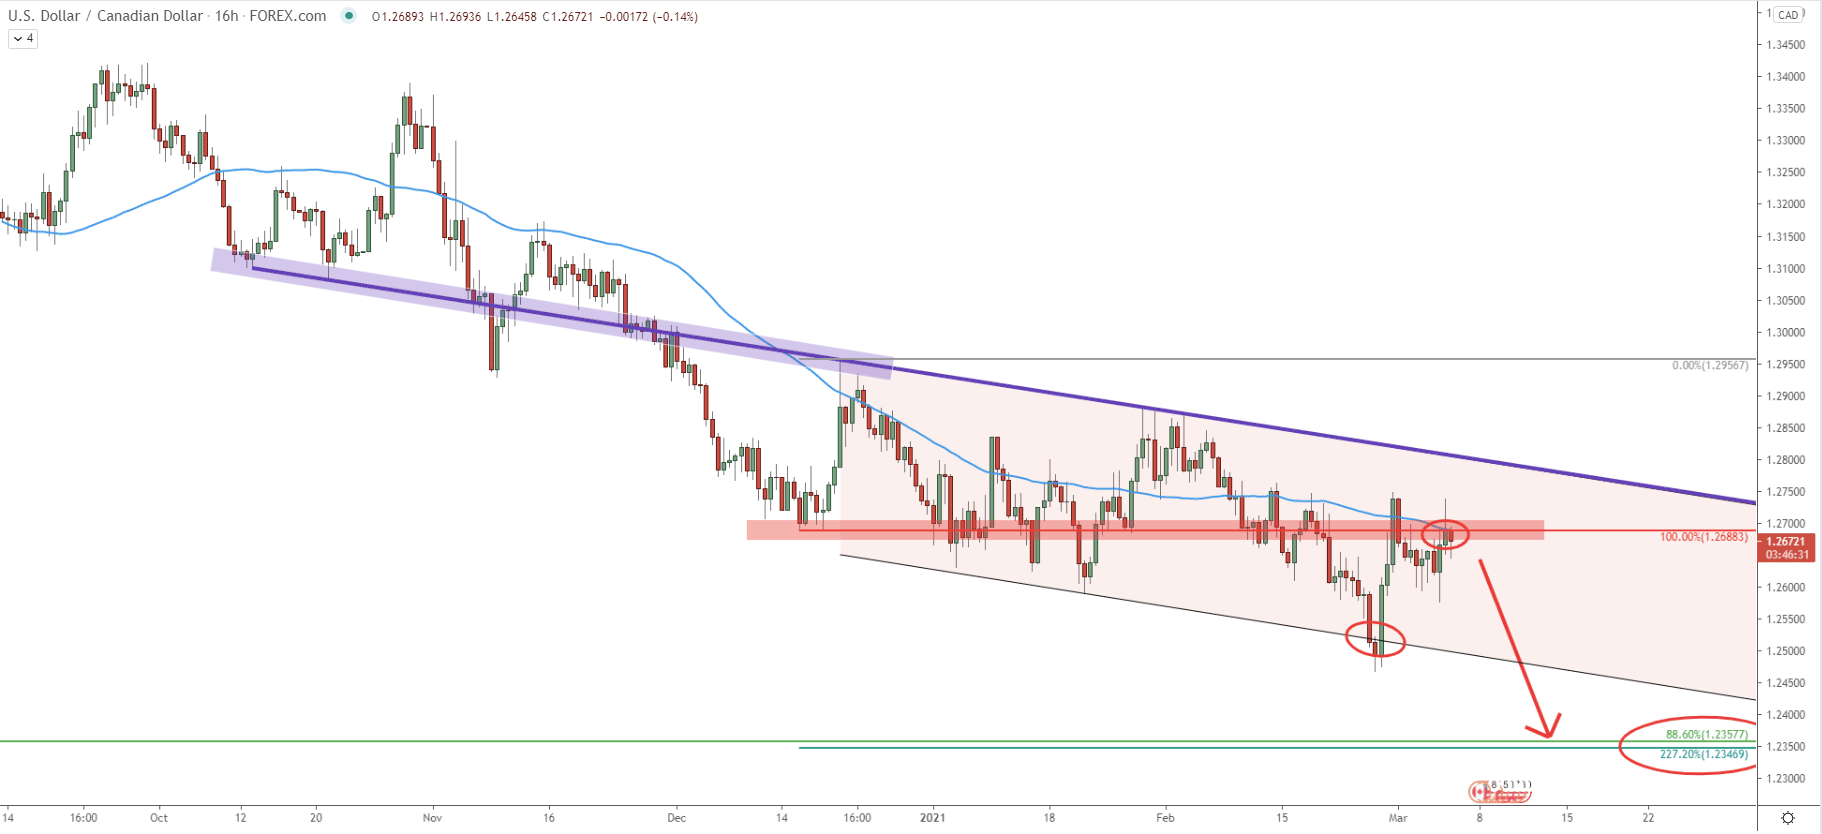
Since December 2020, USD/CAD remains below the average price downtrend trendline. In fact, this trendline got cleanly rejected at the beginning of February and up until now, the trend remains bearish. Moreover, the bottom of the descending channel has been penetrated at the end of February, suggesting that the selling pressure remains high.
Today, USD/CAD rejected the previous level of support at 1.2688, which currently is acting as the resistance. At the same time, the 50 EMA is also being rejected, implying that bears are strongly defending the 1.2688 resistance. As long as this level resistance level is being respected, bears will continue to dominate. This should result in a price drop by 320 pips, as the key support is located near 1.2350 and now confirmed by yet another Fibonacci retracement level.
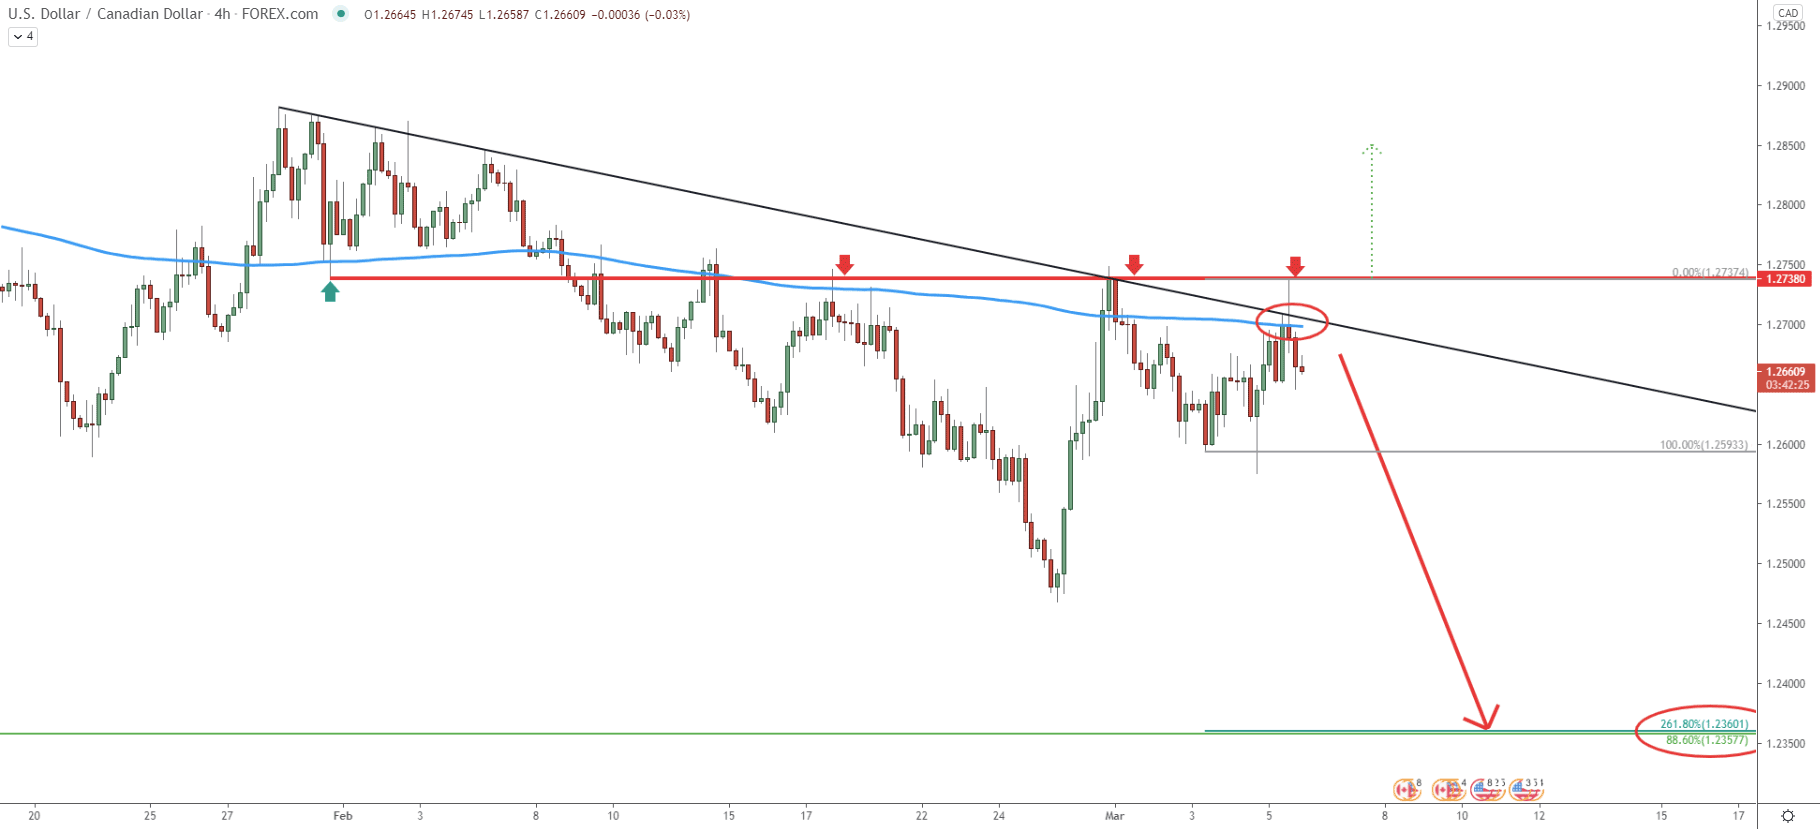
The 4-hour chart goes to show, how important the 1.2740 resistance area is. Currently, it is a key supply area, which has been rejected 3 consecutive times. But today, not only price bounced off this level, but also rejected the 200 EMA as well as a simple downtrend treeline. Obviously, the trend is strongly bearish and probability is in favor of a downside move. And yet another, 4th Fibonacci support is pointing out to the 1.2350 demand area, which is likely to be a strong profit-taking zone if/when reached.
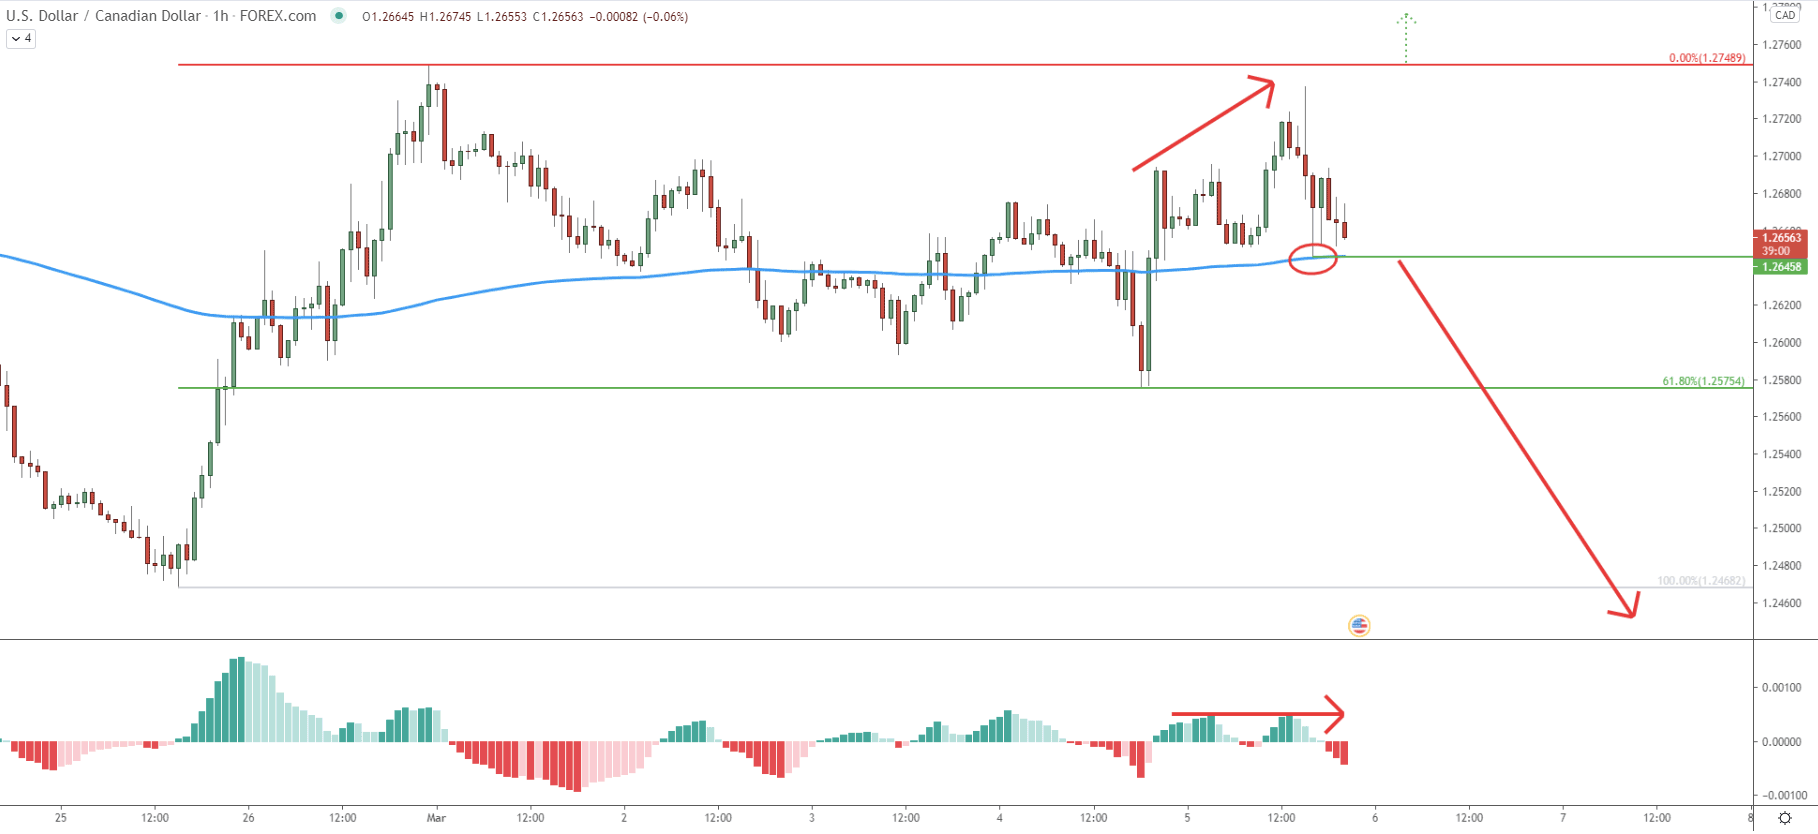
On the hourly chart, the MACD oscillator has formed a bearish divergence, suggesting that the price is about to initiate a downtrend. Nonetheless, the price has cleanly rejected the 200 EMA at 1.2645, which is now acting as the support. For the downtrend to start, this support has to be broken, with the 1-h close below the 1.2645 level. When/if this occurs, sellers are likely to step in and this should be the time when the downtrend will accelerate, resulting in a fast price drop, potentially by over 300 pips.
USD/CAD price remains under strong selling pressure as the key resistance near 1.2750 has been rejected multiple times. As long as this resistance is being respected, the price can potentially drop by 300-320 pips.
As per the weekly, 2-day, 16-hour, and 4-hour charts, the key support/demand area is located near 1.2350. This level is confirmed by 4 different Fibonacci retracement levels, acting as a magnet for the price.
As per the hourly chart, a break above the 1.2750 resistance area will immediately invalidate the bearish outlook. In this case, the USD/CAD trend can be expected to start reversing to the upside, although this princess might take quite an extended period of time.
Support: 1.2645, 1.2575, 1.2350
Resistance: 1.2688, 1.2750, 2950