
Published: May 8th, 2020
We’ve analyzed multiple Canadian Dollar pairs. From what it looks, is that CAD continues to lose in value against most major fiat currencies. Perhaps it is the effect of the US Oil significant drop in price? Perhaps, but this tendency could be either medium or long term. Right now, we could be right at the beginning of a massive CAD decline. Today we’ll observe USD/CAD, the most popular Canadian Dollar pair.
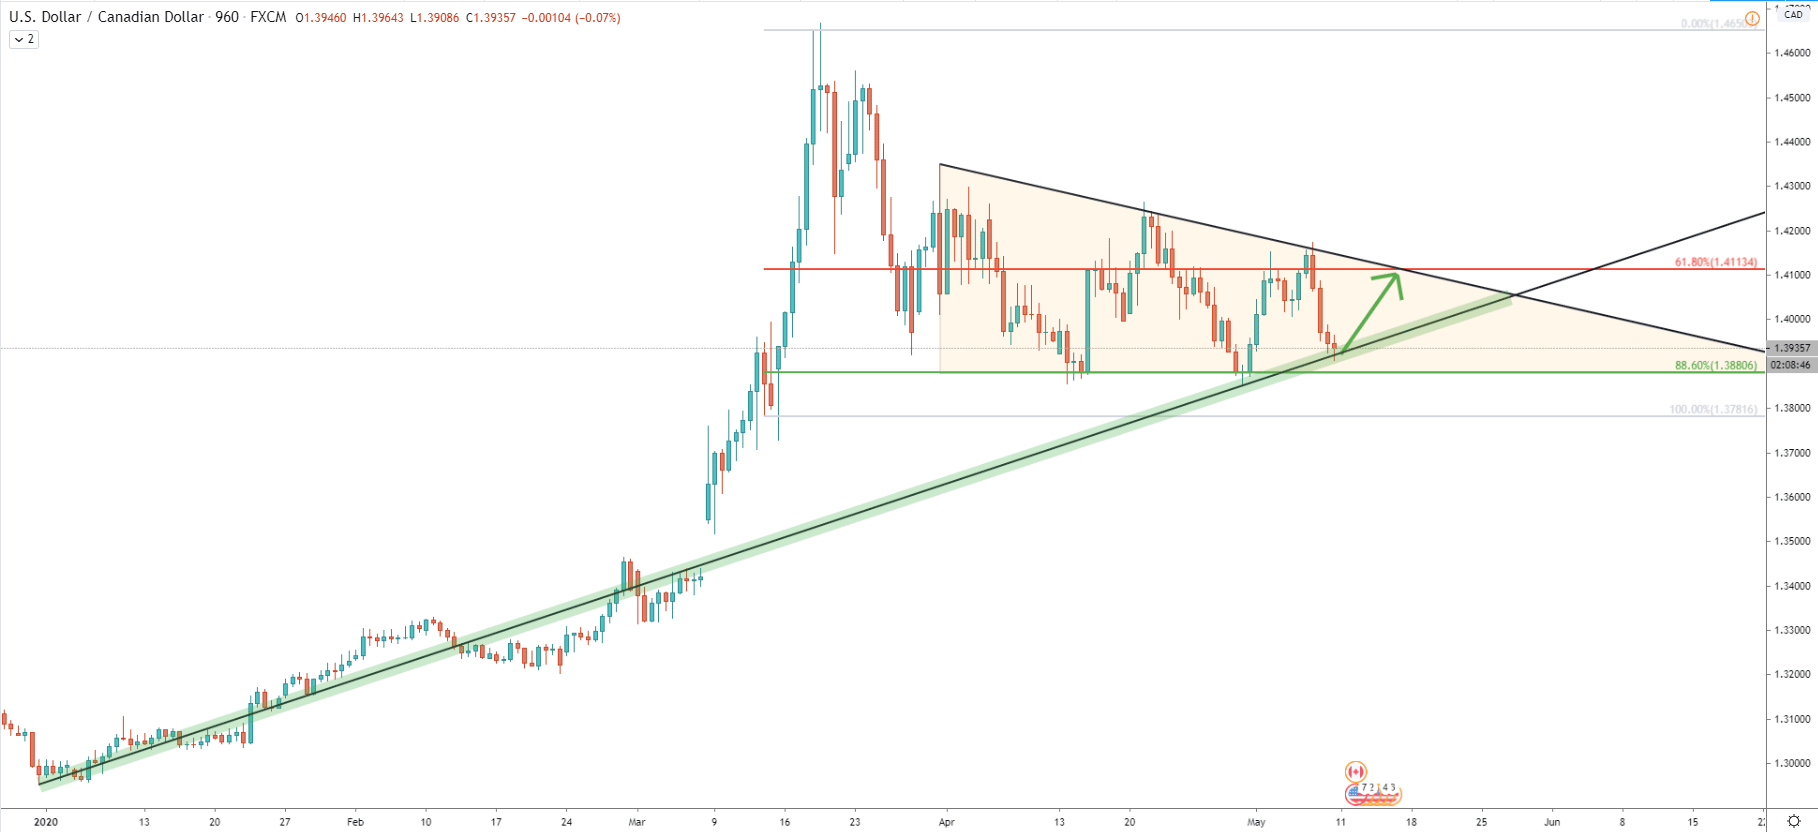
First off, there is an average price trendline applied on the 16-hour timeframe. Price still remains above the trendline and recently, it has been rejected for two consecutive times. Fibonacci applied to the last wave up goes to show the support and resistance levels, where price has been stuck for quite some time. The support is located at 88.6% Fibs, which is 1.3880 area. It has been rejected twice, producing a double bottom. On the upside, the nearest resistance is seen at 61.8% Fibs, which has been rejected at least one time already. This is the 1.4100 price area, which also corresponds to the downtrend trendline. Overall, it is clear that USD/CAD is forming a triangle pattern. While there was no break above or below the pattern, the consolidation phase will remain valid. Considering that pair corrected down, there might be an interesting buying opportunity coming up early next week.
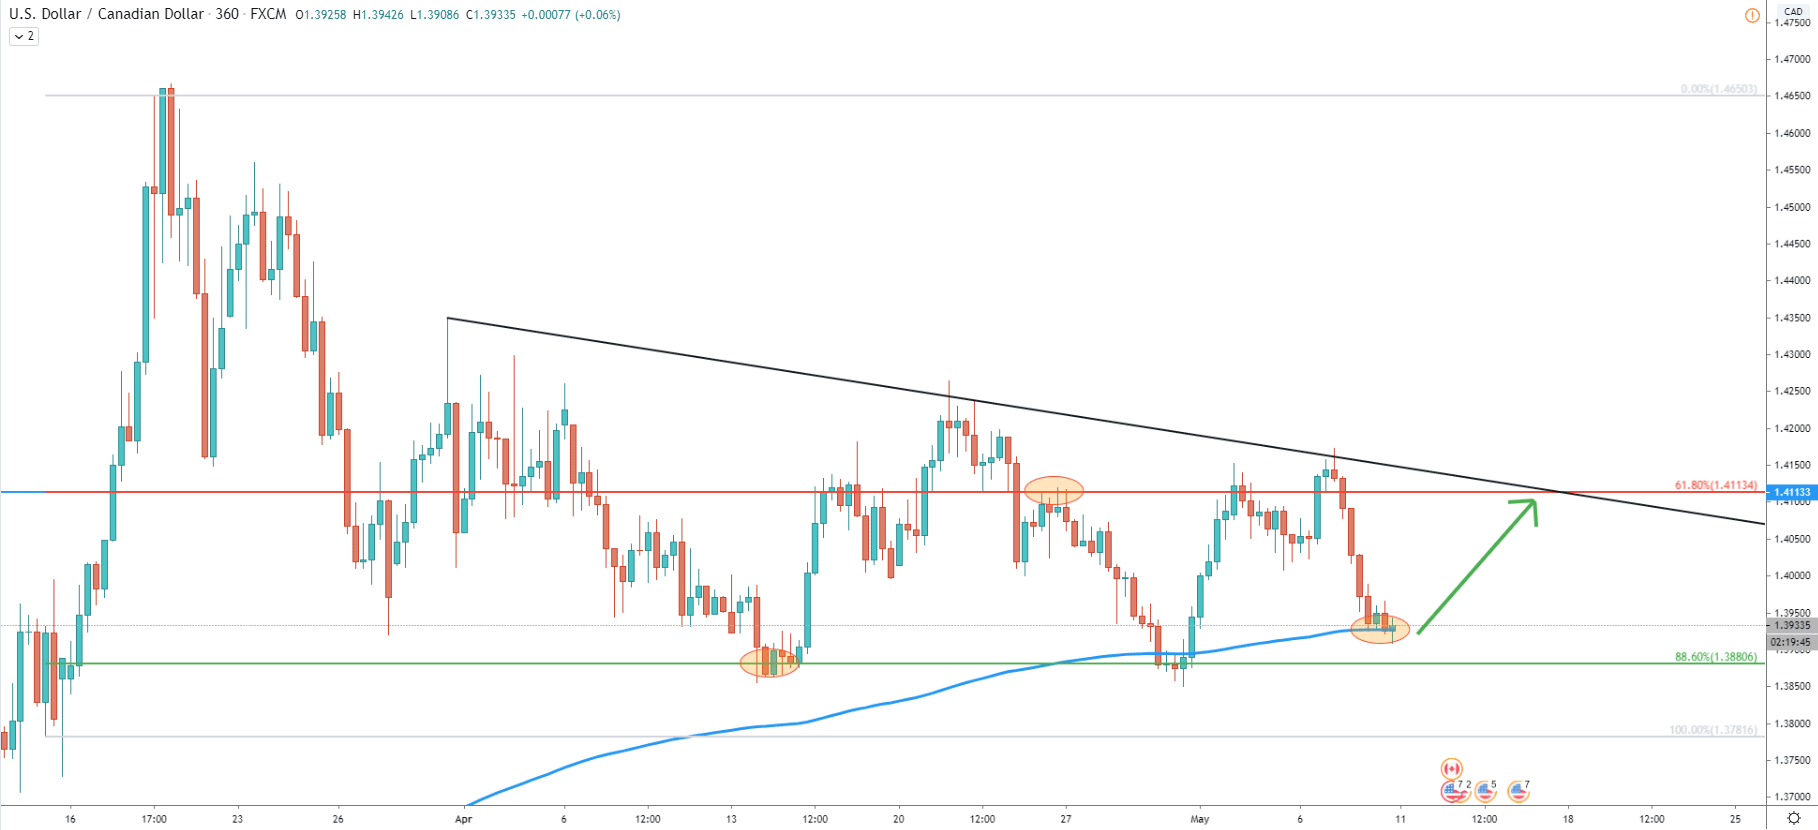
On the 6-hour chart, USD/CAD has reached and rejected the 200 Exponential Moving Average. This proves that the long term uptrend is still intact. While the nearest resistance is located at 1.4112, the price can rise much further. Although for this scenario there must be a daily break and close above 61.8% Fibonacci retracement level. In this case, USD/CAD is likely to move as high as 1.4650, where the previous top was formed back on March 19.
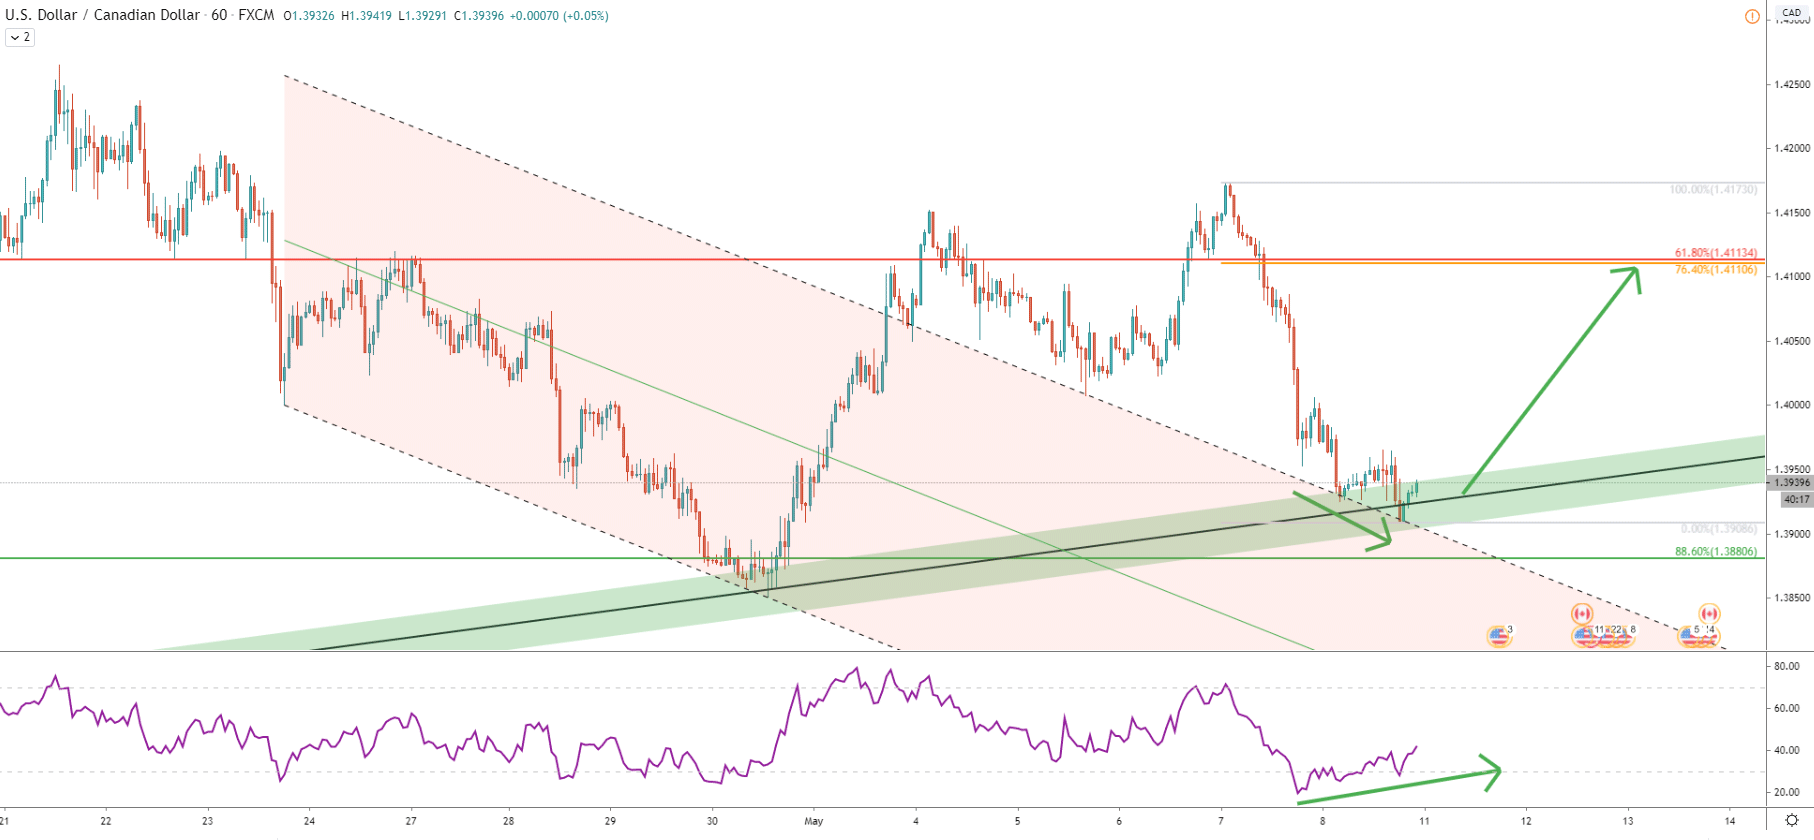
We have applied the descending extended channel to the 1-hour chart. What is interesting, is that today’s price has reached the bottom of the upper trendline of the channel. At the same time, the RSI oscillator formed a bullish divergence, suggesting a trend reversal to the upside. Finally, the upside target as per the 16-hour chart cleanly corresponds with the 76.4% Fibonacci retracement level applied of the most recent correction down. This proves that bulls are getting ready to use the buying opportunity any time, potentially coming Monday or Tuesday.
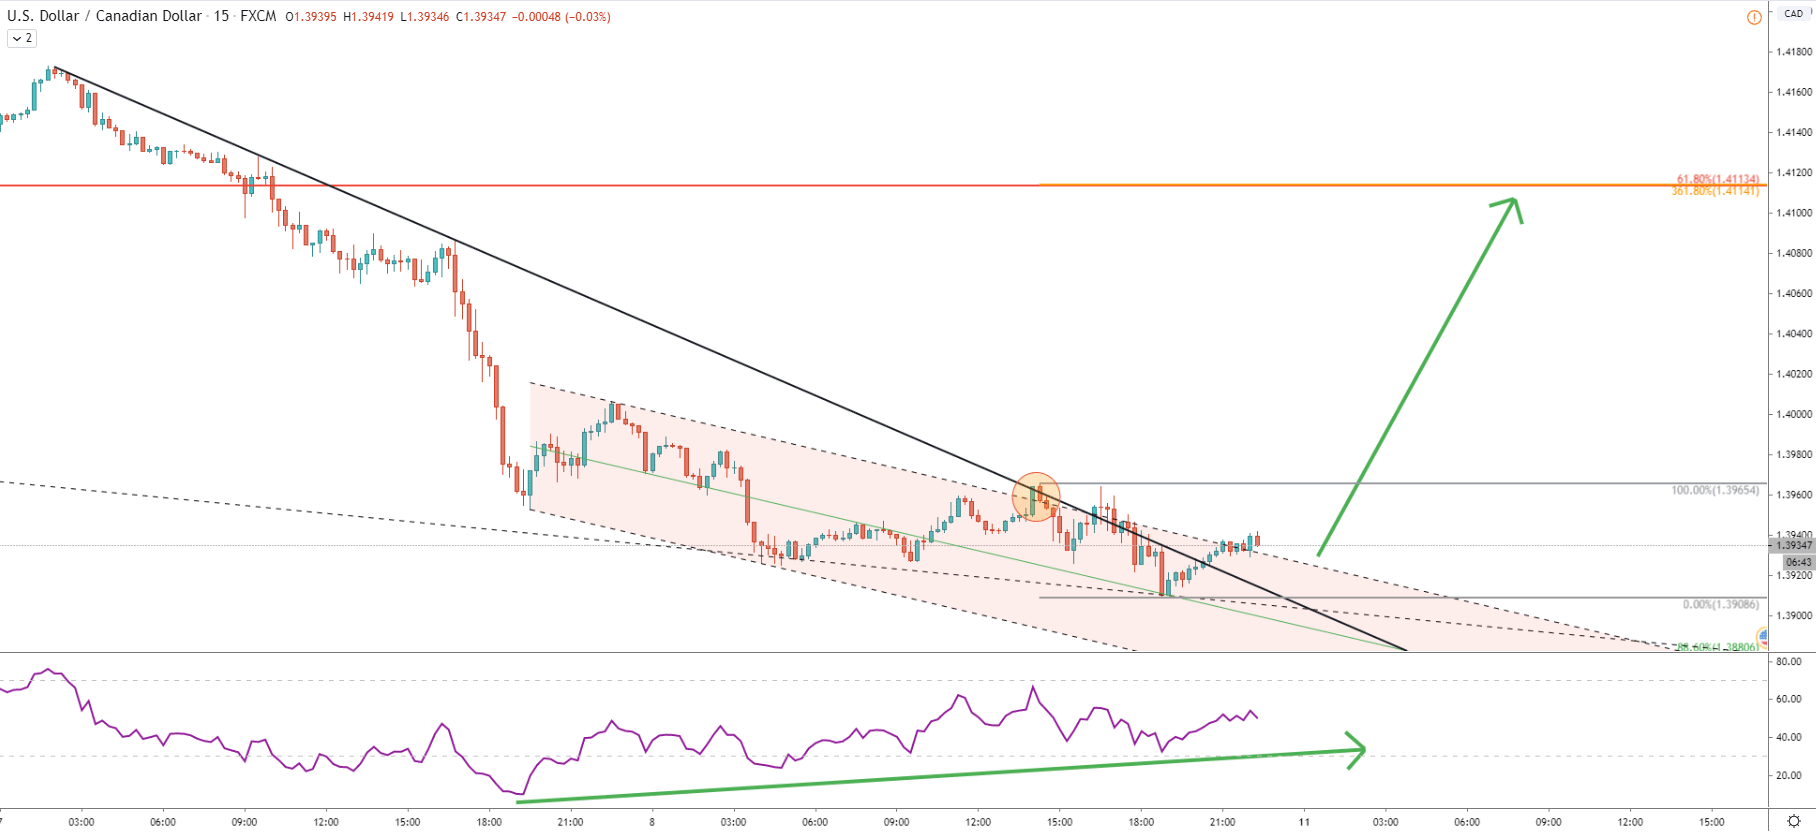
The descending channel has been broken, along with the downtrend trendline. While price continued to decline, RSI continued to form a bullish divergence even on the smaller timeframe. Fibonacci, applied to the downside wave after breaking the trendline and the channel, also corresponds to the 1.4112 upside target, where 361.8% Fibs is located.
All-in-all, USD/CAD continues to consolidate, in the longer timeframe. While the price has corrected down quite significantly, it might provide a 180 pip buying opportunity in the medium term.
As per the 15-minute, 1-hour, and 16-hour charts, there is only 1 key resistance. This is 1.4110 area, which is confirmed by 3 different Fibonacci retracement levels.
The downtrend can only become valid upon the break below the triangle pattern. The lowest price, printed at the triangle support was 1.3850. Therefore, only daily break and close below this level, will confirm the downtrend, and obviously bullish outlook will be completely invalidated at that point.
Support: 1.3900, 1.3850
Resistance: 1.4110