
Published: January 14th, 2021
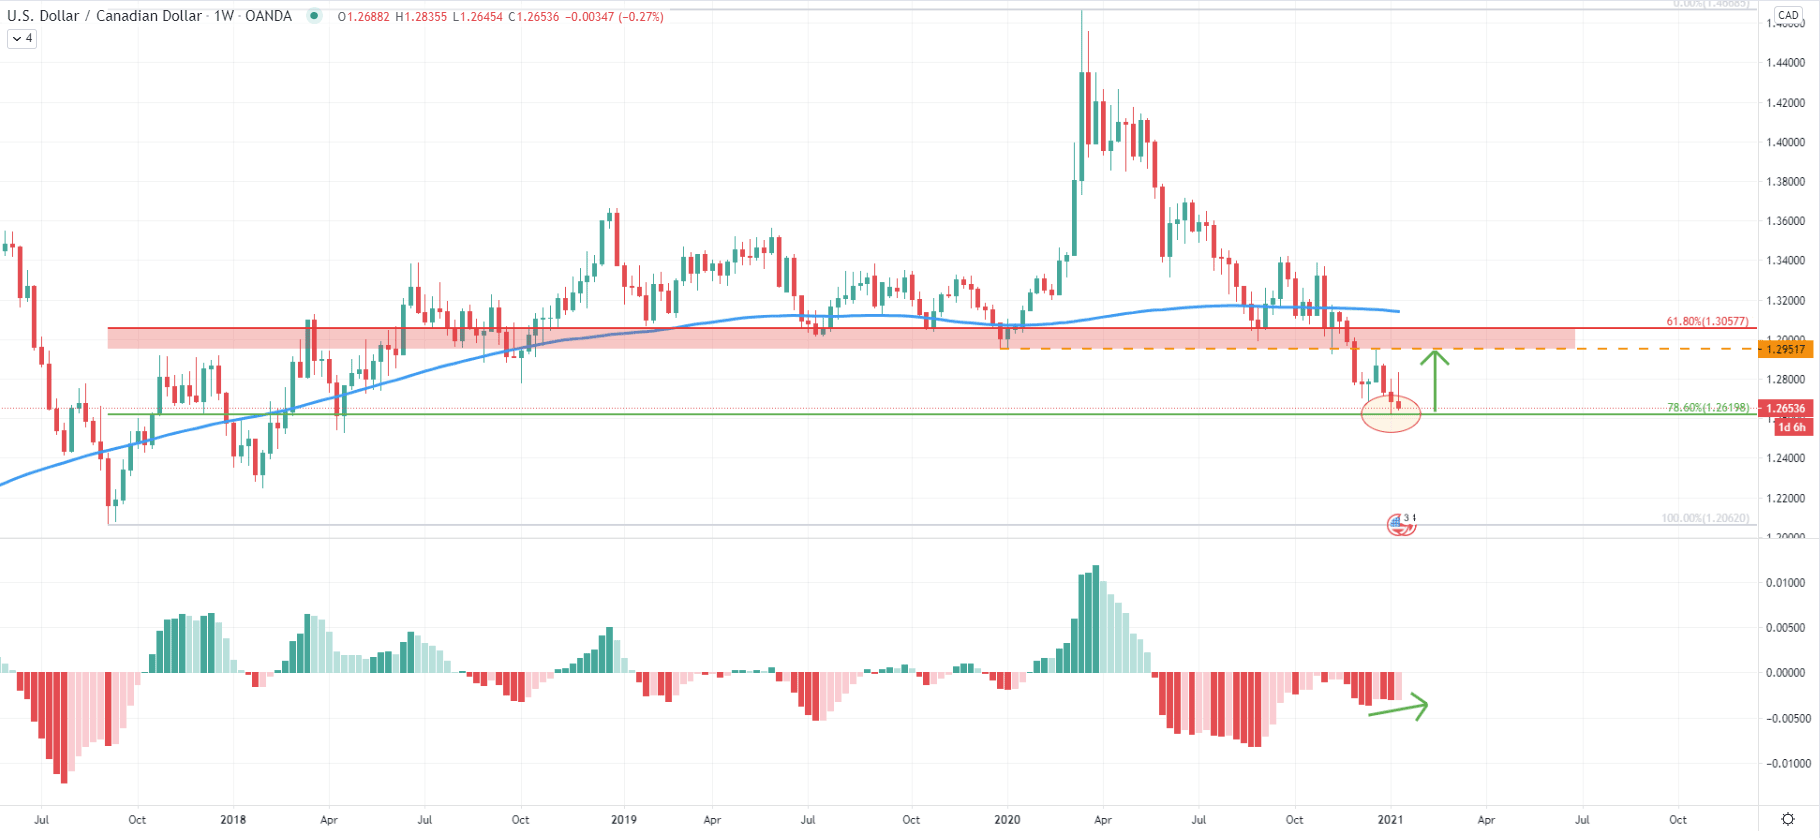
On the weekly chart, the USD/CAD trend remains heavily bearish, especially after the price broke below the 200 Simple Moving Average as well as a key support area located between 1.2950 - 1.3050. But last week, the price has reached and rejected 78.6% Fibonacci support, while the MACD oscillator formed a bullish divergence. This might imply a potential corrective move to the upside, to re-test the current resistance area which previously was the support.
The resistance is also confirmed by a 61.8% Fibonacci retracement level, and if USD/CAD will be able to rise that much, the growth would be nearly 300 pips. All-in-all, as long as USD/CAD remains above the 1.2920 Fibonacci support, the potential for the correction should be considered, at least a minor pullback. Besides, the MACD oscillator is currently forming a bullish divergence, which might be the very first sign of a correction up.
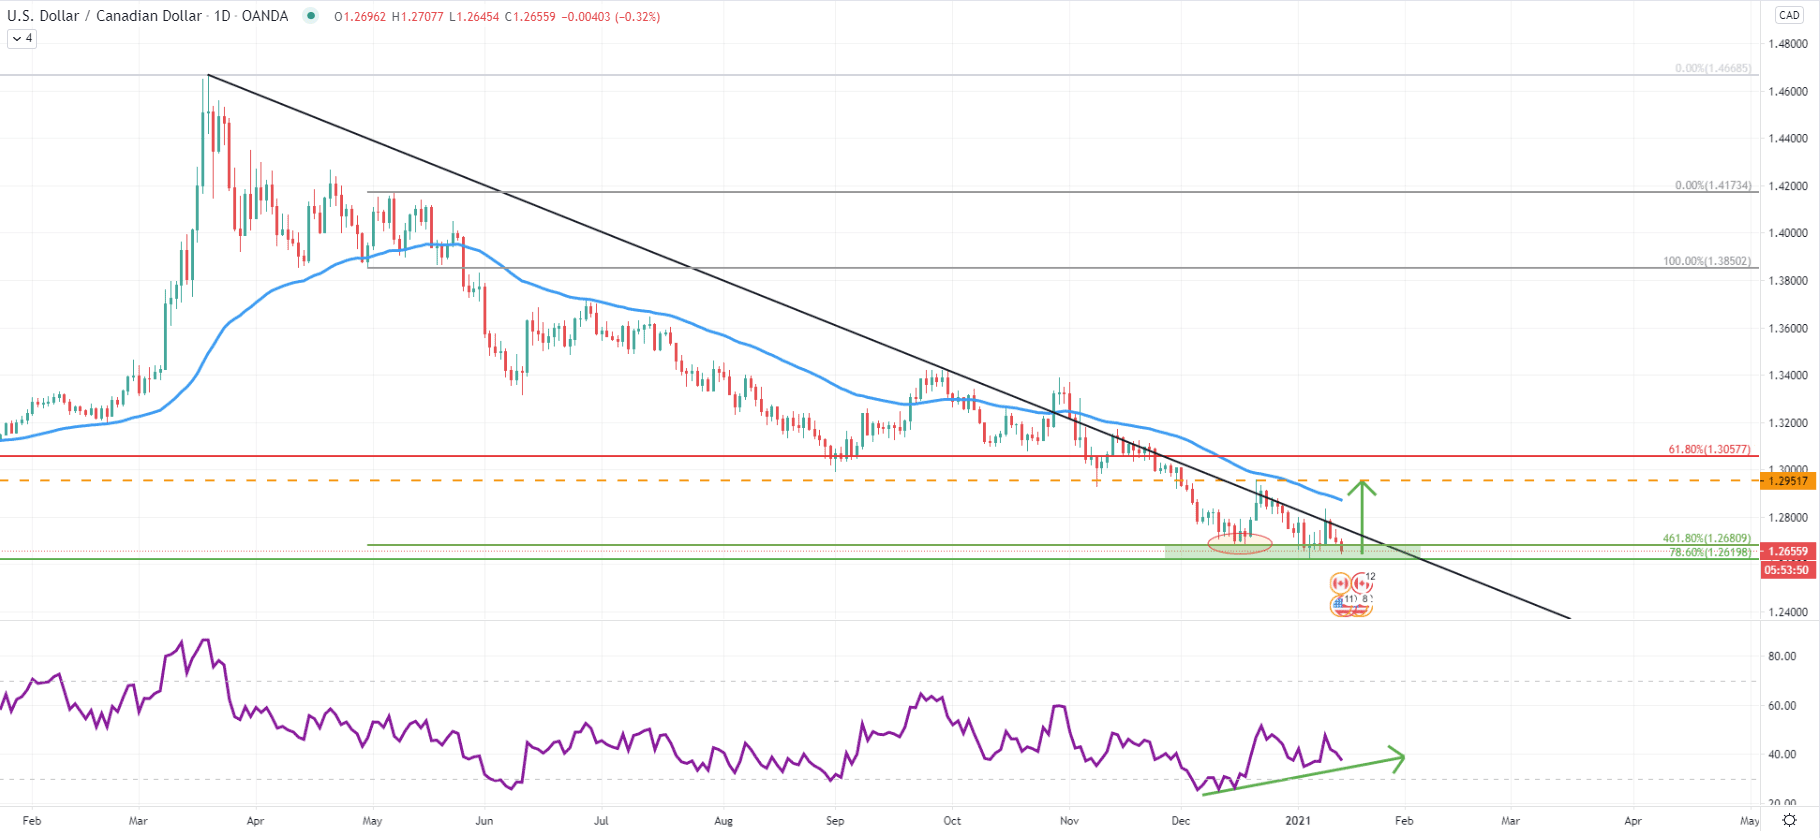
On the daily chat price remains below the downtrend trendline, with the recent rejection occurred at 1.2950 level. This is a previously mentioned supply area, which has been respected cleanly as can be seen on the chart. However, Fibonacci applied to the corrective move up after price brake the 50 Exponential Moving Average for the first time, shows taht 461.8% retracement level was rejected. This clearly shows that the support area has been formed between 1.2620 and 1.2680.
At the same time, the RSI has formed a bullish divergence, which we already saw on the weekly chart. Yet again, this could be additional confirmation that bulls are attempting to take control, either for the short or medium-term.
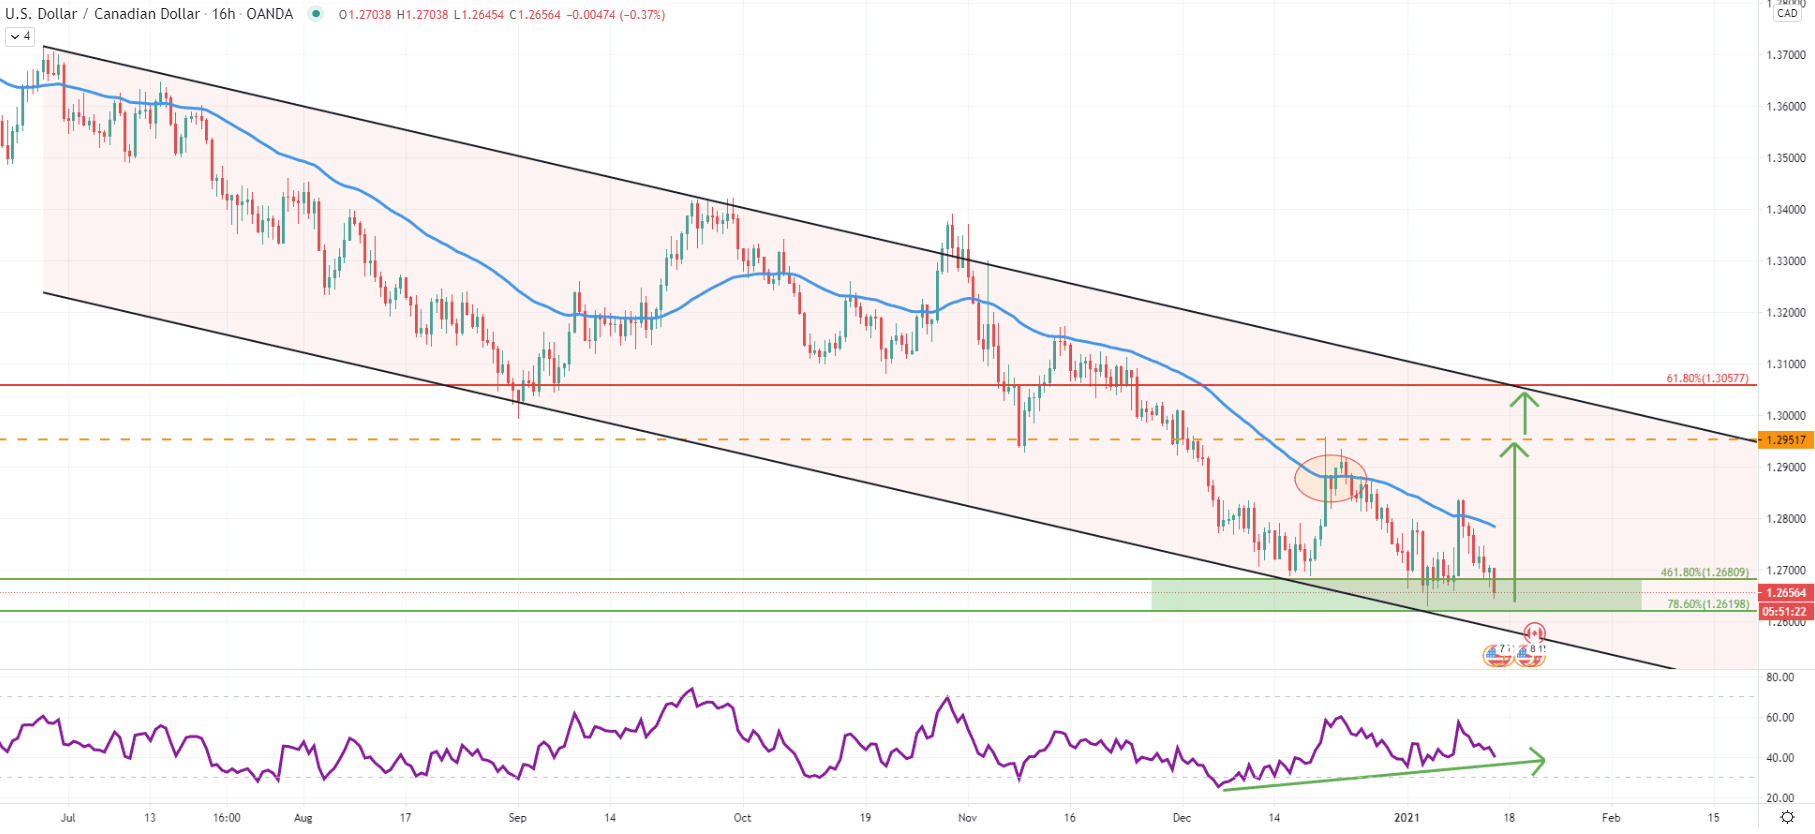
On the 16-hour chart, the price continues to move within the descending channel, while the price recently tested the bottom of the channel. The RSI oscillator again printing a bullish divergence and while the price is at the support zone, this could be an attractive price area for buyers. Moreover, right now USD/CAD could be forming a double bottom, which makes 1.2620 an important support. But the most important level could be the 1.2600 psychological support, which can still be tested before/if an upside correction will take place.
Based on teh top of the channel, if the pullback will occur, it might be a relatively fast upside move. The price could be rising towards the nearest resistance level at 1.2950, which recently got rejected along with the 50 Exponential Moving Average. If it gets broken, then USD/CAD is likely to test the top of the descending channel, reaching 1.3050 Fibonacci resistance.
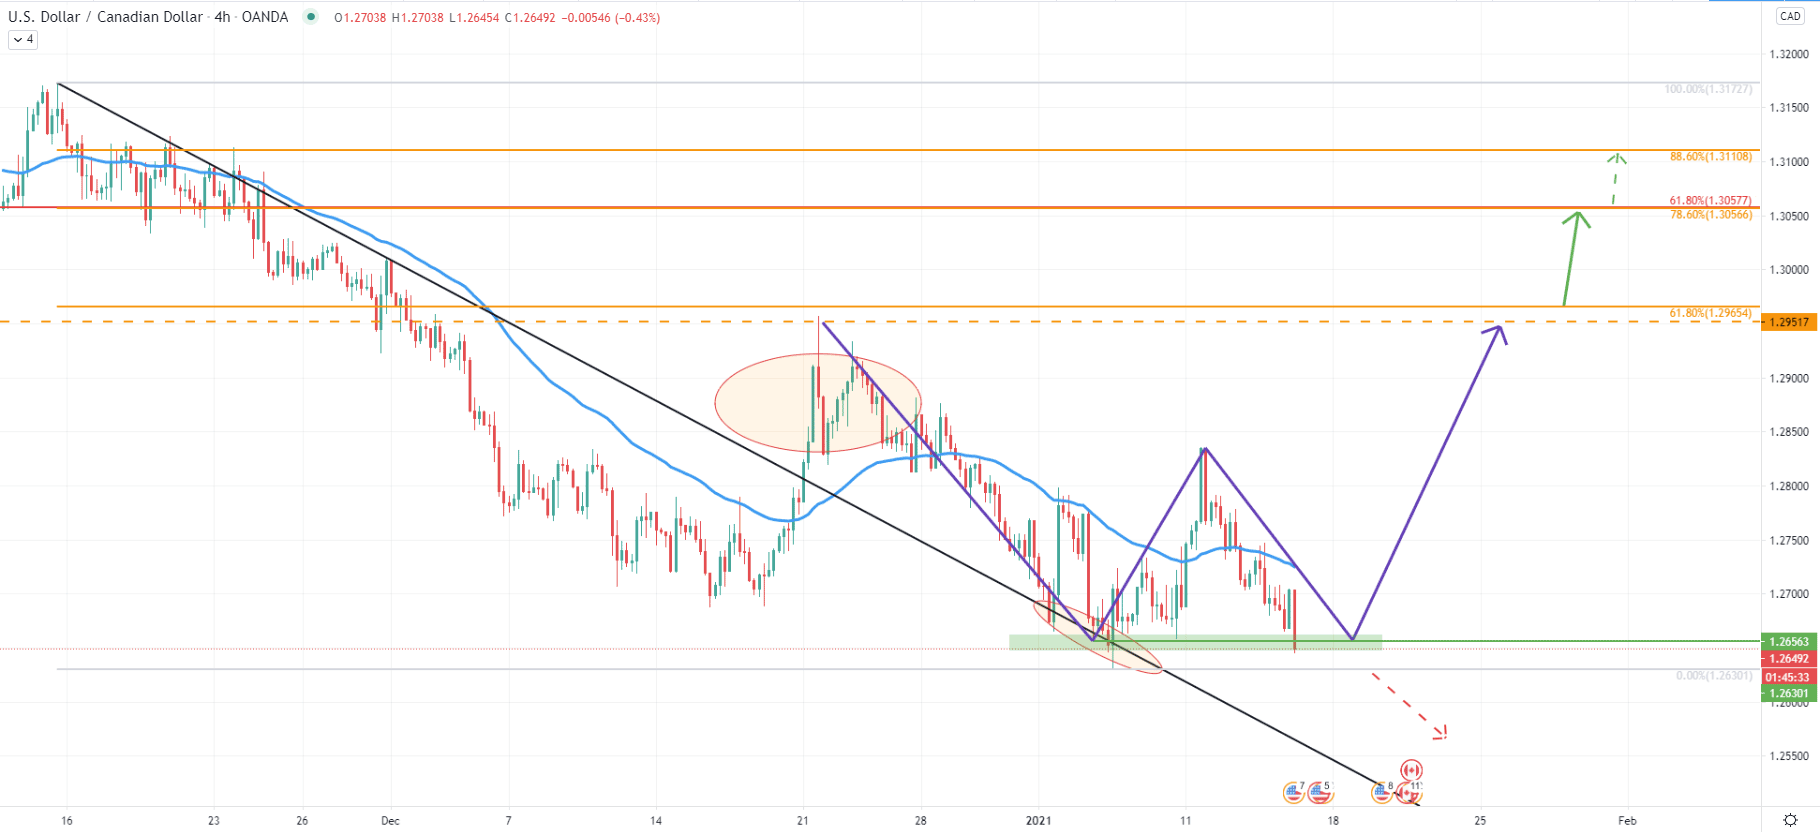
The 4-hour chart clearly shows that the double bottom could be forming. It is too early to say that with confidence because, in order to confirm it, higher highs and higher lows pattern must be in place. Right now the key support area is located between 1.2630 and 1.2600 and it is extremely important that the daily closing price will stay above the 1.2600 psychological support in order for USD/CAD to initiate a corrective move up.
Fibonacci retracement indicator was applied to the overall move down, which goes to show multiple resistance levels. The nearest is 61.8% Fibs at 1.2965, which corresponds to the 1.2950 resistance area. Then it’s a 1.3056 level, which corresponds to 61.8% Fibs as per the daily chart and 78.6% Fibs. But this may not be the end of the uptrend, as the final resistance is at 1.3108, which is 88.6% Fibs.
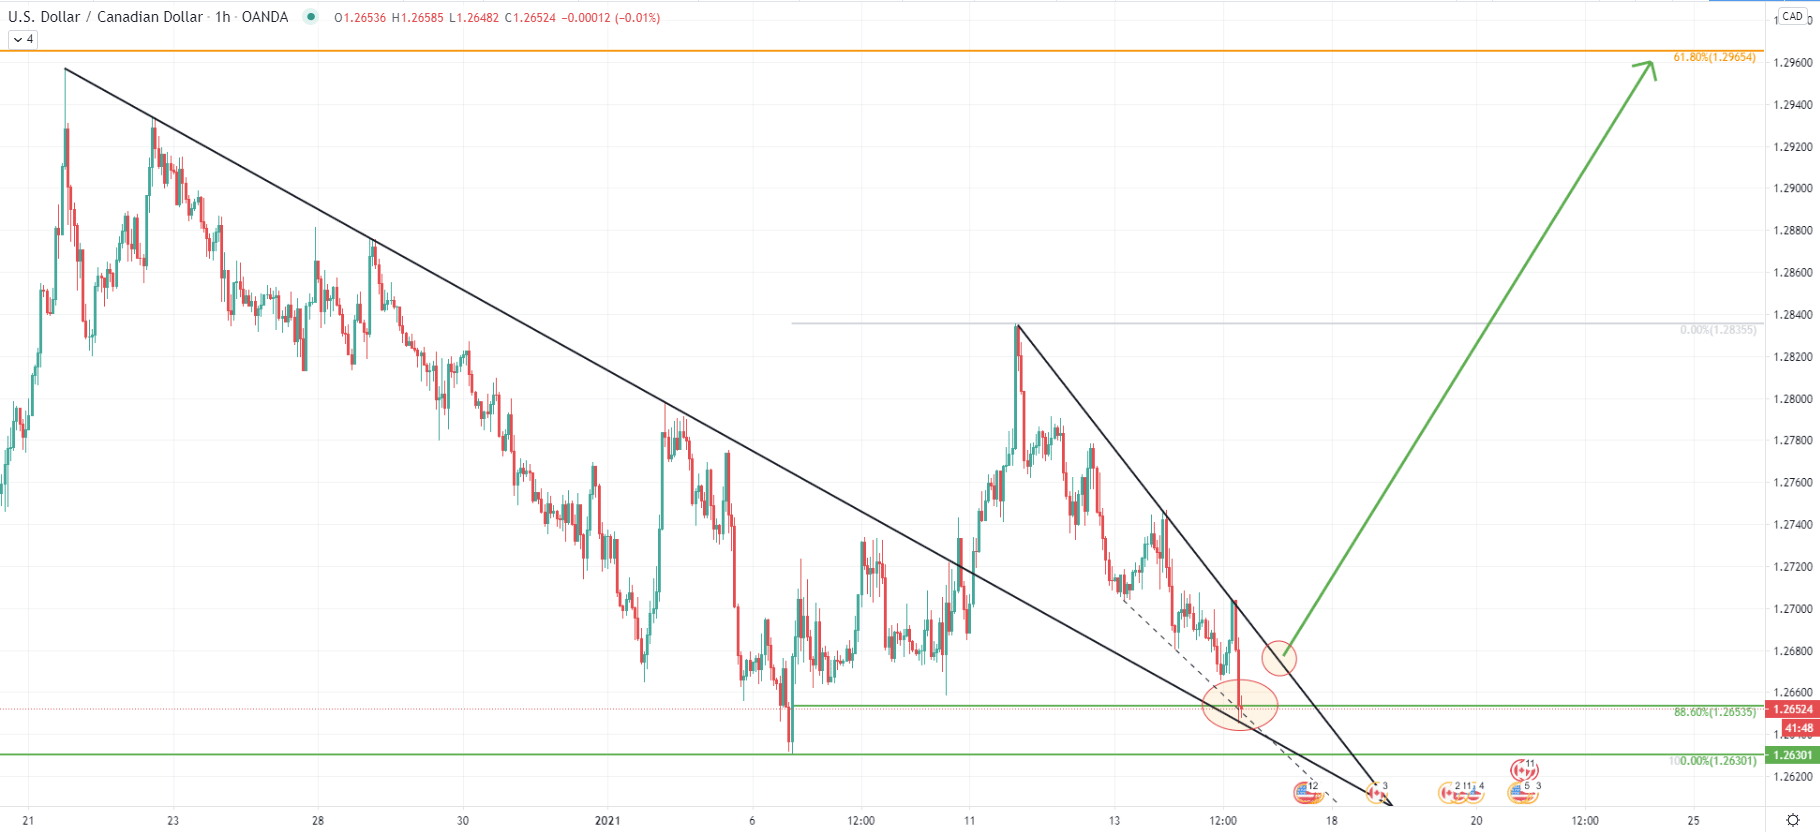
On the hourly chart price broke above the downtrend trenldine, after which the downtrend continued, sending the price back to the support area. But at the same time, it can be seen that the trendline which got broken is currently acting as the support, along with a minor support downtrend trendline. The current downtrend, which remains to be valid, must be penetrated for bulls to get interested.
Therefore, some consolidation is likely to take place on USD/CAD, during which it is important that 1.2600 will be respected. When/if the downtrend trendline will be broken, perhaps it will be the final signal of the incoming upside move.
USD/CAD is still trending down, although right now price could be forming a double bottom, confirmed by a bullish divergence on multiple timeframes. As long as 1.2600 psychological support holds, the probability of a 300 pip upside correction will remain high.
As per the 4-hour chart, there are 3 major resistance areas. The first is near 1.2965, which is 61.8% Fibs. Then goes 1.3056, confirmed by 61.8% and 78.6% retracement levels. And perhaps the final resistance is 88.6% Fibs at 1.3110.
The continuation of the downtrend could be the case only if the daily break and close will be below the 1.2600 psychological support. In this scenario, the price is likely to move towards 1.2500 or even lower.
Support: 1.2680, 1.2620, 1.2600
Resistance: 1.2650, 1.3050, 1.3110