
Published: September 15th, 2020
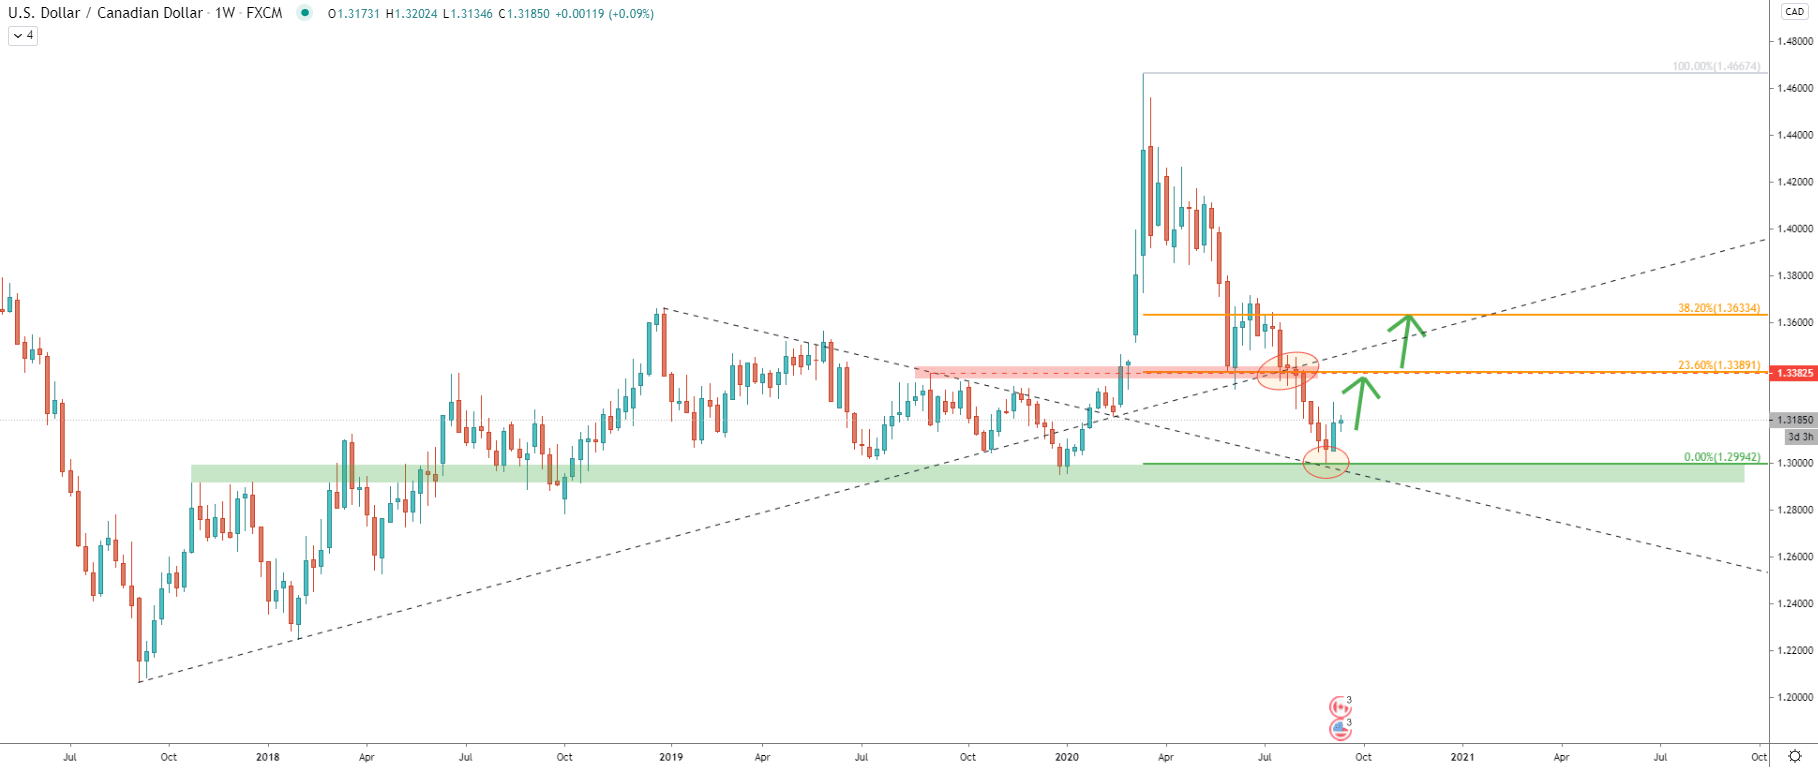
Just over a week ago USD/CAD found the bottom near the key psychological support at 1.3000. Previously this was resistance as well as the support, while this time it was clearly a demand zone. When the price was at the bottom, the downtrend trendline acted as the support which was rejected.
If USD/CAD will manage to stay above 1.3000, a correctional move to the continuation of the upside move should be expected. There are two strong resistance levels where price could be heading. First is the 23.6% Fibonacci retracement level at 1.3389. This level corresponds with the previous supply/demand zone as well as the breakout point of the uptrend trendline.
However, there is a possibility that price will move even higher, and upon the weekly break and close above the 1.3389, USD/CAD can rise towards the 38.2% Fibs at 1.3633, which would make it a 633 pip rise from the bottom produced at 1.3000.
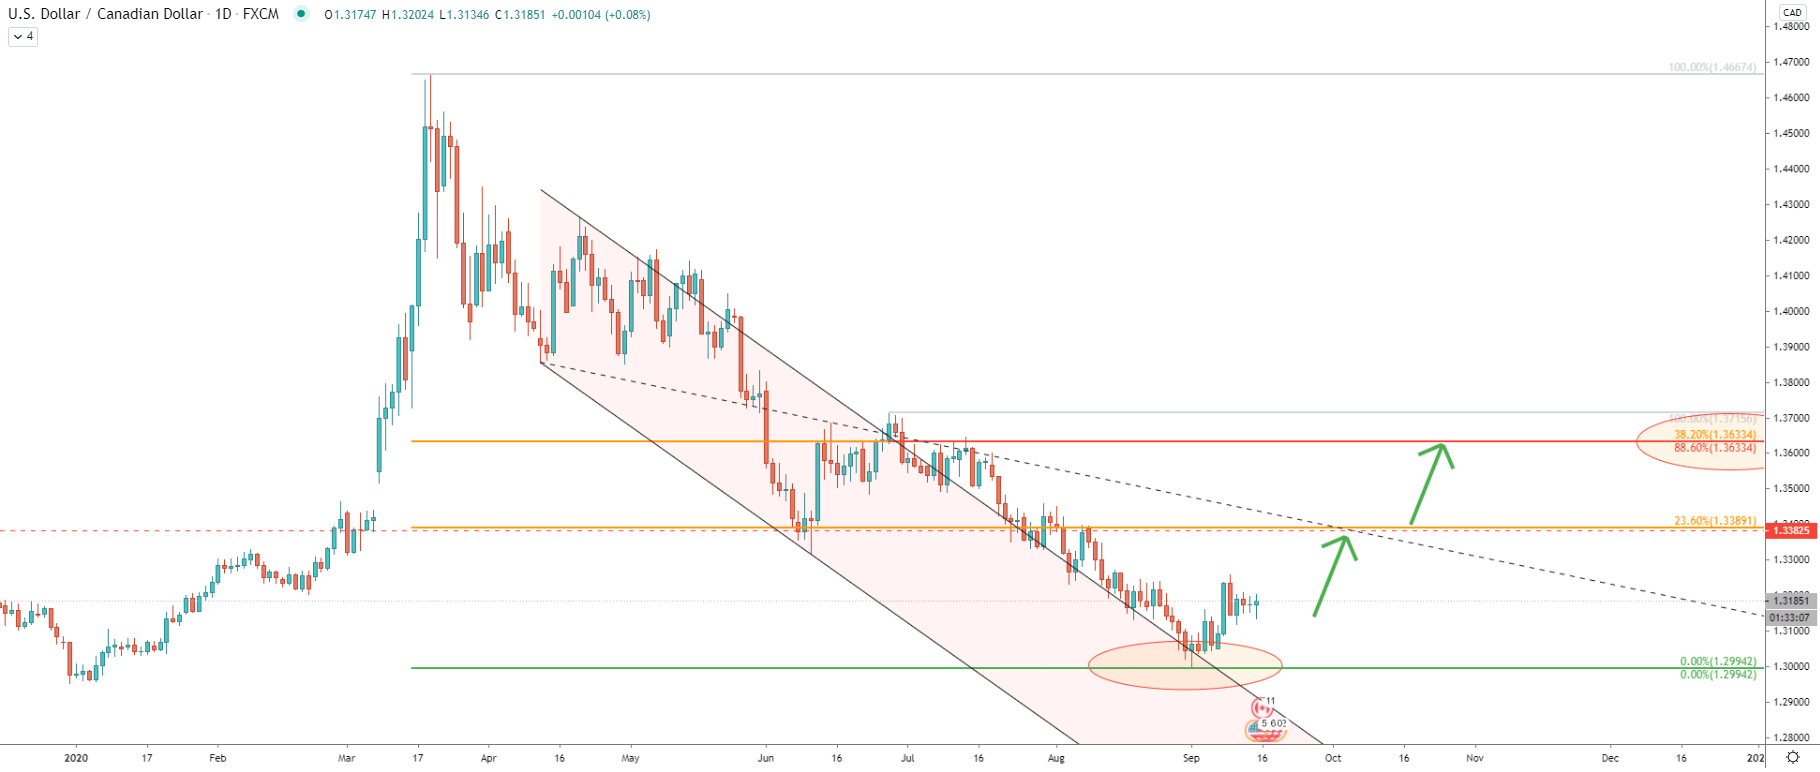
At the bottom USD/CAD has reached and rejected the top of the descending channel, which clearly acted as the support downtrend trendline. The nearest upside target at 1.3389 is now also confirmed by the average-price downtrend trendline which suggests that USD/CAD could test this level within the next two weeks.
The second target is now confirmed by two Fibs, 38.2% as per the weekly chart, and 88.6% Fibs applied to the last move down. While the correctional move north is expected, USD/CAD could take some time to consolidate before/if moving up.
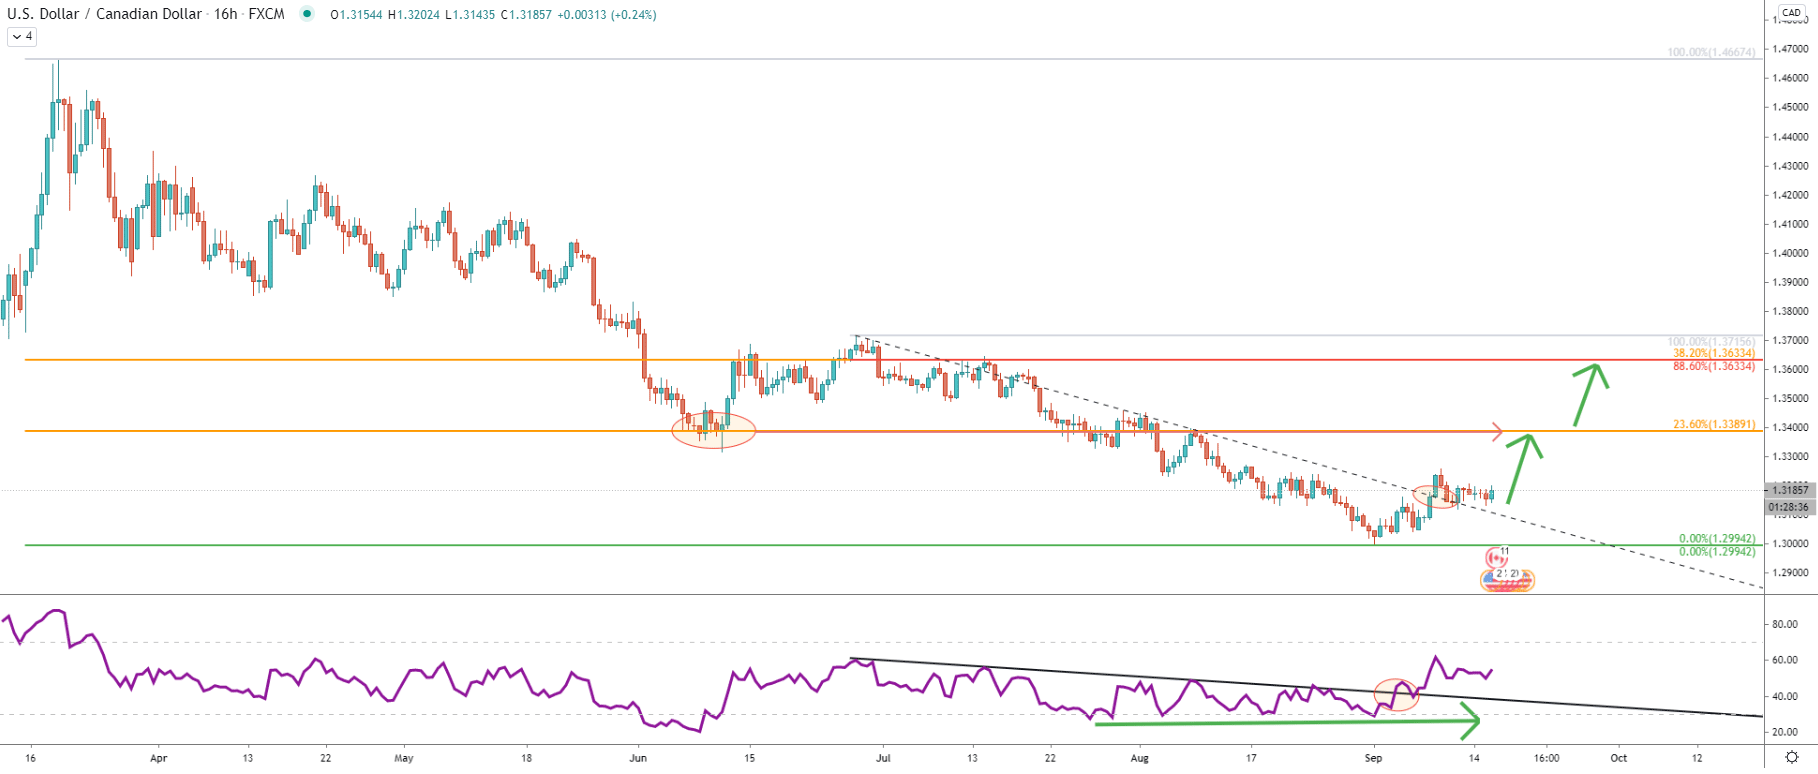
In August USD/CAD has been moving down consistently producing lower lows and lower highs. On the other hand, the RSI oscillator started to produce higher lows, while forming a bullish divergence. This has resulted in prices moving up and breaking above the simple downtrend trendline. It is one of the first confirmations that bulls are taking control and price could start moving up any time. But as already mentioned further consolidation might take place, and could take several days before/if USD/CAD price continues to rise.
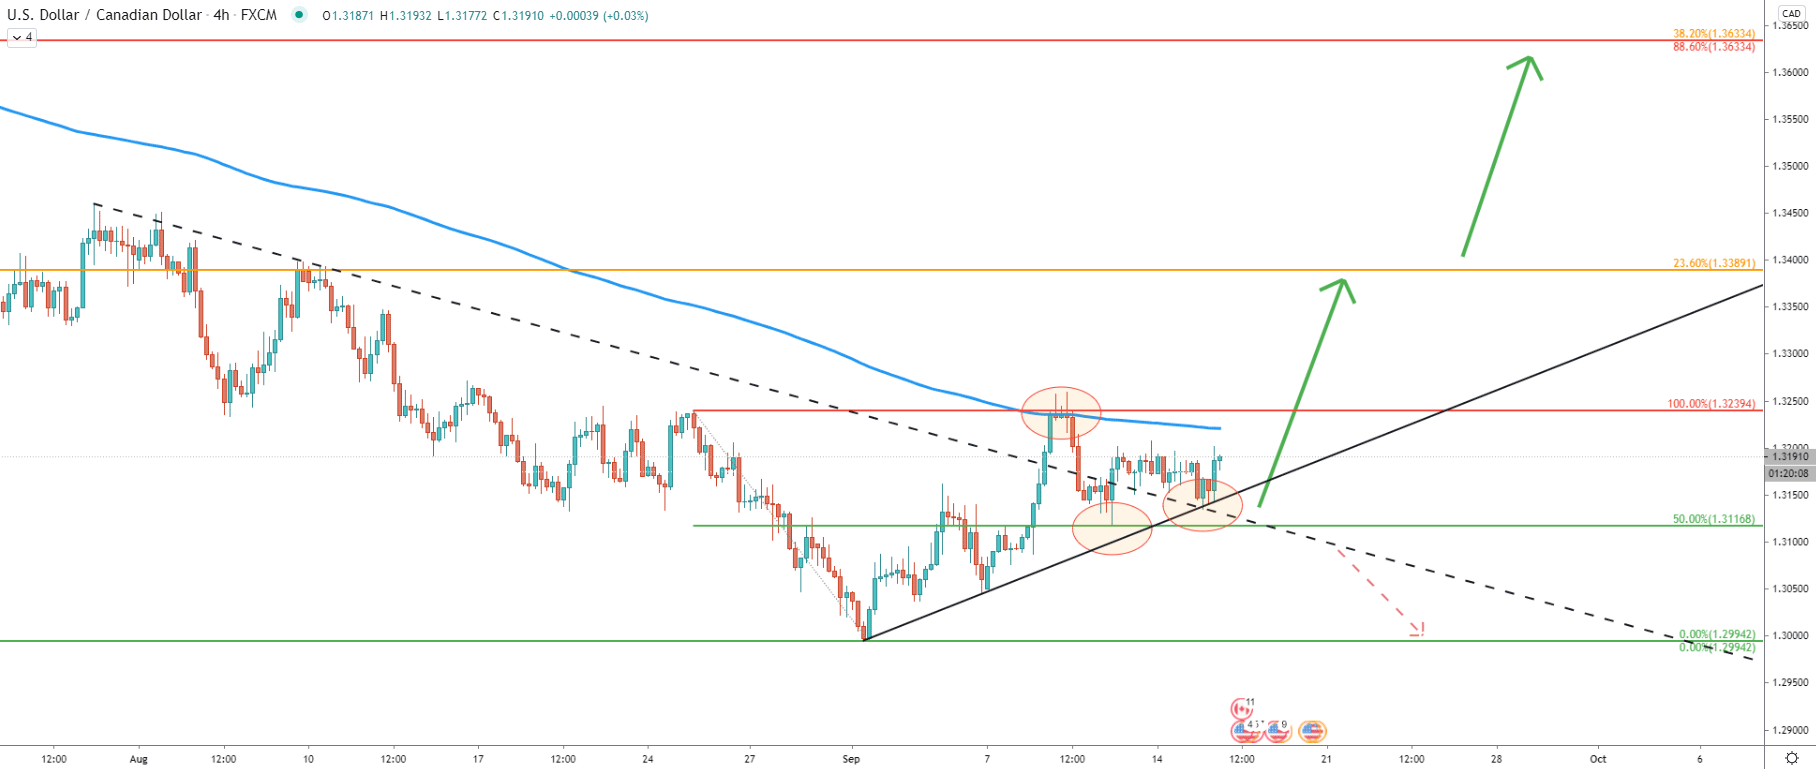
On September 9, the price has reached and rejected the previous area of resistance along with the 200 Exponential Moving Average at 1.3239. However, on September 10 USD/CAD cleanly bounced off the 50% Fibs support at 1.3116 applied to the last wave down.
Such price action shows price indecision on lower timeframes, which might result in the range-trading between 1.3229 resistance and 1.3116 support for the time being. Perhaps the final confirmation of the incoming upside move would be a break and close above the resistance. In regards to the downside risk, break and close below the support, especially on the daily timeframe, would most likely invalidate the bullish scenario. But for now, price rejected the Fibonacci support as well as the uptrend trendline, implying that the probability remains in favor of an uptrend.
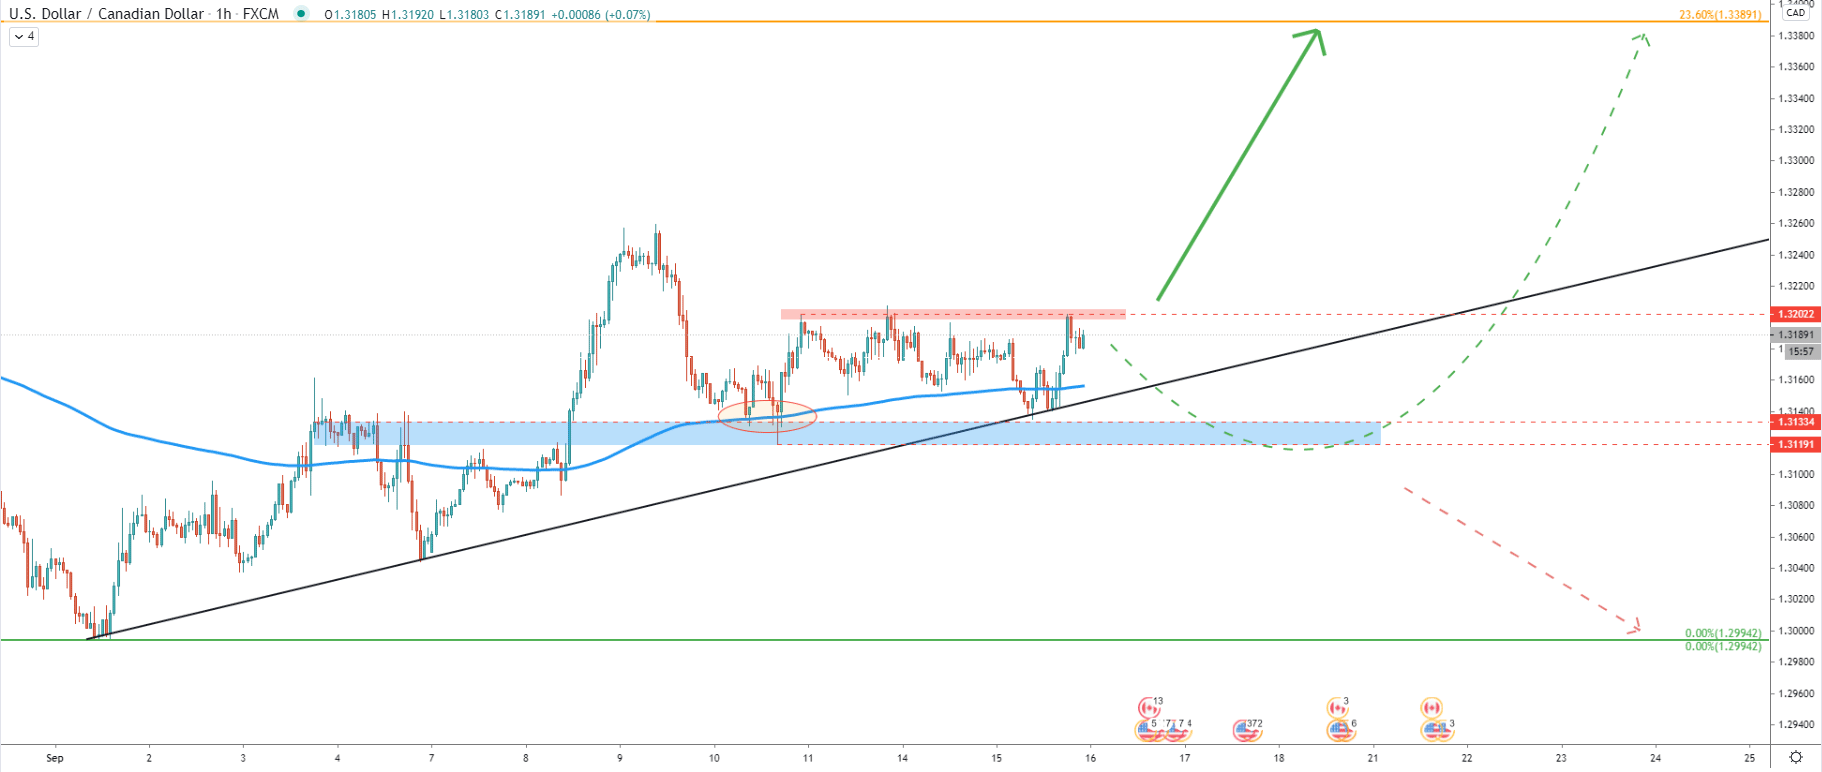
As long as the resistance holds, there could be an attempt to break below the key support area located between 1.3133 - 1.3119. On the daily chart spikes below the support area can be expected and this could be a reasonable move by USD/CAD in order to take out multiple stop losses located just below 1.3119. But in order to confirm the bearish forecast, there must be a daily close below 1.3119.
Currently, USD/CAD is consolidating, while the probability remains in favor of the bullish trend. It will be important to watch for the breakout either below the support at 1.3119 to confirm the downtrend, or above the psychological resistance at 1.3200 to confirm the uptrend.
As per the weekly and daily chart, there are two major resistance levels. The first is located at 1.3389, confirmed by the average-price downtrend trendline and 23.6% Fibs. The second is located at 1.3633 and is confirmed by two Fibs, 38.2%, and 88.6% retracement levels.
Only a daily or perhaps even weekly break and close below the 1.3116 support level will invalidate the bullish forecast and the downside risk should increase substantially. In this scenario, USD/CAD might continue to decline towards the key psychological support at 1.3000.
Support: 1.3119, 1.3000
Resistance: 1.3200, 1.3389, 1.3633