
Published: December 29th, 2021
Uniswap (UNI) is a decentralized trading protocol famous for its automated trading facilities in DeFi tokens. It appeared in the world in November 2018 but became famous in 2020 due to the massive surge in DeFi and its associated token trading. In this platform, traders can keep their automated trading open to anyone who holds the token that is ultimately improving the trading platform’s efficiency.
The Uniswap governing token, UNI, appeared in September 2020 that added profitability and user adoption to attract decentralized entities. The UNI price positively correlates with the DeFi sector, where any development in the DeFi industry would create a price appreciation in UNI.
Currently, 628,522,058.41 UNI are in supply, where the maximum supply is 1,000,000,000 UNI. The current market cap of this instrument is $11,612,832,920, while the last 24 hours trading volume is $581,038,052. 52 weeks high and low of this token is $3.50 / $44.97, which is a sign of an amazing return on investment.
Let’s see the upcoming price direction from the UNI/USDT technical analysis:
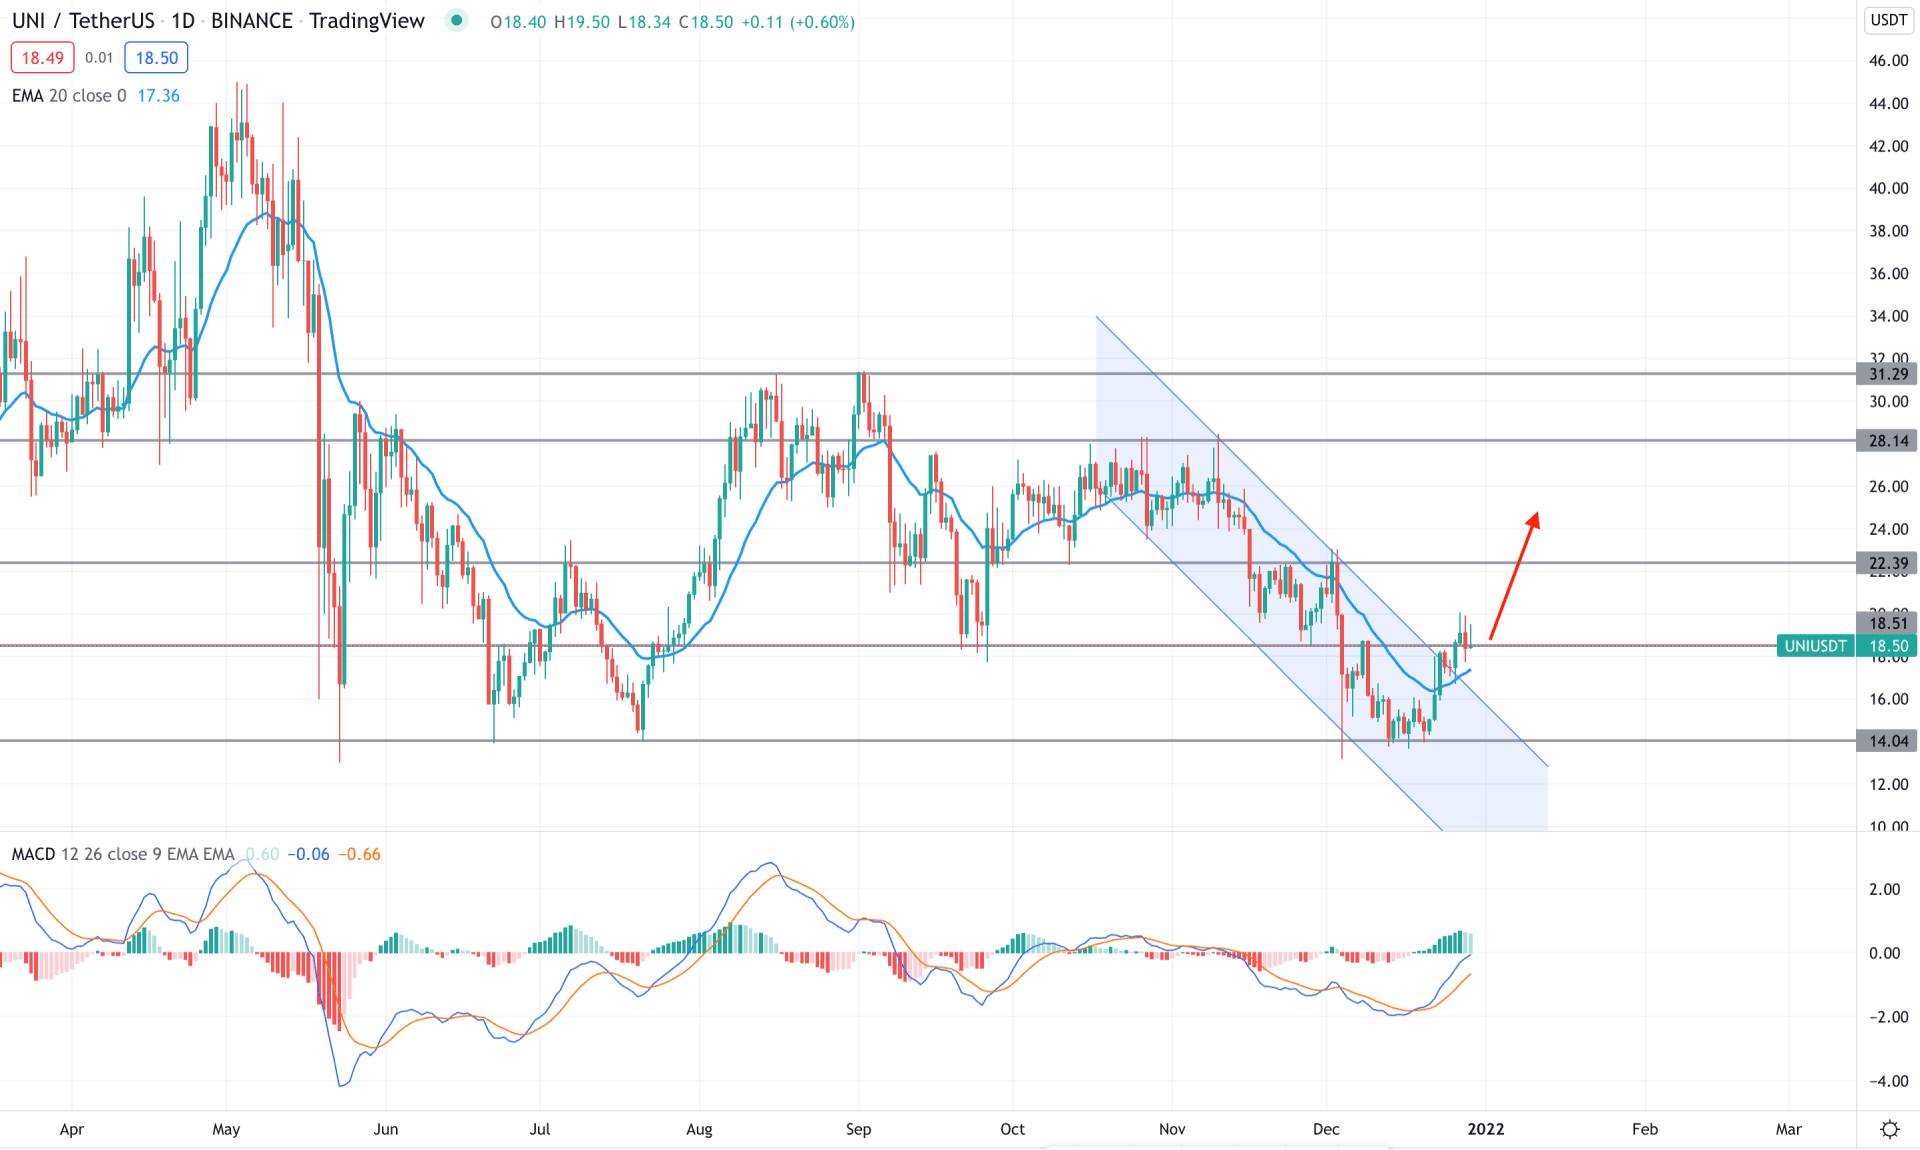
UNI/USDT showed a massive amount of consolidation in recent months, where the possibility of trending movement is highly probable on the eve of the new year. The enormous selling pressure from the 45.00 level was amazing for bears, but the price made a base at 14.00 support level from where bulls attempted to take the price higher.
In the most recent chart, the selling pressure from 28.14 to 14.00 level showed a bullish channel breakout where the current price is above the 18.50 event level. As the bullish channel breakout is intact, any bullish price action from 18.50 to 14.00 would be a decent buying opportunity in this pair for long-term traders and HODLers.
The above image shows how the MACD Histogram changed its position from bearish to bullish while the price moved above the dynamic 20 EMA with a bullish daily close. Therefore, the overall price context is bullish as long as it trades above the dynamic 20 EMA. In that case, the primary target of the bull run is towards the 28.11 resistance level. On the other hand, a break below the 14.00 level needs a HODLing approach to see further gains in this pair.
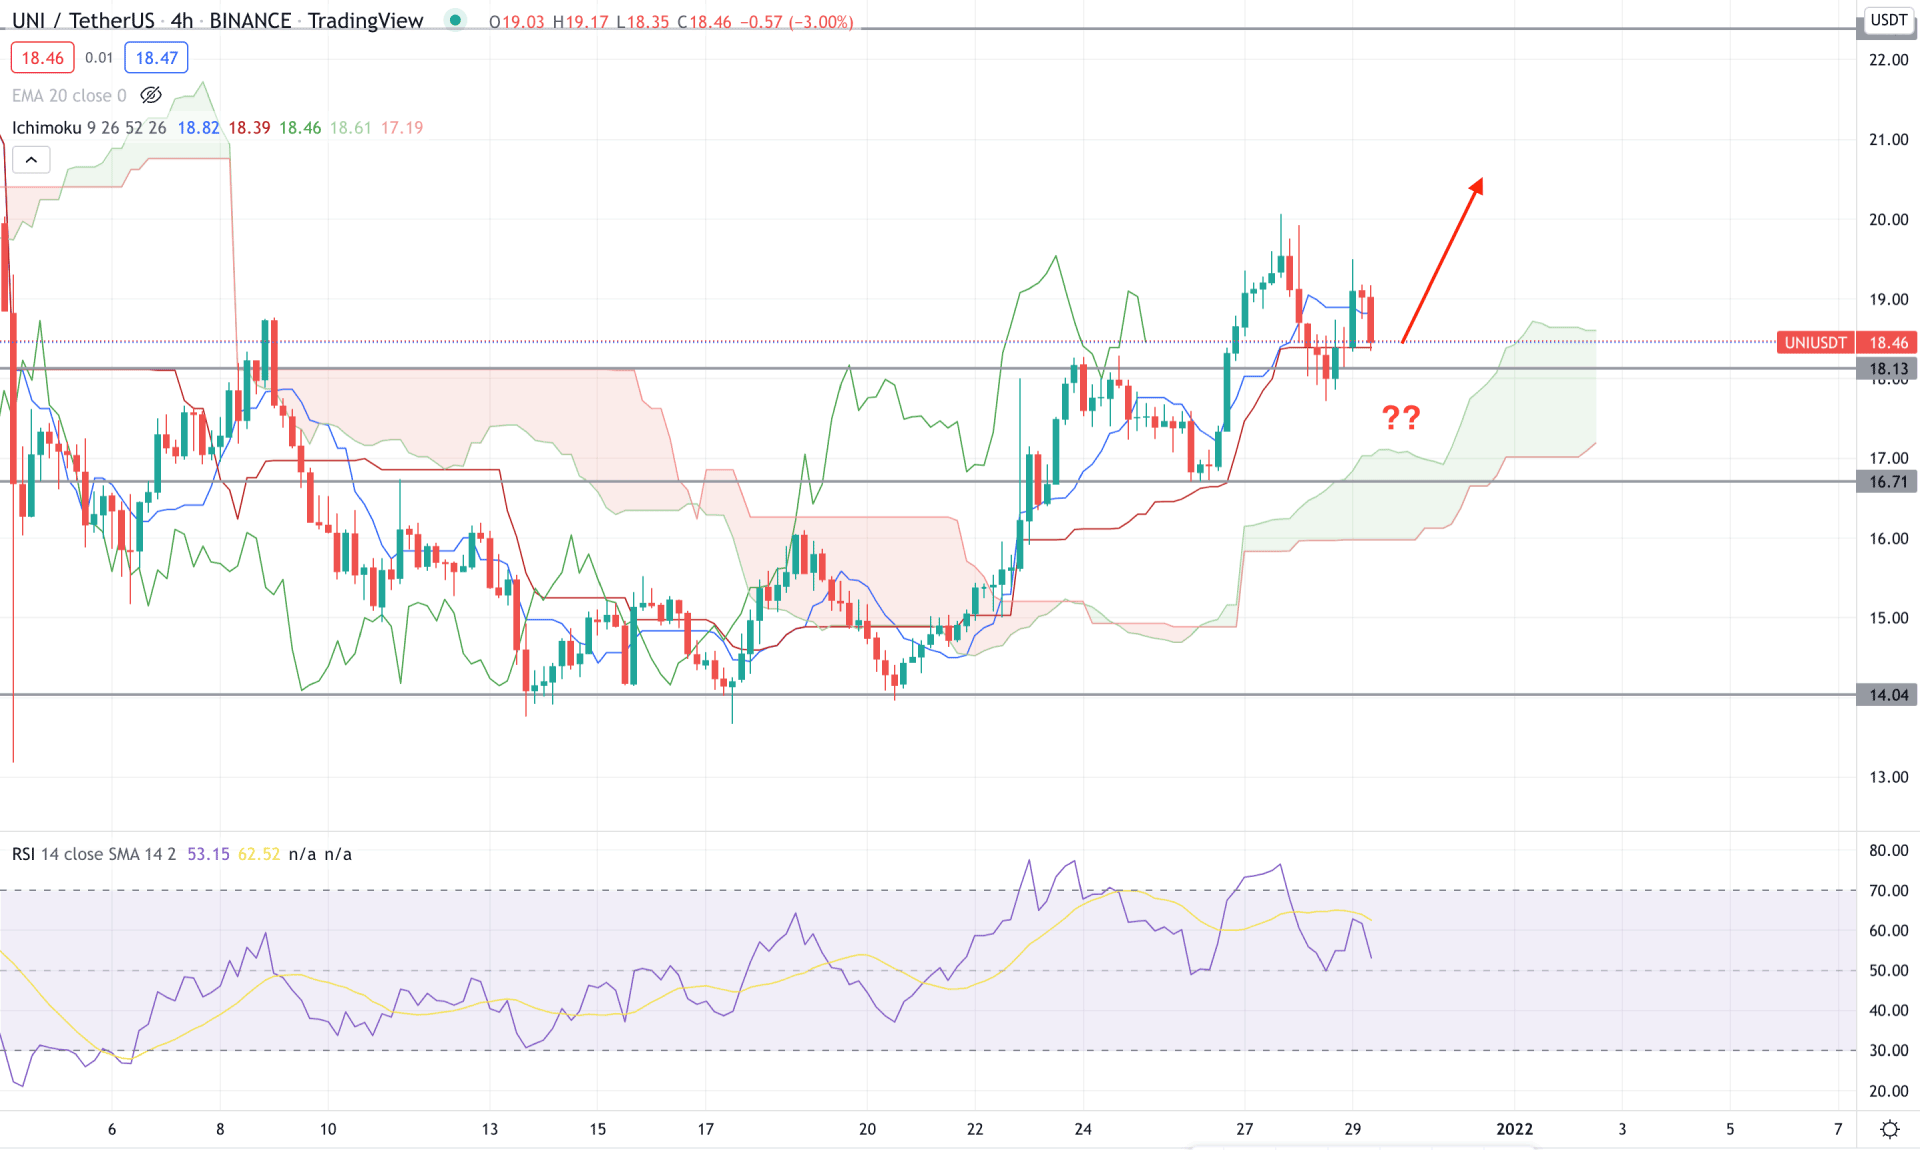
According to the Ichimoku Cloud analysis, the UNI/USDT is trading within a bullish trend as the price showed a robust bullish breakout where the current future cloud is bullish. Moreover, the Lagging Span is above the price, which signifies potential bullish possibilities in the chart.
The above image shows how the RSI is stable above the 50 level where the current price is above the dynamic Kijun Sen and static support of 18.31 level. Therefore, any bullish rejection with an H4 close above the dynamic Tenkan Sen has a higher possibility of taking the price up towards the 24.00 resistance level. On the other hand, bulls should closely monitor how the price trades below the 16.71 intraday event level. Any bearish H4 close below the 16.71 level may lower the price towards the 14.00 level.
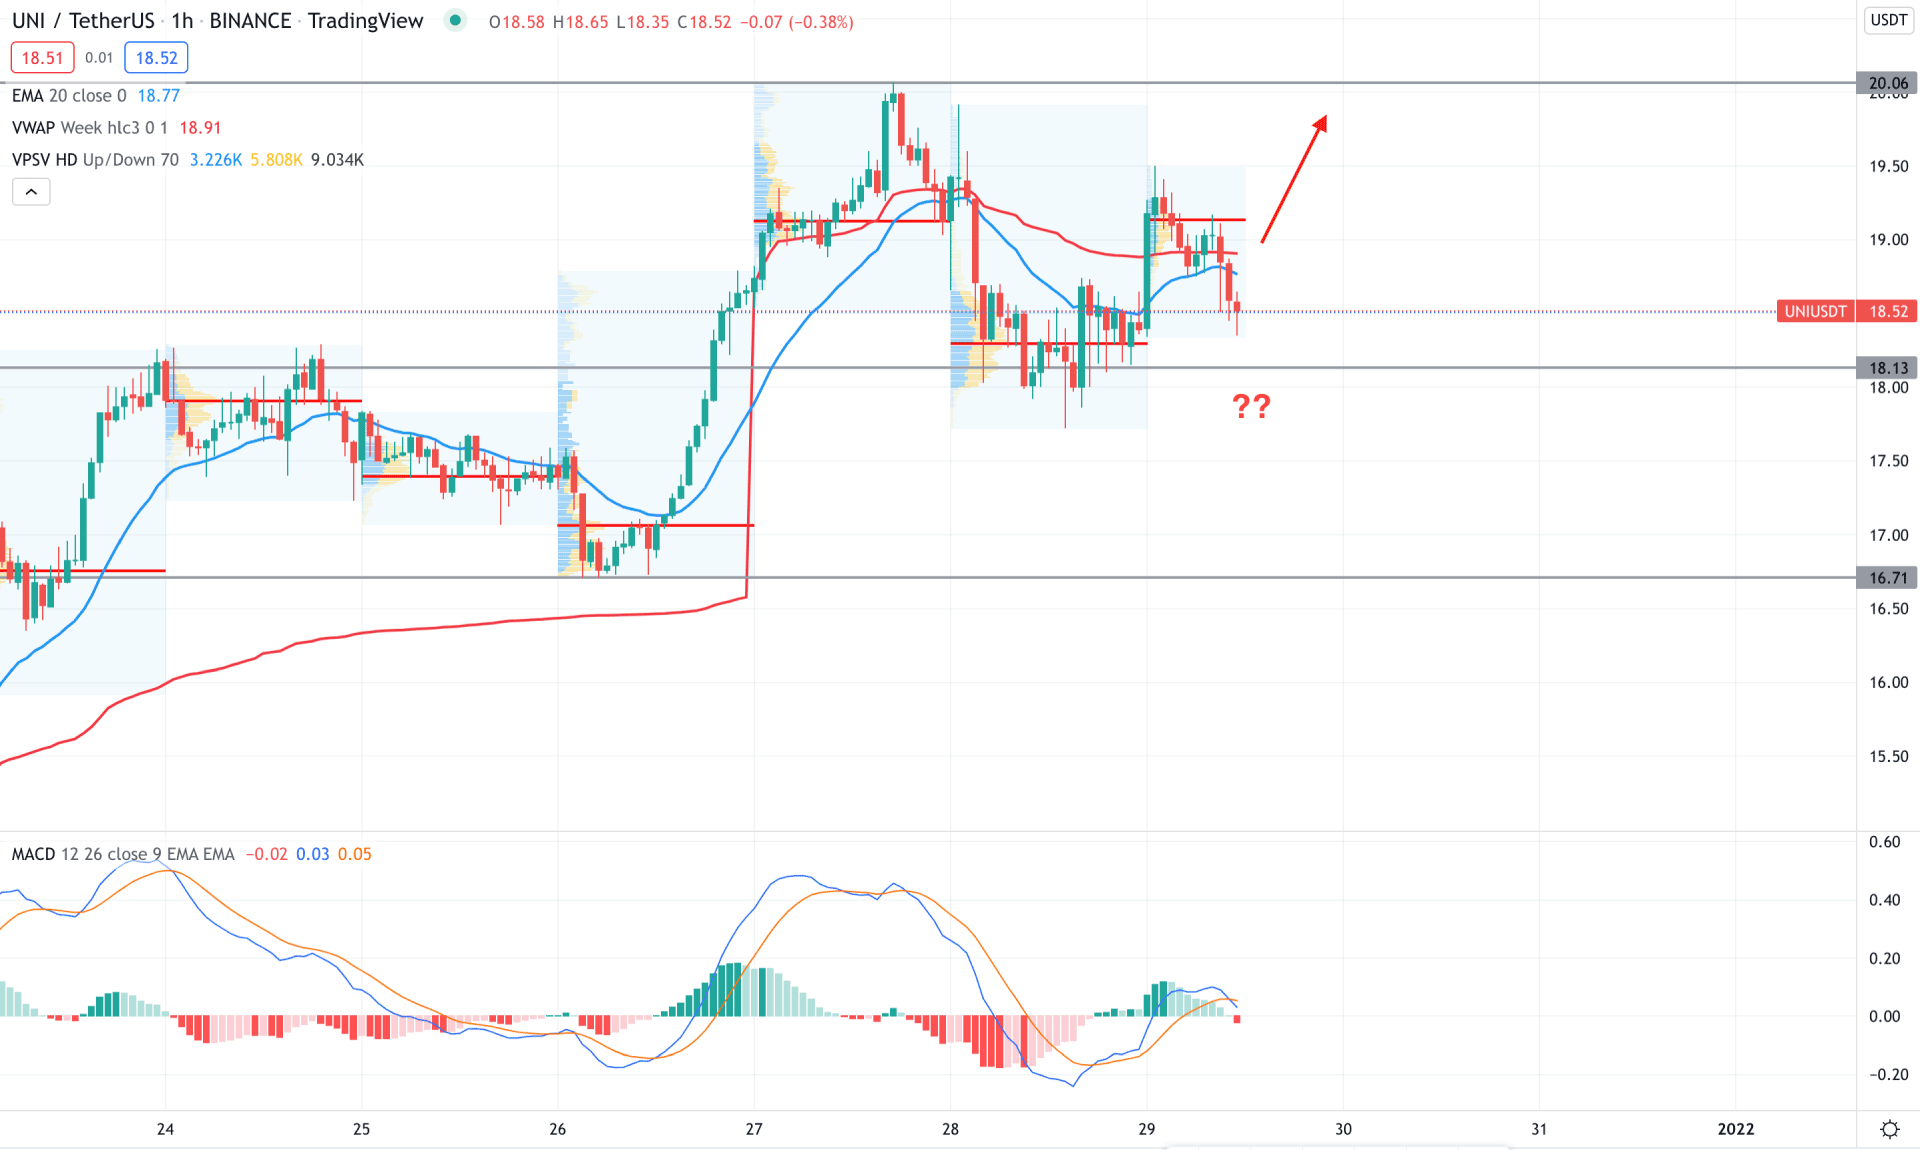
UNI/USDT is trading within a bullish trend in the intraday price chart as the price showed buyers’ interest from the 18.33 event level. Therefore, the buying possibility in this pair is valid as long as it trades above the 18.33 level. However, it needs further confirmations from dynamic 20 EMA before going long.
The above image shows how the MACD Histogram turned bearish where the recent price showed bearish sentiment from the intraday high volume level. As the current price is trading below the dynamic 20 EMA and weekly VWAP, investors should wait for the price to change its direction by appearing above the VWAP before going long. On the other hand, a break below the 18.33 level with a bearish H1 close may alter the current market structure and lower the price towards the 16.71 level.
According to the current observation, Uniswap (UNI) has a higher possibility of bullish pressure if the daily candle closes above the 18.50 level. Later on, any bullish rejections from H1 swing low would be a buying opportunity in this pair. However, a break below the 14.00 would eliminate the current buying structure and lower the price in the coming days.