
Published: April 13th, 2022
Twitter became the talk of the town as soon as the Tesla CEO bought 9.2% of the Twitter stock. As a result, the Twitter stock opened the next day with a 21.71% price surge that extended to 38.58% higher to the 54.50 swing high. Later on, the price corrected lower but still remained above the 41.18 support level.
Elon Musk has millions of followers, which came from his success in Tesla, an electric-fueled car manufacturing company. Moreover, his speech on several cryptocurrencies like Dogecoin made many people profitable. In that case, Elon Musk’s investment in Twitter stock made people consider this instrument a reliable investment opportunity.
However, buying a stock needs close attention to company performance and price performance. The business structure of Twitter is stable as its vast cash flow and strong operating margin indicates a bullish factor for this stock. Moreover, the long-term debt structure is strong, where only 41% of finance came from loans. The day-to-day business operation remains stable where the current assets are 6 times higher than the current liability.
Although the strong business structure. The Twitter stock failed to show any significant movement in 2022. However, the recent bullish pressure above the 41.18 level made a bullish break-of-structure where bulls may join again after a correction. Let’s see the future price direction from the Twitter Stock (TWTR) technical analysis.
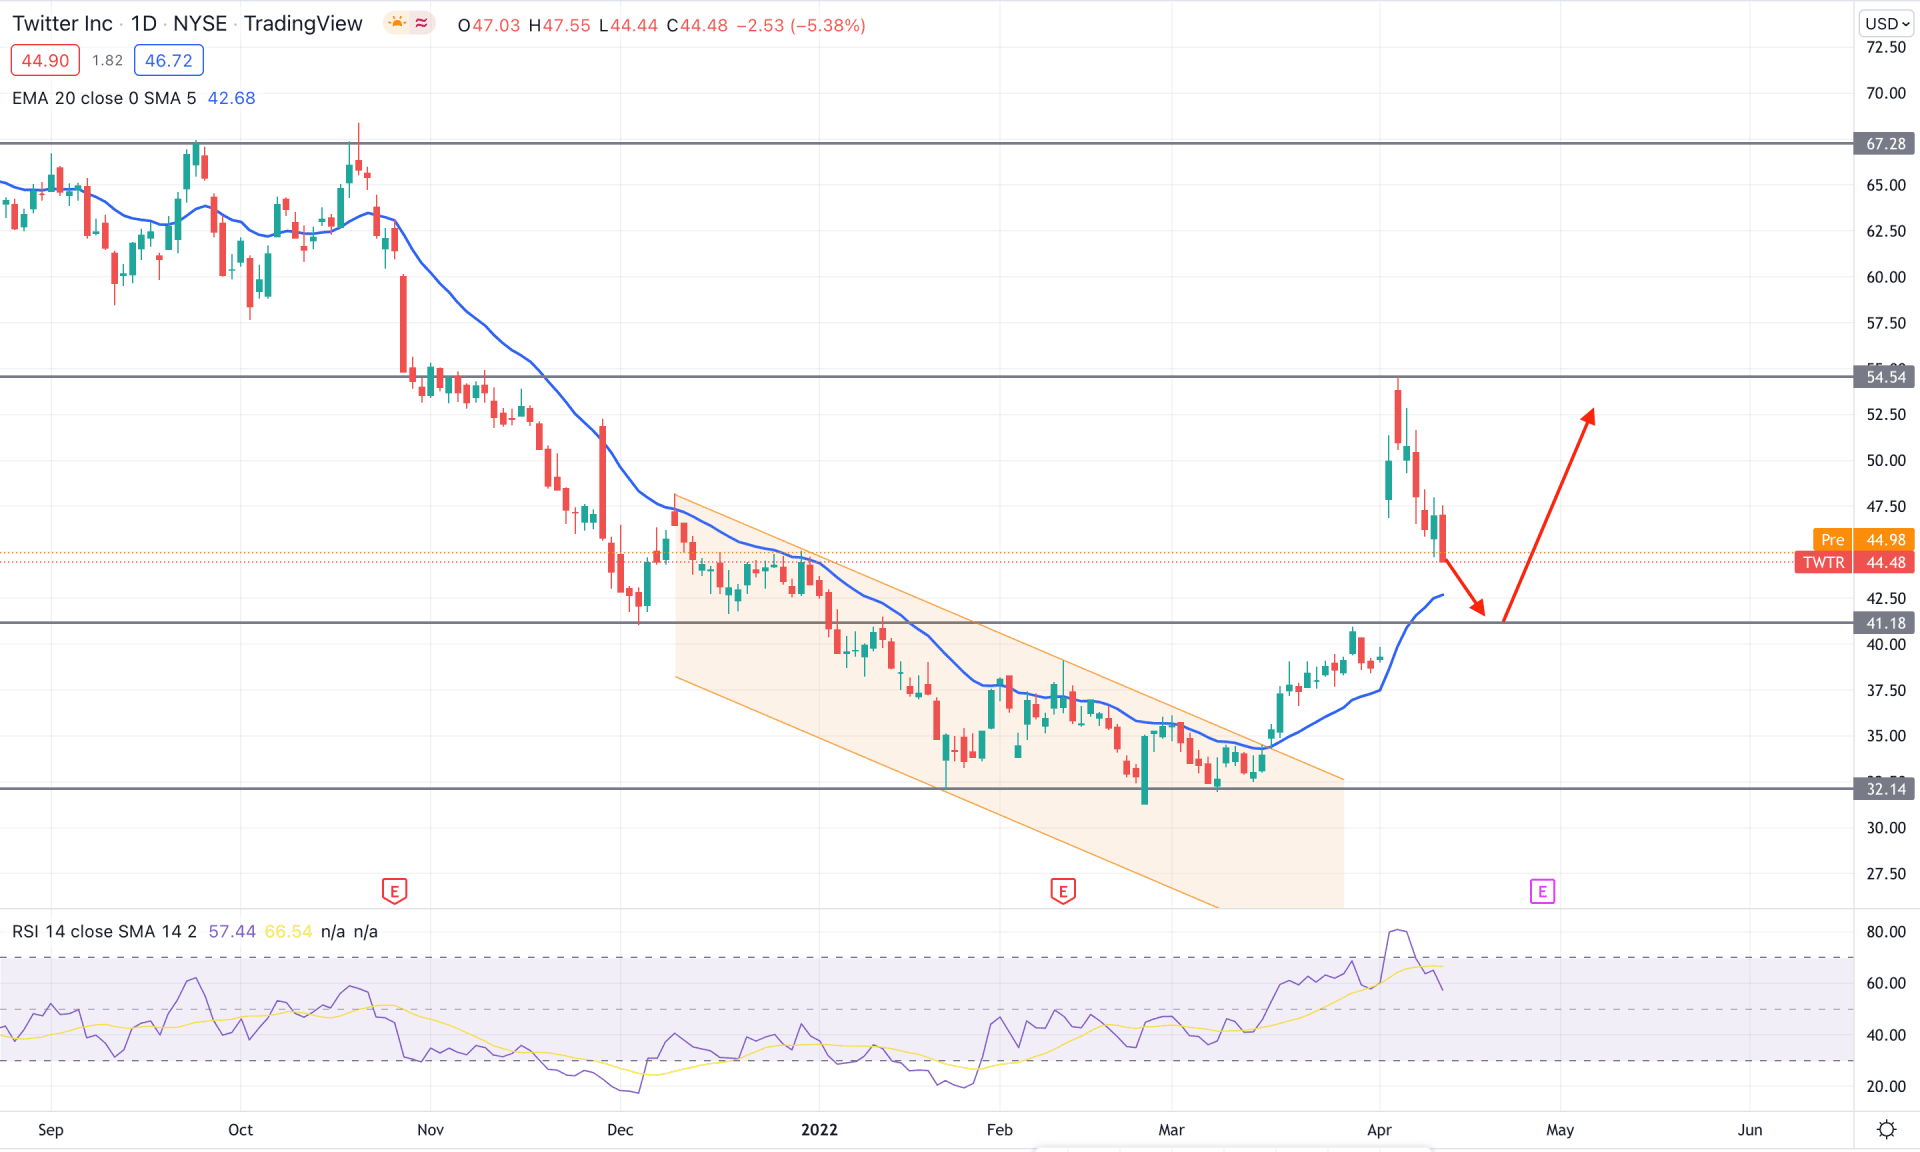
In the TWTR daily chart, the recent buying pressure from the 32.14 support level made a new swing high above the 48.00 level. Moreover, the recent news-based buying pressure made a demand area at 42.00 to 40.00 area from where another buying attempt may come. Although the price is trending lower from the 54.54 swing level, the buying pressure may regain momentum after showing a bullish rejection from the 41.18 support level.
The above image shows how the RSI line reached the overbought 70 levels and still held the buying momentum by remaining above the 50.00 area. In that case, any rebound in RSI from 40-50 regions with a bullish rejection from dynamic 20 EMA would work as confluence support to the price.
Based on the current context, any buying pressure from 42.00 to 40.00 area with a bullish rejection candle in the daily chart would be a bullish factor for this instrument where the primary aim is to test the 54.54 swing level in the coming days. However, the alternative approach is to find a daily candlestick below the 39.00 level to see the price testing the 32.14 support level.
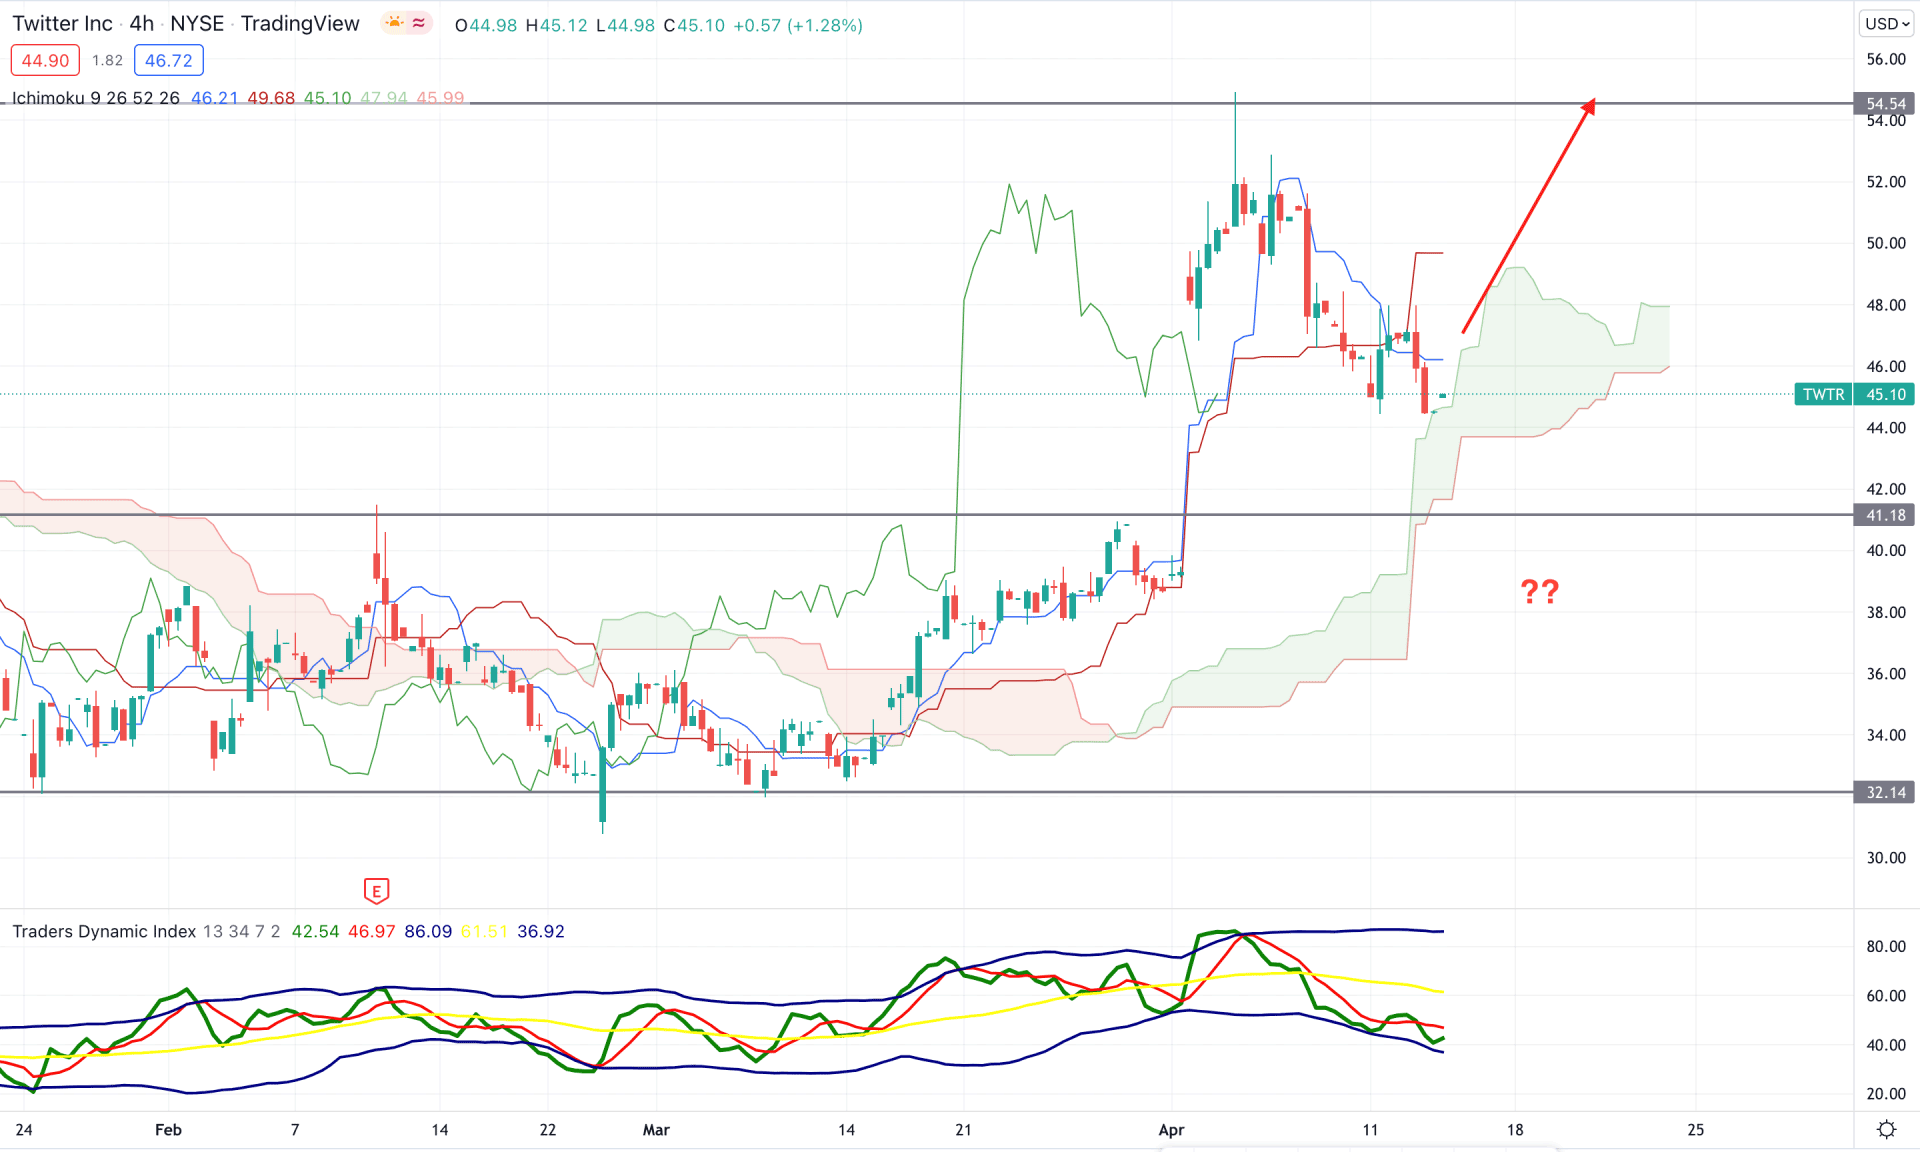
According to the Ichimoku Cloud, the broader market direction for the Twitter stock is bullish as the recent price trades above the Kumo Cloud with a strong bullish breakout. However, the most recent price remains corrective after testing the 54.54 swing level, where the selling pressure reached the cloud support at a corrective speed. On the other hand, the future cloud remained bullish by keeping the Senkou Span A above the Senkou Span B.
The above image shows how sellers’ strength became weaker in the traders' dynamic index indicator as the TDI line reached the lower band. Moreover, the bearish crossover between dynamic Tenkan Sen and Kijun Sen needs to be eliminated before considering a buy in this instrument.
Therefore, based on the current price structure, the upcoming price pressure may remain bullish if an H4 cand appears above the dynamic Kijun Sen. However, a specific correction towards the 41.18 is still pending. Still, a break below the 40.00 level would be an alarming sign for bulls.
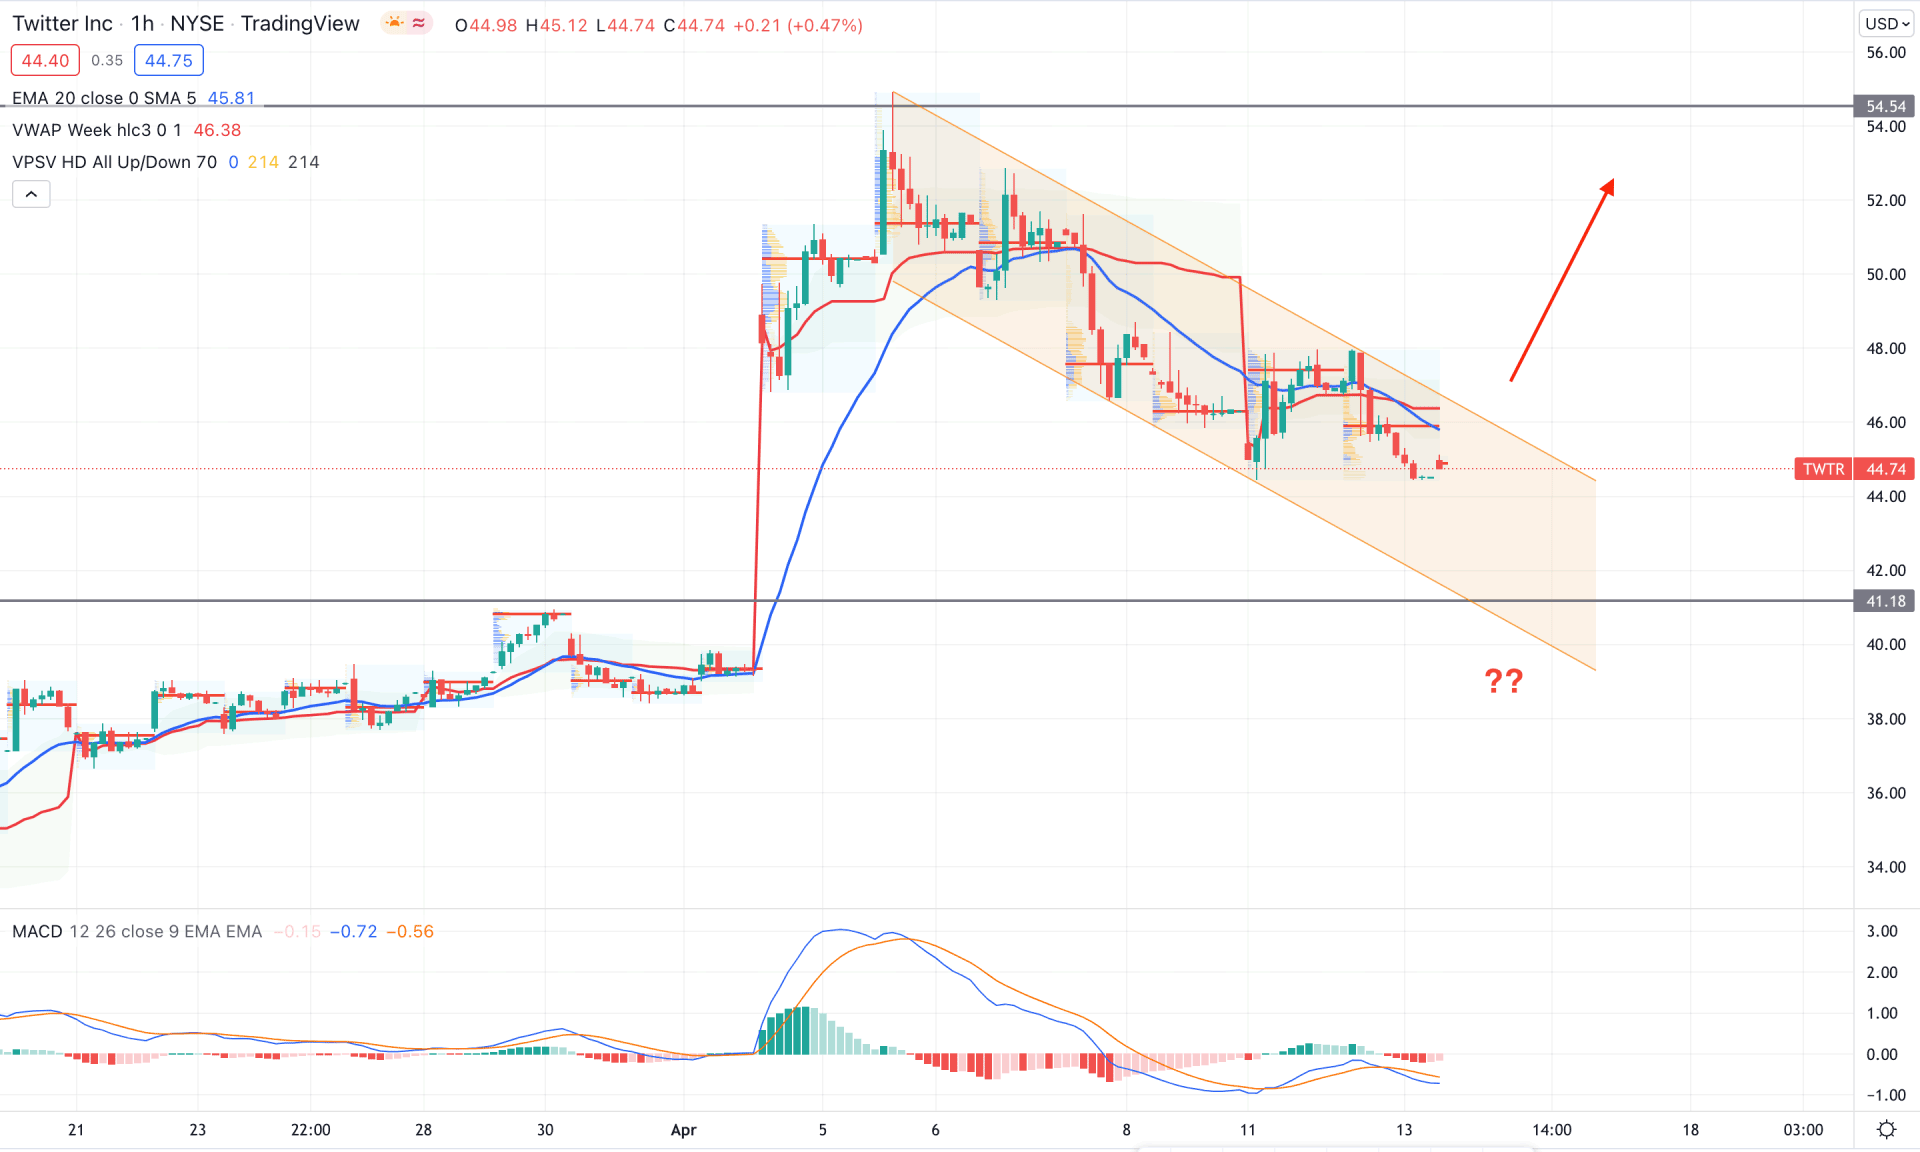
In the Twitter Stock (TWTR) intraday chart, the price is moving down within a bearish channel where the possibility of testing the 41.18 level is intact. Additionally, the most recent price trades below the dynamic 20 EMA, while the most recent intraday high volume level is above the current price.
The above image shows that the MACD Histogram is bearish, whereas the MACD Line remained below the Histogram without divergence. Moreover, the dynamic weekly VWAP is above the price and provides a confluence resistance. In that case, bulls should wait for a channel breakout before going long in this instrument, where the primary target is to test the 54.54 resistance level.
Based on the current multi-timeframe analysis, TWTR is more likely to extend the bullish pressure with a 60% price gain as long as bulls hold it above the 41.18 support level. However, a break below the 40.00 level would decrease the price towards the 32.00 level before showing another bullish sign.