
Published: December 1st, 2020
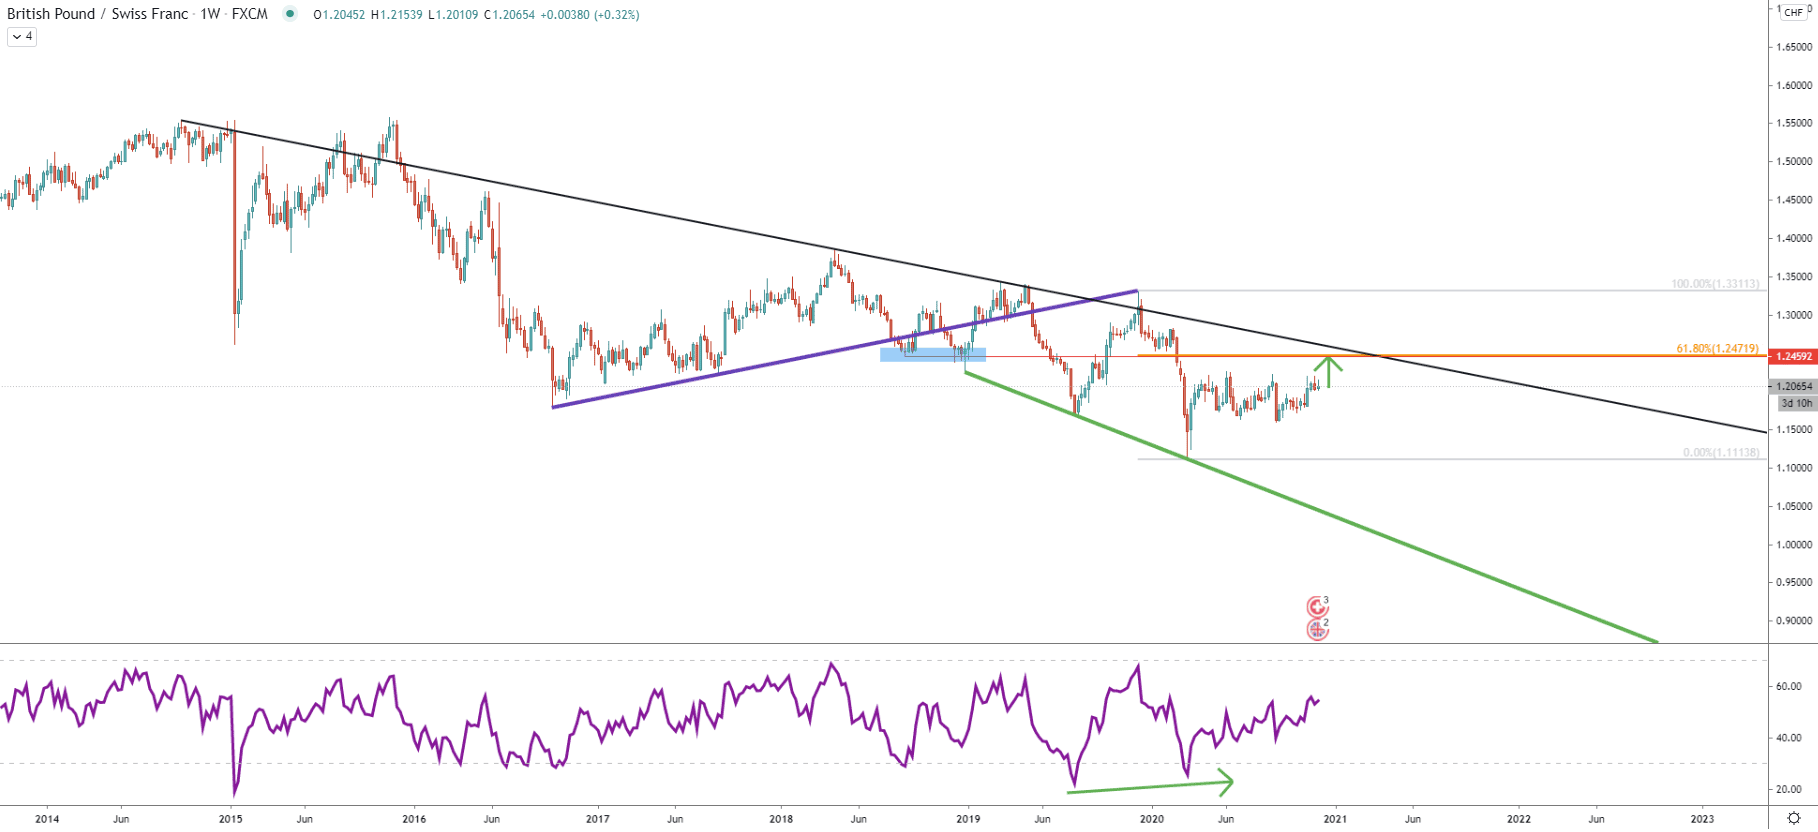
The long-term trend for GBP/CHF remains bearish as the price continues to produce lower lows and lower highs. Although in March, the price has tested 1.1113 low, where it rejected the support trendline and where the RSI oscillator formed a bullish divergence. This could have been a strong indication that the trend is reversing for the long run, but still, it is too early to state that with confidence.
This is because GBP/CHF remains below the downtrend trendline, which certainly must be penetrated to increase the probability for the trend reversal. And right now, the pair could be heading towards that trendline, to either re-test it or break to the upside.
The key resistance could be located at 1.2472, which is a 61.8% Fibonacci retracement level that corresponds to the previous level of support. It makes the potential growth for the GBP/CHF nearly 400 pips from the current price.
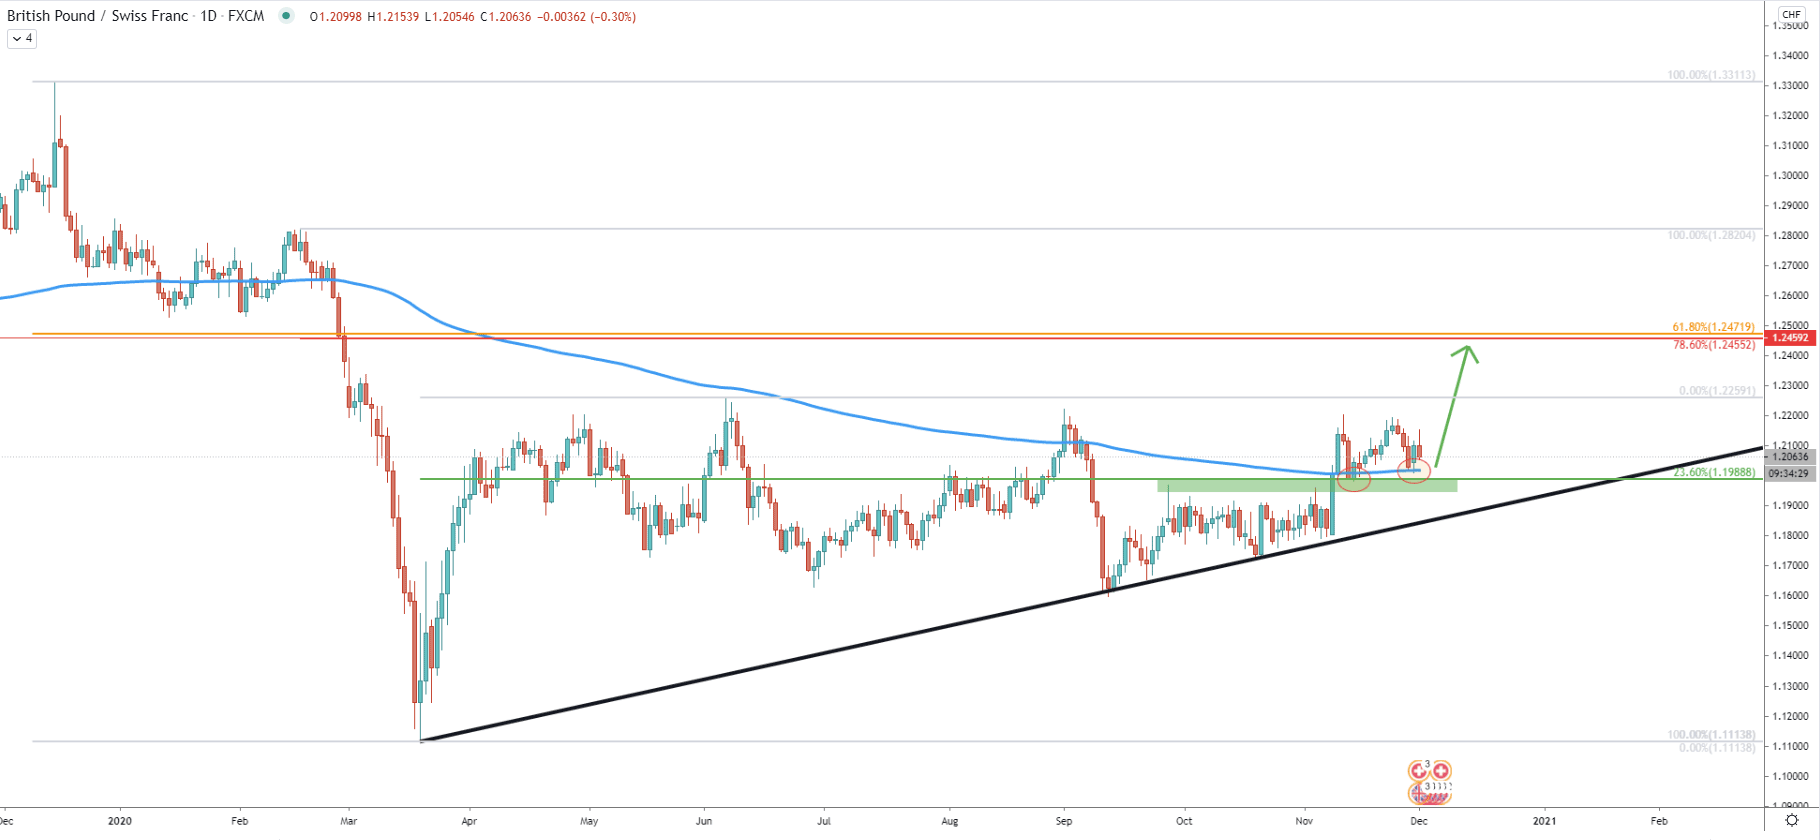
After the price has bounced off the simple uptrend trendline, GBP/CHF has been producing higher highs and higher lows, thus validating the uptrend. During the past few weeks, GBP/CHF has been bouncing off the support at 1.1988. This level is based on 23.6% Fibonacci retracement and was rejected along with the 200 Exponential Moving Average. This rejection occurred just yesterday, and perhaps this was the starting point of the potential trend up.
Based on two Fibs, applied to the overall downtrend as well as the last wave to the down occurred back in March, now there are two Fibonacci levels confirming that 1.2470 could be the key resistance area and a strong supply zone.
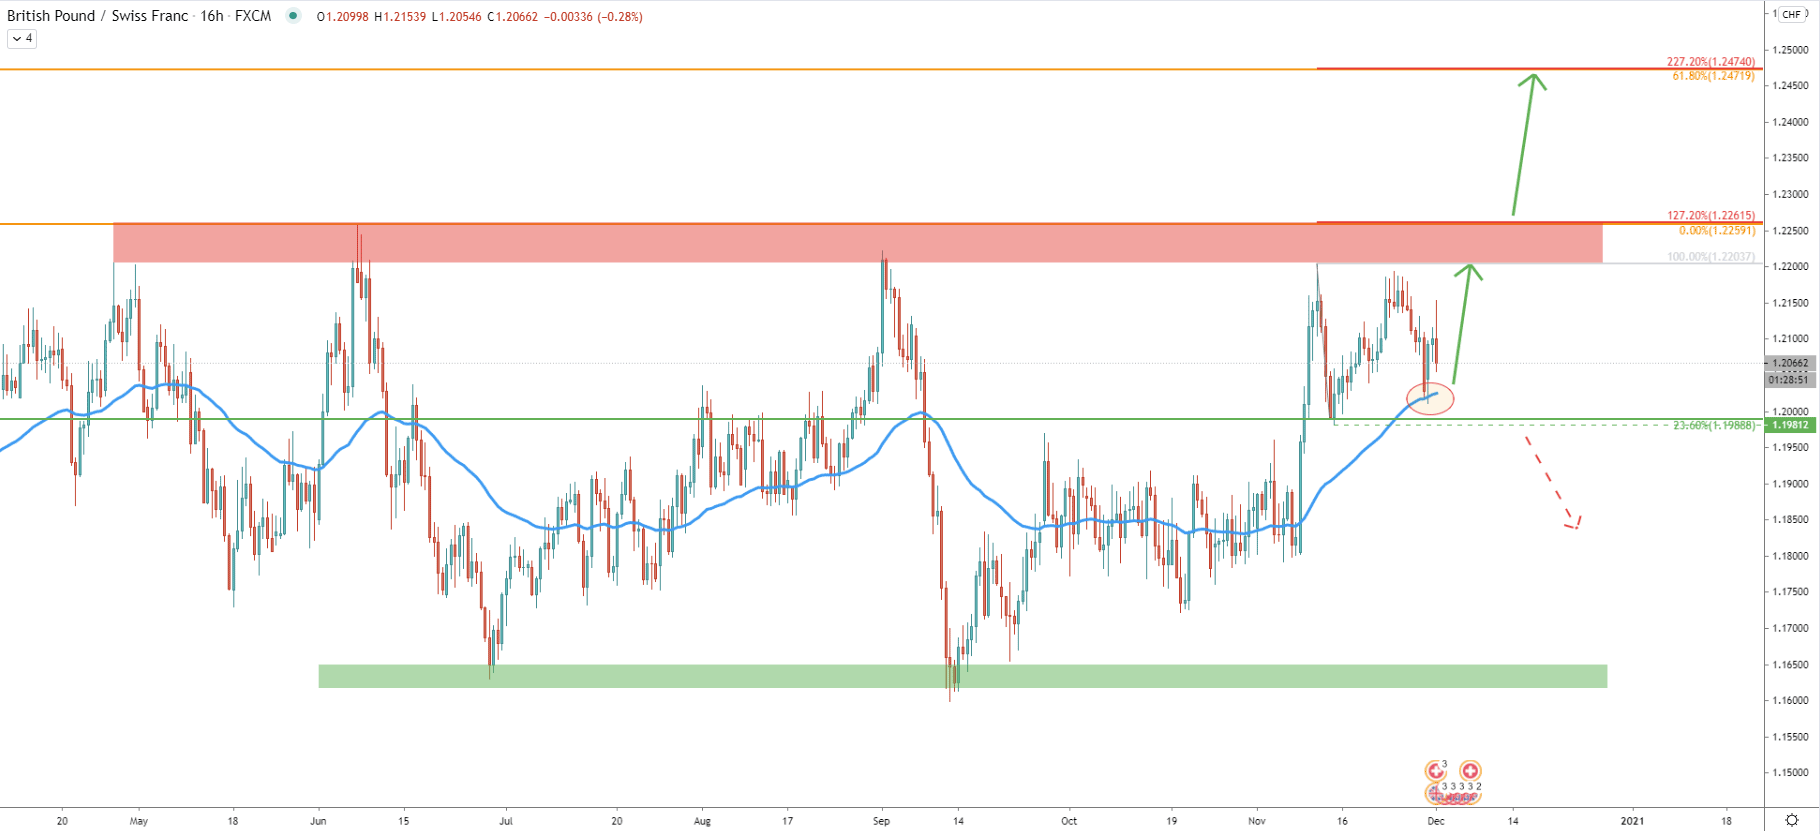
On the 16-hour chart, it can be seen that GBP/CHF has entered the consolidation phase back in May. Since then price has been trapped between the 1.2260 resistance and 1.1650 support area. But looking at the most recent price action, there is another support that has been formed at 1.1988, where price rejected the 23.6% Fibs. Also, the 50 EMA got rejected, suggesting that the price is likely to rise towards the top of the range. To confirm a strong uptrend, obviously, GBP/CHF must break and close above 1.2260 resistance which is confirmed by 127.2% Fibonacci retracement. If it managed to beak higher, the next target becomes the 1.2470 area, which on this chart is confirmed by 61.8% as well as 227.2% Fibs.
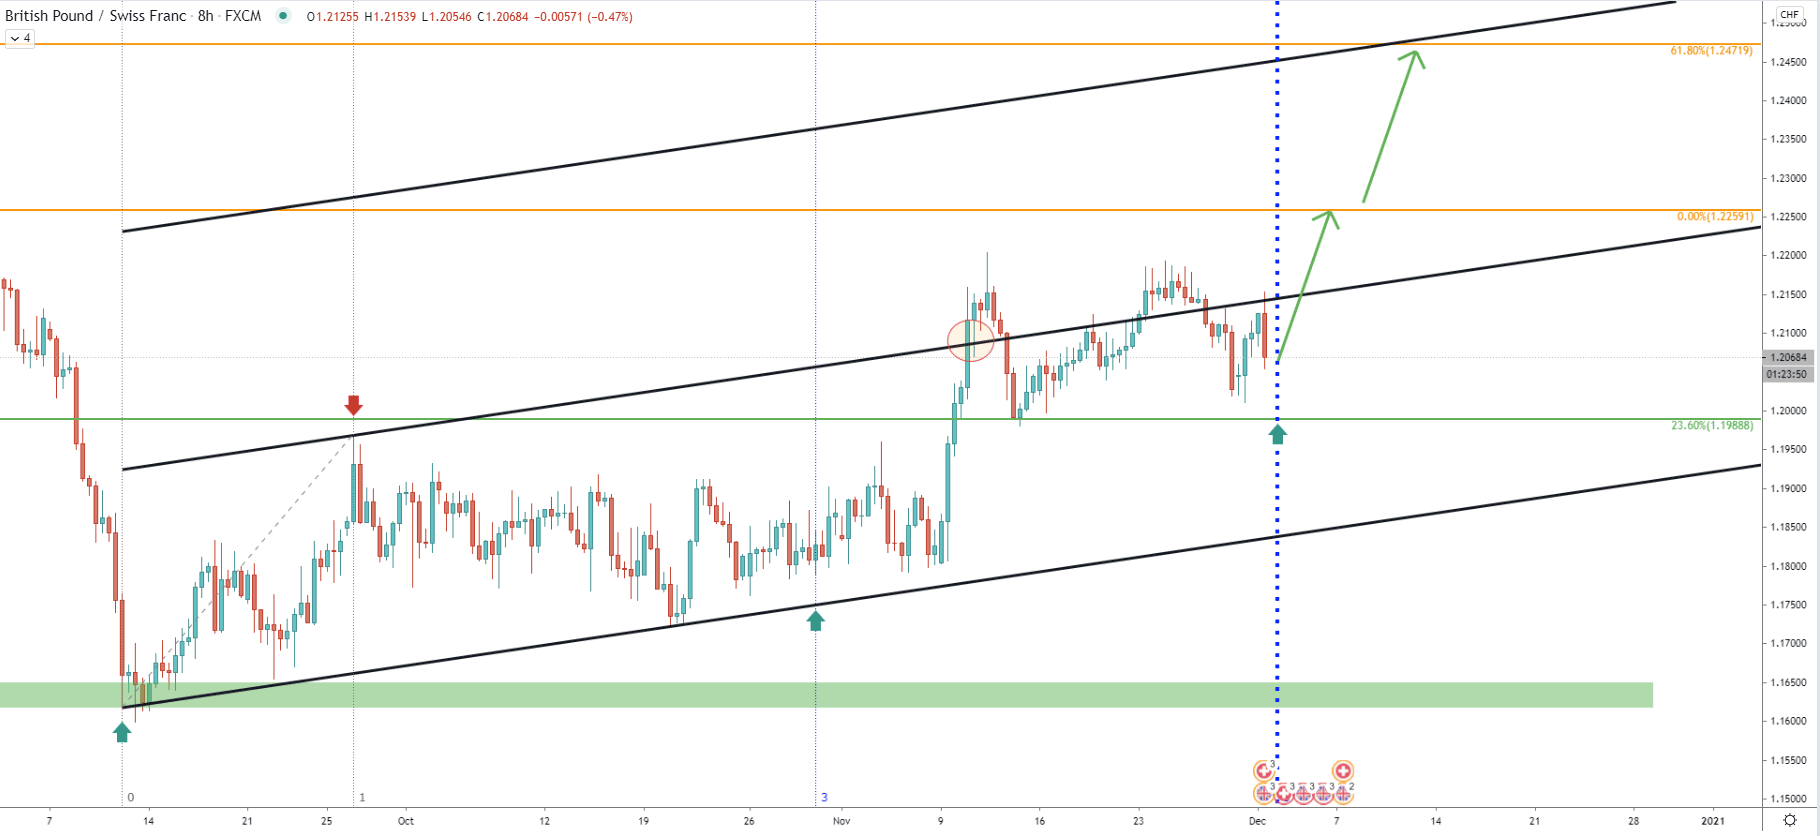
On November 9 GBP/CHF broke above the ascending channel, after which the price corrected down and rejected the Fibonacci support. Consolidation started, which could be ending as soon as today. This is because the next Fibonacci cycle is starting with the next 8-hour candle, and considering the current price action, it is expected to be a bullish cycle.
Based on the upper trendline of the extended ascendant channel, this could be a very fast uptrend, because 61.8% at 1.2472 is crossing with the channel trendline within the next two weeks.
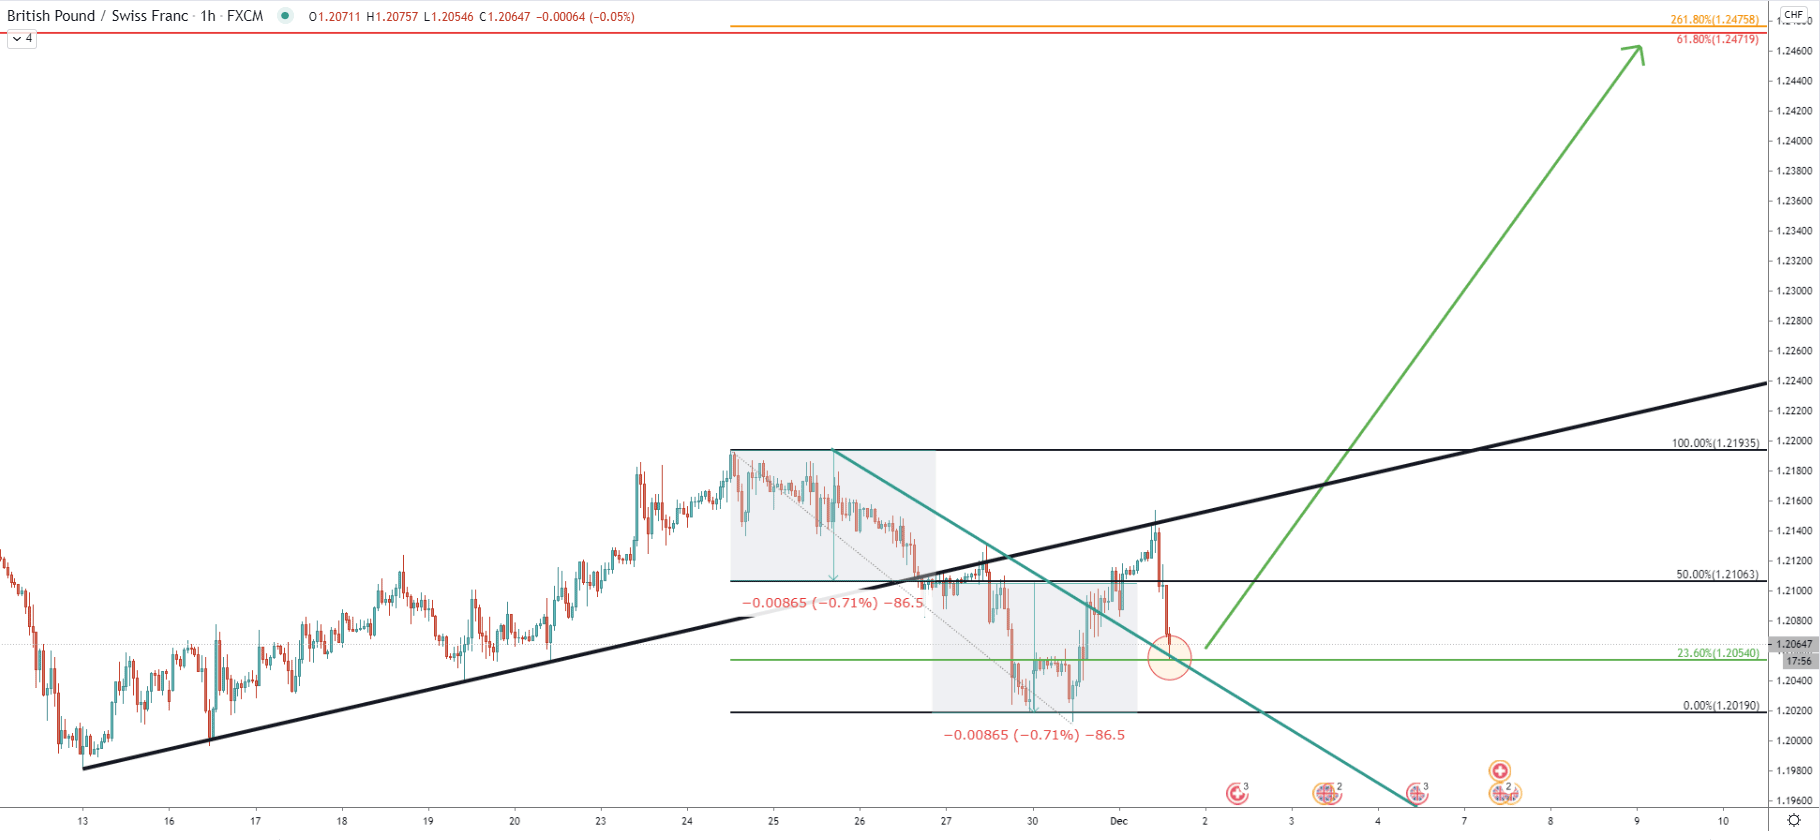
On the hourly chart, it can be seen that GBP/CHF could have reached the downside target after it broke below the uptrend trendline. This is because the distance from the top to the trendline breakout point equals the distance from the breakout point to the bottom, where GBP/CHF found the support at 1.2019.
Then GBP/CHF broke above the uptrend trendline and currently finding support at this trendline and rejecting the 1.2054, which is 23.6% Fibonacci support. Perhaps the uptrend is just around the corner and it could be a substantial increase in price in the coming weeks.
GBP/CHF could be at the very bottom of the corrective move down. And based on the Fibonacci cycles, the trend is about to start and might result in a 400+ upside potential during the next two weeks.
As per the weekly, 16-hour, and hourly charts, the key resistance area is located at 1.2470 area and is confirmed by 3 different Fibonacci retracement levels.
As per the daily chart. The key support is located at 1.1988. Only 1h and/or 4h break and close below will invalidate bullish forecast. In this scenario, GBP/CHF could be continuing a long term downtrend, or at the very least will re-test the uptrend trendline and/or the 1.1700 support area.
Support: 1.2054, 1.2019, 1.1988
Resistance: 1.2200, 1.2259, 1.2472