
Published: May 1st, 2020
The Swiss Franc continues to be outperformed by most currencies and in the long run it could be losing in value strongly. Today we would like to bring your attention to the EUR/CHF currency pair, which might hold a strong upside potential.
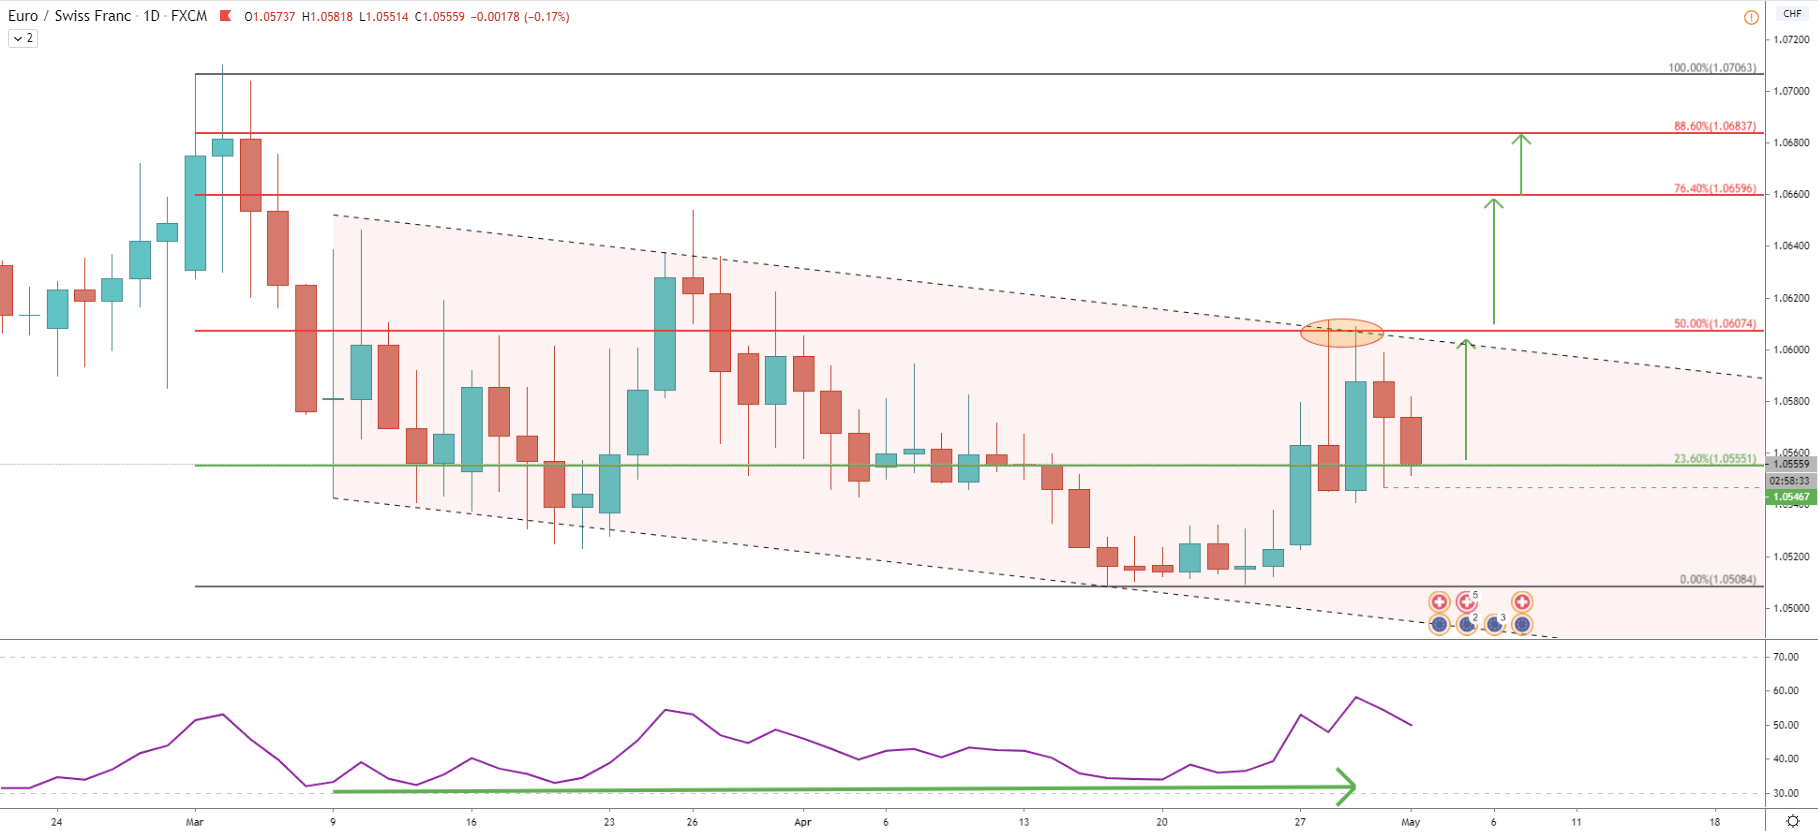
Starting off with the Daily chart analysis we can see that price is moving within the descending channel. In fact, the upper trendline of the channel has been rejected just couple of days ago, after which a correction down followed. Fibonacci applied to the overall downtrend shows, that price is stuck between 23.6% Fibs support (1.0555) and 50% Fibs resistance (1.0607). But at the same time, we can see the formation of the long term bullish divergence on the Daily chart, which can result in a much stronger move to the upside. However, the key resistance is located at 1.0607 and this is the nearest upside target for EUR/CHF. Only if/when there will be a daily close above, we can speak about more growth. Specifically towards either 76.4% Fibs at 1.0660, or 88.6% Fibs at 1.0683.
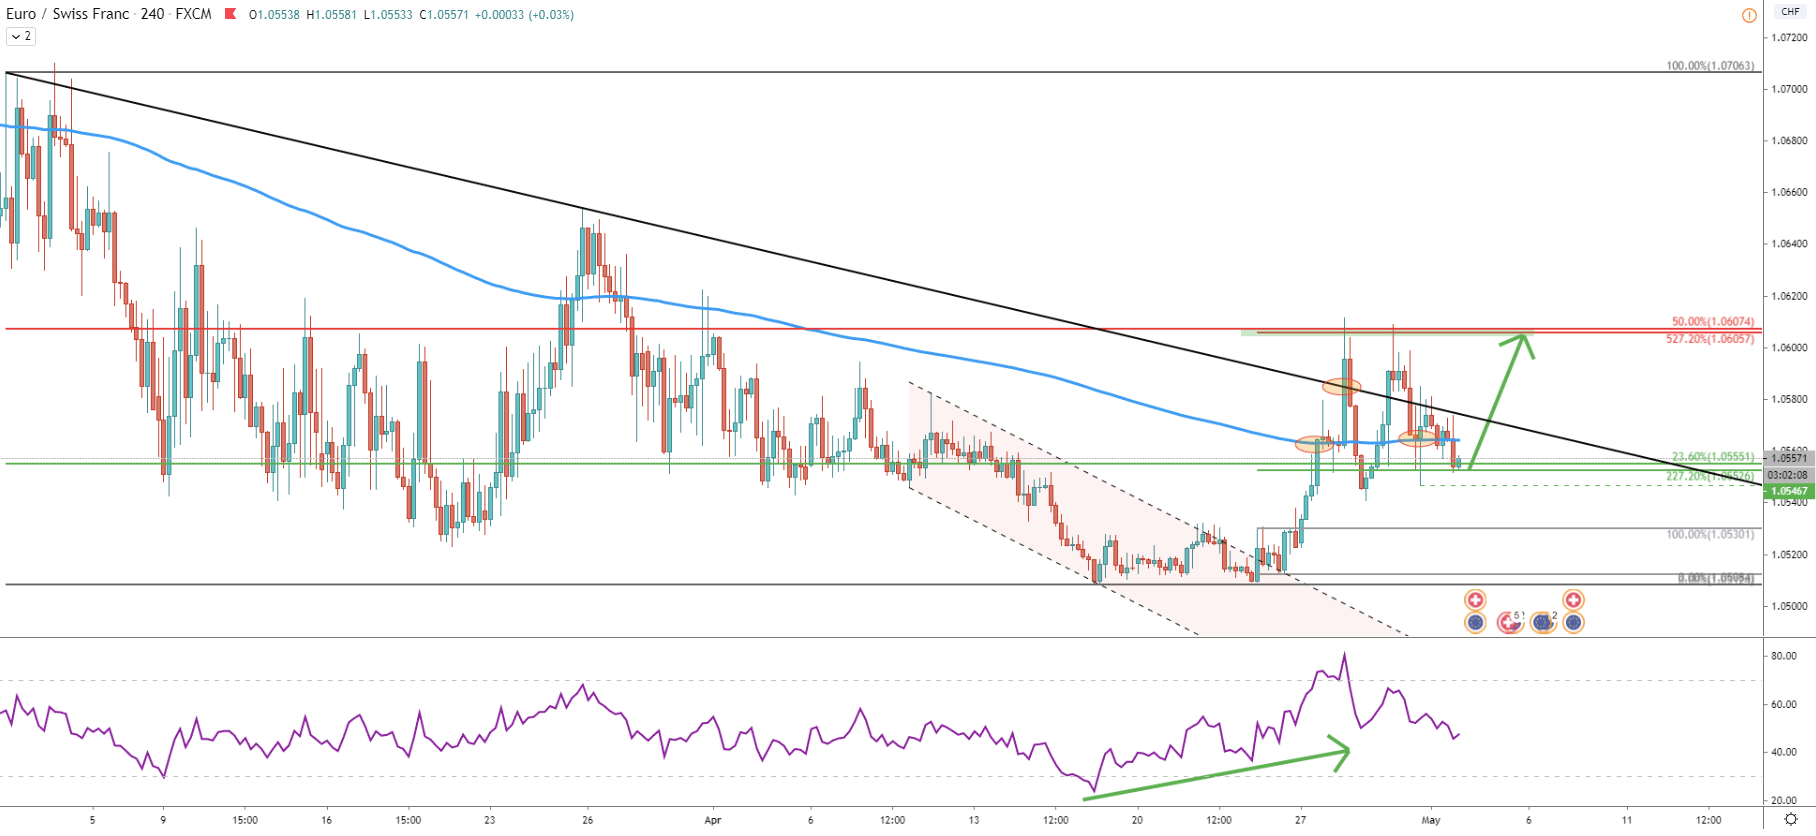
The 4H charts show that price broke above the descending channel after forming a Bullish Divergence on the RSI oscillator. At the same time, EUR/CHF broke above the downtrend trendline and the 200 Simple Moving Average, suggesting more upside growth. Currently, the price has corrected down to 23.6% Fibs, which still plays an important role. Prior to that, the pair cleanly rejected 200 SMA and afterwards produced a spike below, reaching the 1.0546 low. This price would determine the EUR/CHF destiny in the coming days. Because as long as price remains above this level, EUR/CHF should be expected to move north, at the very least towards the 1.0600 psychological resistance levels. But the break below this level would be quite negative for EUR/CHF.
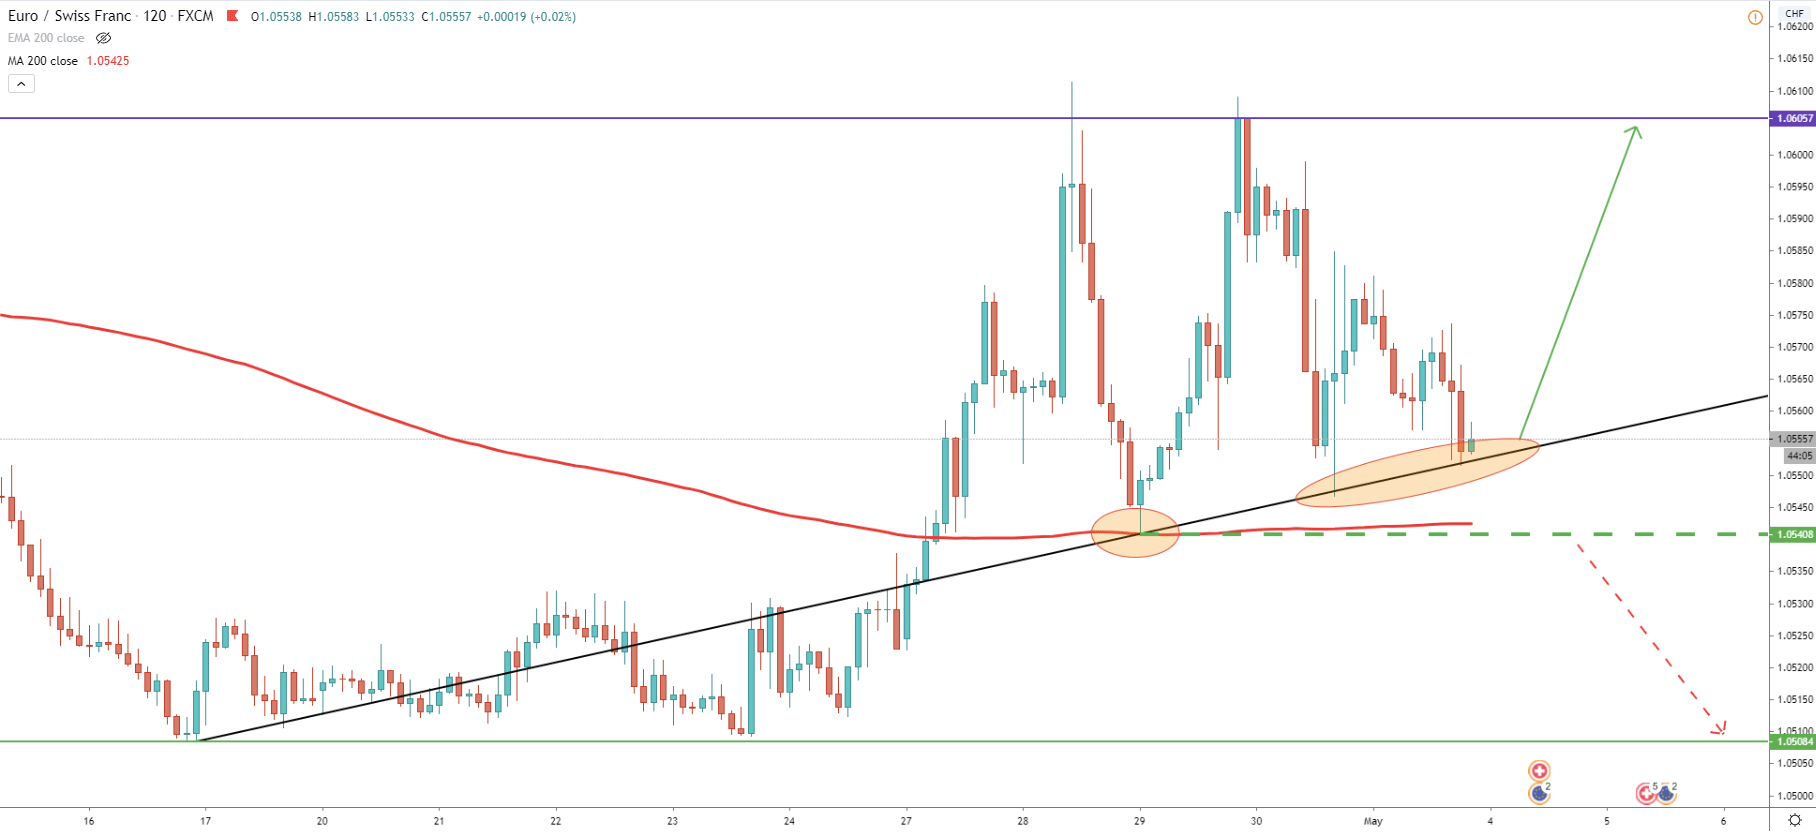
Another interesting chart is on the 2H timeframe. Here we can see that EUR/CHF cleanly rejected the 200 Simple Moving Averages and went up, producing a double top at 1.0600 area. At the same time, the uptrend trendline is being respected as currently price remains right on the trendline. According to the 200 SMA, the key support is seen at 1.0540, which means that price still can try to re-test this price area. But while 2H candle closing prices remain above this level, EUR/CHF should continue to rise further. The nearest resistance is 1.0605, and if reached, EUR/CHF can show a formation of a triple top. Also, if this level gets broken, there will be much more room for growth.
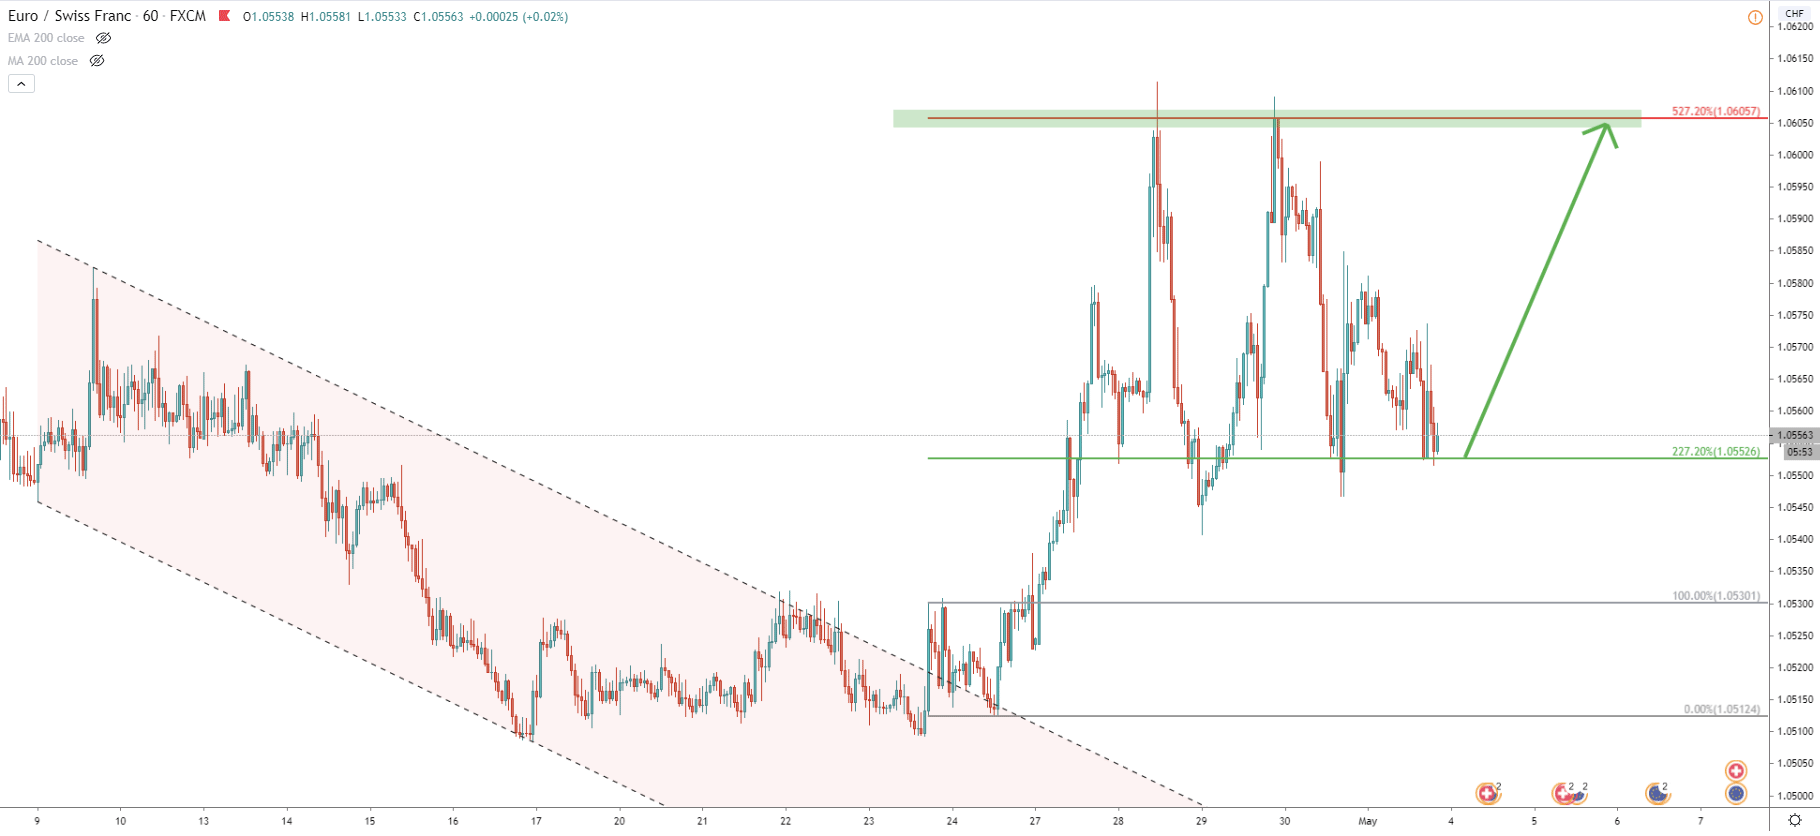
On the 1H chart, price broke above the descending channel. We have applied Fibonacci retracement indicator to the corrective wave down after the channel breakout. It shows that EUR/CHF has reached a 227.2% Fibonacci support level at 1.0552. Today it has been rejected cleanly, which goes to show, that bulls are still in control, As has been mentioned before, as long as this support holds, price is highly likely to test 527.2% Fibs resistance at 1.0605 once again.
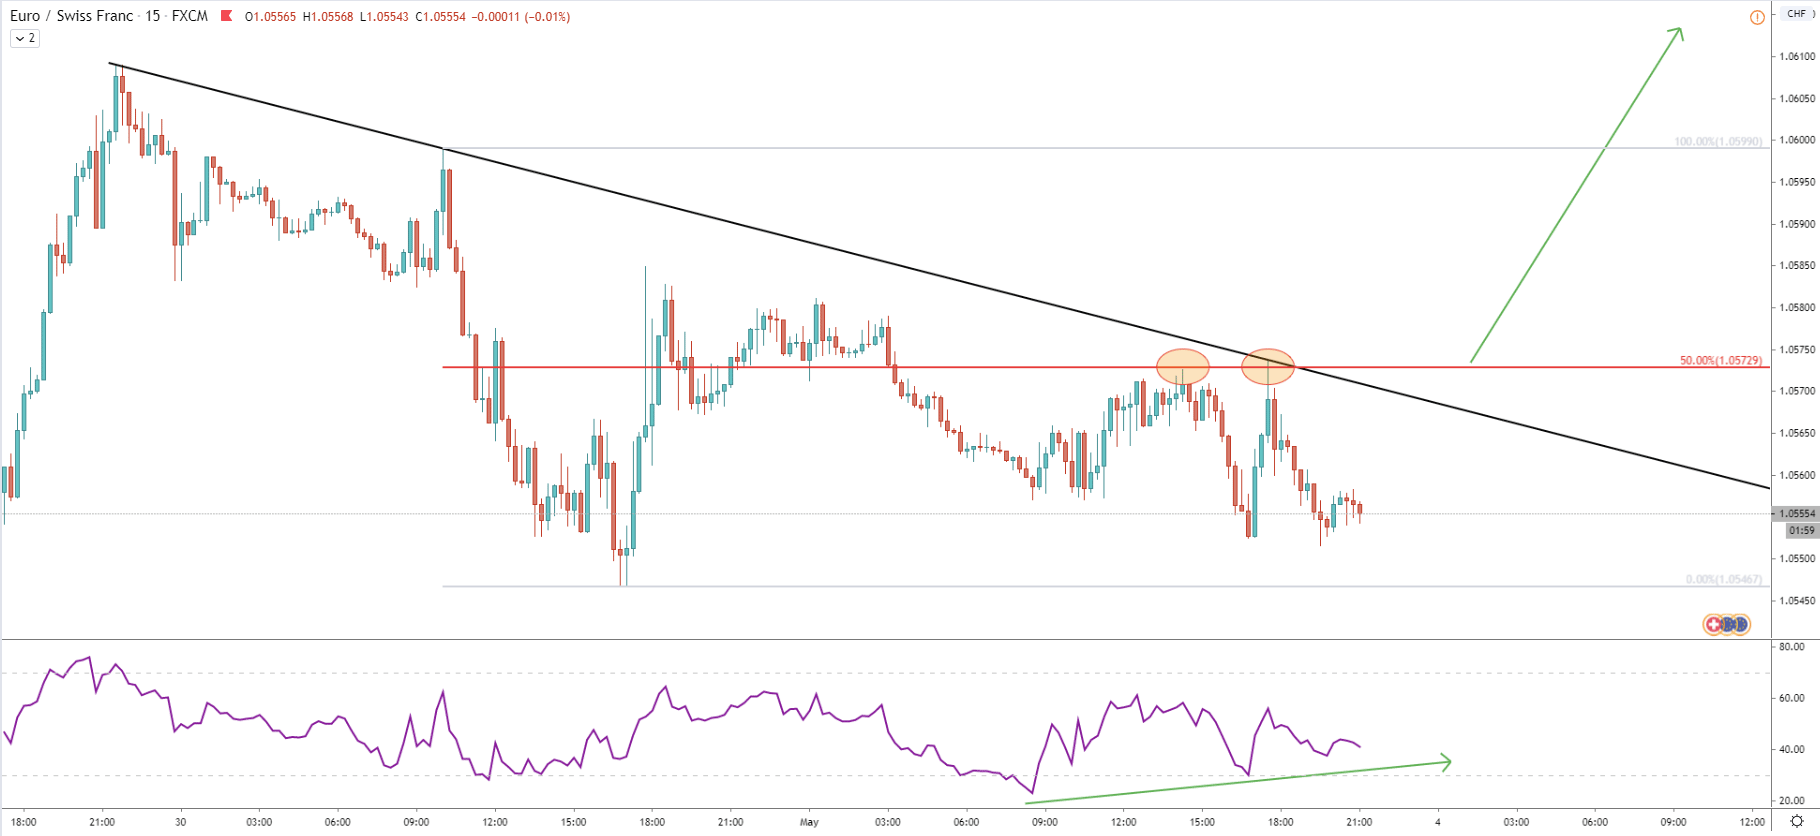
The 15M chart shows a mixed sentiment because the downtrend trendline was rejected cleanly, but at the same time, RSI oscillator formed a bullish divergence. This means, that EUR/CHF will continue to consolidate and it is important to watch the direction of the breakout. For example, if the price breaks below the 1.0546, sellers will re-gain the control. But on the other hand, if price will break above the 50% resistance at 1.0573, EUR/CHF strong bullish momentum should rise significantly.
EUR/CHF seems to be getting ready for a strong move to the upside, at least to produce a triple top near 1.0600 psychological resistance. But at the same time, there is some unclarity in the price action on the lower timeframes. Perhaps Mondays’ price action will provide more clues as to where EUR/CHF is heading, but it seems that the breakout to the upside has much higher probability at this sage. All-in-all, it is better to wait and see where the price will be moving early next week and then take action.
As per the Daily chart, we have multiple upside targets based on the Fibonacci retracement indicator. Nearest target and perhaps the most important one is seen near the previous area of resistance, which is 1.0600 area. If it gets broken to the upside, the next resistance level is seen at 76.4% Fibs at 1.0659. And the final target could be at 88.6% retracement level, which is 1.0683.
As per the 4H chart, the key support is located at 1.0546. 4H candle break and close below this price will invalidate bullish outlook and EUR/CHF is likely to move down, towards the previous area of support near 1.0500.
Support: 1.0546, 1.0555
Resistance: 1.0607, 1.0659, 1.0683